Ready-to-Drink (RTD) Beverages Market Size, Share, Trends and Analysis by Region, Product, Pack Size, Material and Segment Forecast to 2028

Powered by

Access in-depth insight and stay ahead of the market

Accessing the in-depth insights from the RTD Beverages report can help you:

  • Understand various stakeholders across different stages of the entire value chain and make informed business decisions.
  • Identify potential regions for mergers & acquisitions and venture financing activities.
  • Identify competitors’ capabilities to stay ahead in the
  • Identify segments and understand market trends, drivers, challenges, and opportunities for business growth.
  • Anticipate changes in demand and adjust the business development

How is our RTD Beverages’ report different from other reports in the market?

  • The report presents in-depth market sizing and forecasts at a segment level for more than 20 countries, including historical and forecast analysis for 2018-28.
  • Detailed segmentation by:
  • Product Type – Alcoholic Beverages and Non-Alcoholic Beverages
  • Pack size type – 25cl, 33cl, 33.5cl, 50cl, and Others
  • Pack material type – PET, Glass, Metal, Paper & Board, and Others
  • The report covers key market trends, along with driving and challenges factors impacting the RTD Beverages Market.
  • The report further analyzes the key consumer trends impacting the market growth to help stakeholders align their product portfolio in line with the latest developments.
  • The report analyzes the entire value chain to help stakeholders improve their processes and adopt emerging technologies to enhance productivity and cost-effectiveness.
  • The competitive landscape includes competitive positioning of leading companies and company share analysis in the IoT market that will help the stakeholders in the ongoing process of identifying, researching, and evaluating competitors, to gain insight to form their business strategies.

We recommend this valuable source of information to:

  • Soft Drinks Manufacturing Companies
  • Breweries
  • Startups
  • Head of Market Intelligence
  • Management Consultants
  • Food & Beverages Technology Companies
  • Equity Partners
  • Venture Capital firm

Get a Snapshot of the RTD Beverages Market, Download a Free Report Sample

Ready-to-Drink Beverages Market Report Overview

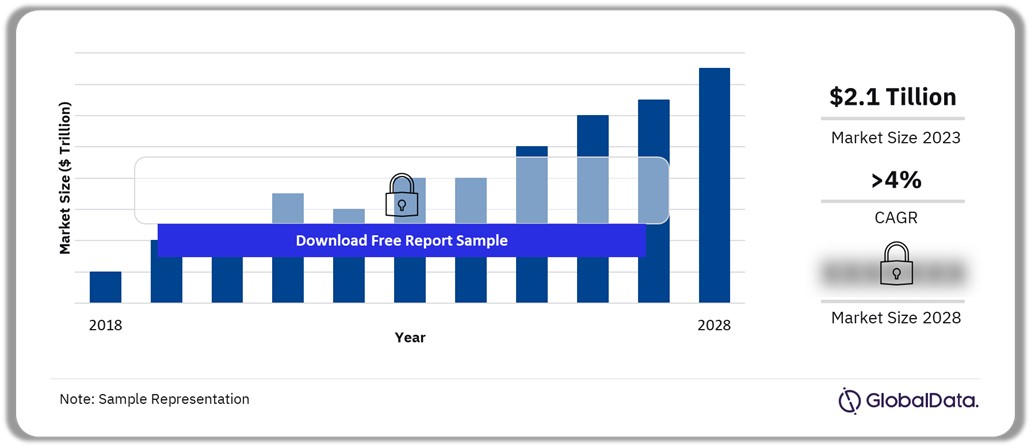
 The ready-to-drink beverages market was valued at $2.1 trillion in 2023 and will grow at a compound annual growth rate (CAGR) of more than 4% over the forecast period. The market comprises both alcoholic and non-alcoholic beverages that are available in single-serve containers, requiring no additional mixing, dilution, or preparation. Busy lifestyles of urban consumers, increasingly seeking RTD beverages for convenience of consumption on the go,without compromising on taste or quality. The products available in the RTD beverages market effectively address this demand by offering quick and convenient options for refreshment, hydration, and enjoyment.

Ready-to-Drink Beverages Market Outlook, 2018-2028 ($ Trillion)
Buy the Full Report for Additional Insights on the RTD Beverages Market Forecast, Download a Free Report Sample

The increasing focus on health and wellness, catapulted due to the COVID-19 pandemic, is a significant factor driving the growth of the RTD beverages market. Consumers are actively seeking healthier beverage choices, such as low-sugar, natural, and functional drinks. In response to this trend, manufacturers are introducing a wide range of healthier RTD options, including natural fruit and vegetable juices, plant-based beverages, and functional drinks fortified with vitamins, minerals, and antioxidants.

The enhanced consumer access to RTD beverages across multiple distribution channels, including supermarkets, convenience stores, online retailers, and vending machines, has also played a pivotal role in the market’s growth.

Strong marketing and branding strategies have been instrumental in propelling the RTD beverages market. Companies are allocating significant resources to advertising, social media, and other promotional endeavors to enhance brand recognition and entice consumers. Robust branding is essential for distinguishing products in a highly competitive market and fostering customer loyalty.

Furthermore, the rising disposable income of consumers, especially in emerging economies, is driving the demand for convenient and high-quality RTD beverages. Manufacturers are consistently monitoring and adapting to the evolving consumer preferences with product innovations. This dynamic environment reflects significant growth potential for the market.

Market Size (2023) $2.1 trillion
CAGR (2024 – 2028) >4%
Quantitative Units Revenue in $ Million/Billion; Packaging Volume in Million Pack Units and CAGR 8
Forecast Period 2024 – 2028
Historic Period 2018 – 2022
Report Scope & Coverage Revenue Forecast, Packaging Volume Forecast, Competitive Landscape, and Growth Trends
RTD beverages Product Type Alcoholic Beverages and Non-Alcoholic Beverages
RTD beverages Pack Size Type 25cl, 35.5cl, 33cl, 50cl, and Others
RTD beverages Pack Material Type PET, Glass, Metal, Paper & Boards, and Others
Key Companies The Coca-Cola Company; AB InBev; PepsiCo, Inc.; Heineken; Molson Coors; Carlsberg Group; Asahi Group Holdings, Ltd.; Nestle; Keurig Dr. Pepper Inc.; and Danone Group
Enquire & Decide Discover the perfect solution for your business needs. Enquire now and let us help you make an informed decision before making a purchase.


Ready-to-Drink Beverages Market Segmentation by Product Type

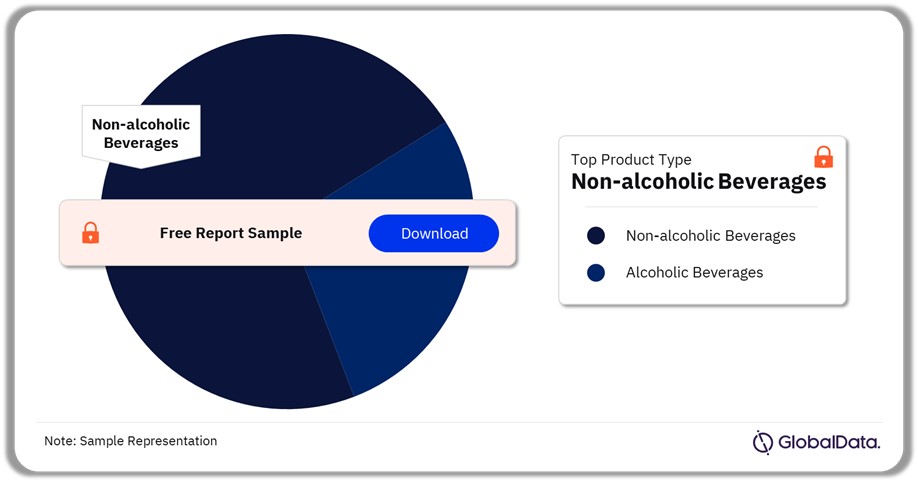
The RTD beverages market has been classified into alcoholic beverages and non-alcoholic beverages. In 2023, the non-alcoholic beverage products accounted for the highest revenue share of the market.  The non-alcoholic beverages include, carbonated soft drinks, dairy milk, energy drinks, still drinks, iced/RTD coffee drinks, and iced/RTD tea drinks. Furthermore, the rises in incidences of lactose intolerance has contributed to the increasing demand for plant-based beverages. Also, growing concerns about animal welfare and a rising focus on health consciousness are prompting consumers to opt for dairy-free alternatives in the market, offering functional benefits such as added vitamins and minerals, high protein, and low fat.

The alcoholic beverages category features beer and flavored alcoholic beverages, with beer accounting for a higher revenue share in 2023.

Ready-to-Drink Beverages Market Share by Product Type, 2023 (%)
Buy the Full Report for Ready-to-Drink Beverages Product Type Insights, Download a Free Report Sample

In terms of growth, the alcoholic beverages segment is expected to register faster growth than the non-alcoholic beverages segment. This growth will be driven by dynamic consumer behavior, as individuals seek premium products due to increased disposable income and a desire for sophisticated, high-quality experiences. Additionally, companies are continuously introducing new flavors, blends, and packaging formats, enhancing the appeal of RTD alcoholic beverages for consumers in search of unique and enjoyable drinking experiences.

However, the alcoholic beverages segment will witness a marginal decline in response to a growing trend of health-conscious consumers refraining from alcohol consumption. To counteract this, alcoholic beverage manufacturers are increasingly introducing alcohol-free beer and spirits in RTD pack formats.

Ready-to-Drink Beverages Market Segmentation by Pack Size Type

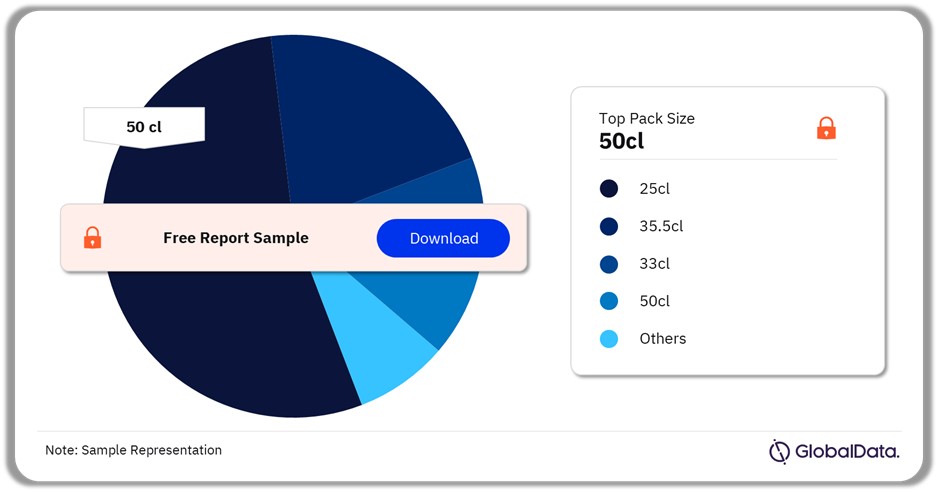
The RTD beverages are catered in various convenient and single-serve format pack sizes that are easier to consume. In pack size type, 50cl pack size was leading the global RTD Beverages Market in 2023. The use of 50cl pack size was high across beverages, including beer, packaged water, carbonates, and iced/RTD tea drinks, amongst others. Other leading pack sizes that witnessed the highest usage include, 33cl, 33.5cl, and 25cl in 2023.

Ready-to-Drink Beverages Market Share by Pack Size Type, 2023 (%)
Buy the Full Report for More Insights into the Ready-to-Drink Beverages Pack Size Type, Download a Free Report Sample

25cl pack size is expected to register the fastest growth among the other pack sizes. Smaller packs allow consumers to sample a variety of flavors or brands without needing to purchase a larger pack. Health-conscious working consumers mostly prefer the 25cl pack size as it offers a controlled portion coupled with convenience while on the go. Also, 25cl packs are commonly priced lower than larger pack sizes, thereby increasing accessibility to a broader range of consumers.

Ready-to-Drink Beverages Market Segmentation by Pack Material Type

The key pack materials type in the RTD beverages market are PET, glass, metal, and paper & board. In 2023, the PET pack material segment held the largest volume share in the market. This is attributed to its lightweight nature, which makes the beverage bottles easy to carry. Additionally, PET bottles’ transparency and clarity allow consumers to see the beverage inside, creating visual appeal and enabling them to assess the product’s quality before purchase.

Ready-to-Drink Beverages Market Share by Pack Material Type, 2023 (%)
Buy the Full Report for More Insights into the RTD Beverages Pack Material Type, Download a Free Report Sample

Amongst the pack material types, the PET segment is expected to register the fastest growth over the forecast period. The growth can be attributed to its high recyclability, appealing to consumers who prioritize ethical consumption and sustainable packaging solutions. Additionally, PET is a cost-effective packaging material compared to metal and glass, helping to reduce production costs and the price of the product.

RTD Beverages Market Segmentation by Region

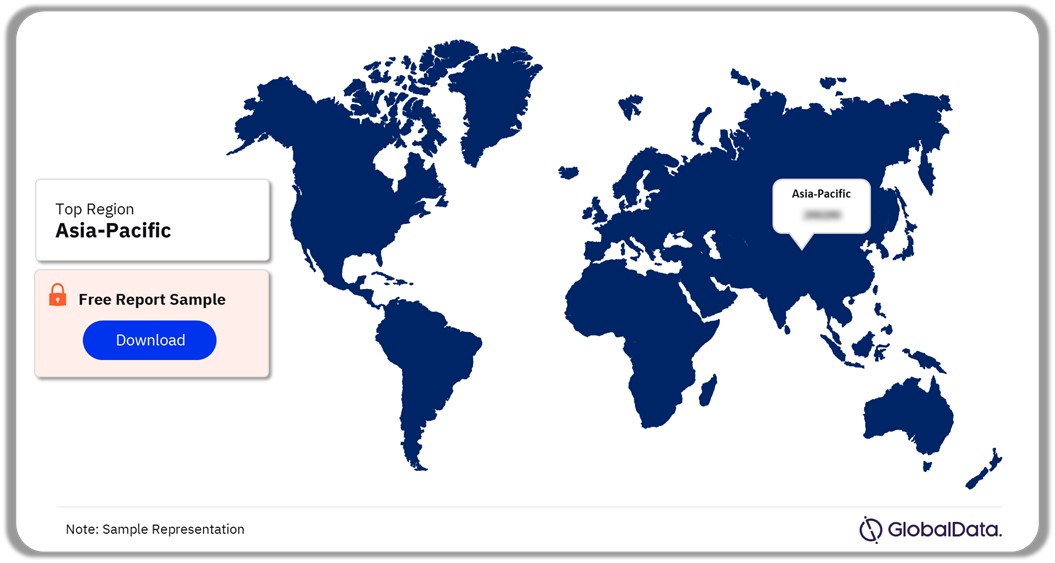
The global RTD beverages market was led by the Asia-Pacific region in 2023, which is expected to remain the largest market over the forecast period. The region includes emerging economies such as India, Vietnam, and Indonesia, where urbanization rates are on the rise. Busier, fast-paced lifestyles among urban dwellers, are resulting in a growing demand for RTD beverages, as they offer convenience and ease of consumption. Additionally, the region has been undergoing rapid economic development, resulting in a growing middle-class population with higher disposable incomes. This has enabled consumers to spend on convenient and premium RTD beverages.

RTD Beverages Market Share by Region, 2023 (%)
Buy the Full Report for More Regional Insights into the RTD Beverages Market, Download a Free Report Sample

The ready-to-drink beverages market in Asia Pacific is expected to witness the fastest revenue growth over the forecast period. Within the region, China dominates the market, holding the largest revenue share. This is attributed to its large population base with high disposable incomes, which allows consumers to seek premium RTD beverages made with high-quality ingredients. In addition, beverage manufacturers in China have been making significant investments in product innovation and marketing campaigns to build brand awareness and attract consumers.

On the other hand, India is set to outpace other countries in the regional RTD Beverages Market over the forecast period. This is primarily due to the influence of Western culture on India’s large young population, impacting lifestyle trends and beverage consumption habits. India’s large and diverse population has varied taste preferences, motivating manufacturers to offer a wide range of flavors in RTD beverages, thus contributing to market growth. In addition, the hot weather conditions in India foster a favorable environment for the RTD Beverages Market to thrive, as consumers look for convenient, refreshing, and hydrating options to cope with the heat.

Ready-to-Drink Beverages Market - Competitive Landscape

Ready-to-Drink Beverages Market – Competitive Landscape

The RTD beverages market is fragmented, with many companies operating across various product types. While private labels compete with established brands in the non-alcoholic beverages segment in terms of both price and quality, their presence in the alcoholic beverages segment is minimal. Companies in the market have a strong foothold in their respective product offerings. For instance, The Coca-Cola Company dominates the RTD non-alcoholic beverages sector, followed by PepsiCo, Inc., and Nestle, whereas the RTD alcoholic beverages are led by AB InBev, Heineken, and Molson Coors.

Leading Companies in the Ready-to-Drink Beverages Market

  • The Coca-Cola Company
  • AB InBev
  • PepsiCo, Inc.
  • Heineken
  • Molson Coors
  • Carlsberg Group
  • Asahi Group Holdings, Ltd.
  • Nestle
  • Keurig Dr. Pepper Inc.
  • Danone Group

Other Ready-to-Drink Beverages Market Companies Mentioned

Kirin Group, Yili Group, Constellation Brands, Suntory Holdings Ltd., Monster Beverage Corporation, Red Bull GmbH, China Mengniu Dairy Co., Ltd., BlueTriton Brands, Diageo plc, Starbucks, Unilever, Groupe Lactalis SA, Thai Beverage Company.

Buy the Full Report to Know More About Leading Companies in the RTD Beverages Market
Download a Free Report Sample

RTD Beverages Market Scope

GlobalData Plc has segmented the RTD Beverages Market report by product type, packaging type, and region:

RTD Beverages Market Product Type Outlook (Revenue, $ Million, 2018-2028)

  • Alcoholic Beverages
  • Non-Alcoholic Beverages

RTD Beverages Market Pack Size Type Outlook (Volume, Pack Units Million, 2018-2028)

  • 25cl
  • 5cl
  • 33cl
  • 50cl
  • Others

RTD Beverages Market Pack Material Type Outlook (Volume, Pack Units Million, 2018-2028)

  • PET
  • Glass
  • Metal
  • Paper & Board
  • Others

RTD Beverages Market Regional Outlook (Revenue, $ Million, 2018-2028)

  • North America
    • US
    • Canada
  • Europe
    • Germany
    • UK
    • Russia
    • Rest of Europe
  • Asia Pacific
    • China
    • Japan
    • India
    • Rest of Asia Pacific
  • South & Central America
    • Brazil
    • Mexico
    • Colombia
    • Rest of South & Central America
  • Middle East & Africa
    • South Africa
    • Nigeria
    • Ethiopia
    • Rest of Middle East & Africa

Key Players

The Coca-Cola Company
A-BInBev
PepsiCo, Inc.
Heineken
Molson Coors
Carlsberg Group
Asahi Group Holdings, Ltd.
Nestle
Keurig Dr. Pepper Inc.
Danone Group

Table of Contents

  • 01. Executive Summary
  • 1.1 RTD Beverages Market Snapshot, 2017-2027
  • 02. Research Scope & Segmentation
  • 2.1 RTD beverages: Market Segmentation and Scope
  • 2.2 Market & Segment Definitions
  • 03. Market Overview & Industry Analysis
  • 3.1 Market Overview
  • 3.2 Industry Value Chain Analysis
  • 3.3 Market Drivers Analysis
  • 3.4 Market Challenges Analysis
  • 3.5 Key Consumer Trends
  • 3.6 Technological Trends
  • 3.7 Macroeconomic Trends
  • 3.8 Regulatory Trends
  • 04. Dashboard Analytics
  • 4.1 Merger & Acquisition Analytics, 2019-2022
  • 4.2 Venture Finance Analytics, 2019-2022
  • 4.3 Patent Analytics, 2019-2022
  • 05. RTD beverages Revenue Opportunity & Forecast
  • 5.1 Global RTD beverages Market – Revenue Snapshot, 2017-2027 ($ Trillion)
  • 5.2 Global RTD beverages Market – Packaging Volume Snapshot, 2017-2027 (Unit Packs Trillion)
  • 5.3 Global RTD beverages Market Revenue & Forecasts, by Region, 2017-2027 ($ Billion)
  • 5.4 Global RTD beverages Market Packaging Volume & Forecasts, by Region, 2017-2027 (Unit Packs Billion)
  • 5.5 Global RTD beverages Market Size & Forecasts, by Product Type, 2017-2027 ($ Billion)
  • 5.6 Global RTD beverage Market Packaging Volume by Product Type, 2017-2027 (Unit Packs Billion)
  • 5.7 Global RTD beverages Market Packaging Volume, by Pack Size Type, 2017-2027 (Unit Packs Billion)
  • 5.8 Global RTD beverages Market Packaging Volume & Forecasts, by Pack Material Type, 2017-2027 (Unit Packs Billion)
  • 06. RTD beverages Revenue Opportunity & Forecasts By Region
  • 6.1 RTD beverages Market – Regional Deep Dive
  • 6.2 Asia Pacific Market Revenue Snapshot

    • 6.2.1 Asia Pacific RTD beverages Market Size & Forecasts, by Country, 2017-2027 ($ Million)
    • 6.2.2 Asia Pacific RTD beverages Market Size & Forecasts, by Product Type, 2017-2027 ($ Million)
    • 6.2.3 China RTD beverages Market Size & Forecasts, by Product Type, 2017-2027 ($ Million)
    • 6.2.4 Japan RTD beverages Market Size & Forecasts, by Product Type, 2017-2027 ($ Million)
    • 6.2.5 India RTD beverages Market Size & Forecasts, by Product Type, 2017-2027 ($ Million)
    • 6.2.6 Rest of Asia Pacific RTD beverages Market Size & Forecasts, by Product Type, 2017-2027 ($ Million)

  • 6.3 Asia Pacific Market Packaging Volume Snapshot

    • 6.3.1 Asia Pacific RTD beverages Market Packaging Volume & Forecasts, by Pack Size Type, 2017-2027 (Unit Packs Billion)
    • 6.3.2 Asia Pacific RTD beverages Market Packaging Volume & Forecasts, by Pack Material Type, 2017-2027 (Unit Packs Billion)
    • 6.3.3 China RTD beverages Market Size & Forecasts, by Pack Size Type, 2017-2027 Unit Packs Billion)
    • 6.3.4 China RTD beverages Market Size & Forecasts, by Pack Material Type, 2017-2027 Unit Packs Billion)
    • 6.3.5 Japan RTD beverages Market Size & Forecasts, by Pack Size Type, 2017-2027 Unit Packs Billion)
    • 6.3.6 Japan RTD beverages Market Size & Forecasts, by Pack Material Type, 2017-2027 Unit Packs Billion)
    • 6.3.7 India RTD beverages Market Size & Forecasts, by Pack Size Type, 2017-2027 Unit Packs Billion)
    • 6.3.8 India RTD beverages Market Size & Forecasts, by Pack Material Type, 2017-2027 Unit Packs Billion)
    • 6.3.9 Rest of Asia Pacific RTD beverages Market Size & Forecasts, by Pack Size Type, 2017-2027 (Unit Packs Billion)
    • 6.3.10 Rest of Asia Pacific RTD beverages Market Size & Forecasts, by Pack Material Type, 2017-2027 (Unit Packs Billion)
    • 6.3.11 Rest of Asia Pacific RTD beverages Market Size & Forecasts, by Distribution Type, 2017-2027 ($ Million)

  • 6.4 North America Market Revenue Snapshot

    • 6.4.1 North America RTD beverages Market Size & Forecasts, by Country, 2017-2027 ($ Million)
    • 6.4.2 North America RTD beverages Market Size & Forecasts, by Product Type, 2017-2027 ($ Million)
    • 6.4.3 United States RTD beverages Market Size & Forecasts, by Product Type, 2017-2027 ($ Million)
    • 6.4.4 Canada RTD beverages Market Size & Forecasts, by Product Type, 2017-2027 ($ Million)

  • 6.5 North America Market Packaging Volume Snapshot

    • 6.5.1 North America RTD beverages Market Packaging Volume & Forecasts, by Pack Size Type, 2017-2027 (Unit Packs Billion)
    • 6.5.2 North America RTD beverages Market Packaging Volume & Forecasts, by Pack Material Type, 2017-2027 (Unit Packs Billion)
    • 6.5.3 United States RTD beverages Market Size & Forecasts, by Pack Size Type, 2017-2027 Unit Packs Billion)
    • 6.5.4 United States RTD beverages Market Size & Forecasts, by Pack Material Type, 2017-2027 Unit Packs Billion)
    • 6.5.5 Canada RTD beverages Market Size & Forecasts, by Pack Size Type, 2017-2027 Unit Packs Billion)
    • 6.5.6 Canada RTD beverages Market Size & Forecasts, by Pack Material Type, 2017-2027 Unit Packs Billion)

  • 6.6 Europe Market Revenue Snapshot

    • 6.6.1 Europe RTD beverages Market Size & Forecasts, by Country, 2017-2027 ($ Million)
    • 6.6.2 Europe beverages Market Size & Forecasts, by Product Type, 2017-2027 ($ Million)
    • 6.6.3 UK RTD beverages Market Size & Forecasts, by Product Type, 2017-2027 ($ Million)
    • 6.6.4 Germany RTD beverages Market Size & Forecasts, by Product Type, 2017-2027 ($ Million)
    • 6.6.5 Russia RTD beverages Market Size & Forecasts, by Product Type, 2017-2027 ($ Million)
    • 6.6.6 Rest of Europe RTD beverages Market Size & Forecasts, by Product Type, 2017-2027 ($ Million)

  • 6.7 Europe Market Packaging Volume Snapshot

    • 6.7.1 Europe RTD beverages Market Packaging Volume & Forecasts, by Pack Size Type, 2017-2027 (Unit Packs Billion)
    • 6.7.2 Europe RTD beverages Market Packaging Volume & Forecasts, by Pack Material Type, 2017-2027 (Unit Packs Billion)
    • 6.7.3 UK RTD beverages Market Size & Forecasts, by Pack Size Type, 2017-2027 Unit Packs Billion)
    • 6.7.4 UK RTD beverages Market Size & Forecasts, by Pack Material Type, 2017-2027 Unit Packs Billion)
    • 6.7.5 Germany RTD beverages Market Size & Forecasts, by Pack Size Type, 2017-2027 Unit Packs Billion)
    • 6.7.6 Germany RTD beverages Market Size & Forecasts, by Pack Material Type, 2017-2027 Unit Packs Billion)
    • 6.7.7 Russia RTD beverages Market Size & Forecasts, by Pack Size Type, 2017-2027 Unit Packs Billion)
    • 6.7.8 Russia RTD beverages Market Size & Forecasts, by Pack Material Type, 2017-2027 Unit Packs Billion)
    • 6.7.9 Rest of Europe RTD beverages Market Size & Forecasts, by Pack Size Type, 2017-2027 (Unit Packs Billion)
    • 6.7.10 Rest of Europe RTD beverages Market Size & Forecasts, by Pack Material Type, 2017-2027 (Unit Packs Billion)

  • 6.8 South & Central America Market Revenue Snapshot

    • 6.8.1 South & Central America RTD beverages Market Size & Forecasts, by Country, 2017-2027 ($ Million)
    • 6.8.2 South & Central America beverages Market Size & Forecasts, by Product Type, 2017-2027 ($ Million)
    • 6.8.3 Brazil RTD beverages Market Size & Forecasts, by Product Type, 2017-2027 ($ Million)
    • 6.8.4 Mexico RTD beverages Market Size & Forecasts, by Product Type, 2017-2027 ($ Million)
    • 6.8.5 Colombia RTD beverages Market Size & Forecasts, by Product Type, 2017-2027 ($ Million)
    • 6.8.6 Rest of South & Central America RTD beverages Market Size & Forecasts, by Product Type, 2017-2027 ($ Million)

  • 6.9 South & Central America Market Packaging Volume Snapshot

    • 6.9.1 South & Central America RTD beverages Market Packaging Volume & Forecasts, by Pack Size Type, 2017-2027 (Unit Packs Billion)
    • 6.9.2 South & Central America RTD beverages Market Packaging Volume & Forecasts, by Pack Material Type, 2017-2027 (Unit Packs Billion)
    • 6.9.3 Brazil RTD beverages Market Size & Forecasts, by Pack Size Type, 2017-2027 Unit Packs Billion)
    • 6.9.4 Brazil RTD beverages Market Size & Forecasts, by Pack Material Type, 2017-2027 Unit Packs Billion)
    • 6.9.5 Mexico RTD beverages Market Size & Forecasts, by Pack Size Type, 2017-2027 Unit Packs Billion)
    • 6.9.6 Mexico RTD beverages Market Size & Forecasts, by Pack Material Type, 2017-2027 Unit Packs Billion)
    • 6.9.7 Colombia RTD beverages Market Size & Forecasts, by Pack Size Type, 2017-2027 Unit Packs Billion)
    • 6.9.8 Colombia RTD beverages Market Size & Forecasts, by Pack Material Type, 2017-2027 Unit Packs Billion)
    • 6.9.9 Rest of South & Central America RTD beverages Market Size & Forecasts, by Pack Size Type, 2017-2027 (Unit Packs Billion)
    • 6.9.10 Rest of South & Central America RTD beverages Market Size & Forecasts, by Pack Material Type, 2017-2027 (Unit Packs Billion)

  • 6.10 Middle East & Africa Market Revenue Snapshot

    • 6.10.1 Middle East & Africa RTD beverages Market Size & Forecasts, by Country, 2017-2027 ($ Million)
    • 6.10.2 Middle East & Africa beverages Market Size & Forecasts, by Product Type, 2017-2027 ($ Million)
    • 6.10.3 South Africa RTD beverages Market Size & Forecasts, by Product Type, 2017-2027 ($ Million)
    • 6.10.4 Nigeria RTD beverages Market Size & Forecasts, by Product Type, 2017-2027 ($ Million)
    • 6.10.5 Ethiopia RTD beverages Market Size & Forecasts, by Product Type, 2017-2027 ($ Million)
    • 6.10.6 Rest of Middle East & Africa RTD beverages Market Size & Forecasts, by Product Type, 2017-2027 ($ Million)

  • 6.11 Middle East & Africa Market Packaging Volume Snapshot

    • 6.11.1 Middle East & Africa beverages Market Packaging Volume & Forecasts, by Pack Size Type, 2017-2027 (Unit Packs Billion)
    • 6.11.2 Middle East & Africa RTD beverages Market Packaging Volume & Forecasts, by Pack Material Type, 2017-2027 (Unit Packs Billion)
    • 6.11.3 South Africa RTD beverages Market Size & Forecasts, by Pack Size Type, 2017-2027 Unit Packs Billion)
    • 6.11.4 South Africa RTD beverages Market Size & Forecasts, by Pack Material Type, 2017-2027 Unit Packs Billion)
    • 6.11.5 Nigeria RTD beverages Market Size & Forecasts, by Pack Size Type, 2017-2027 Unit Packs Billion)
    • 6.11.6 Nigeria RTD beverages Market Size & Forecasts, by Pack Material Type, 2017-2027 Unit Packs Billion)
    • 6.11.7 Ethiopia RTD beverages Market Size & Forecasts, by Pack Size Type, 2017-2027 Unit Packs Billion)
    • 6.11.8 Ethiopia RTD beverages Market Size & Forecasts, by Pack Material Type, 2017-2027 Unit Packs Billion)
    • 6.11.9 Rest of Middle East & Africa RTD beverages Market Size & Forecasts, by Pack Size Type, 2017-2027 (Unit Packs Billion)
    • 6.11.10 Rest of Middle East & Africa RTD beverages Market Size & Forecasts, by Pack Material Type, 2017-2027 (Unit Packs Billion)

  • 07. Competitive Landscape
  • 7.1 Global RTD beverages Market Competitive Landscape, 2022
  • 7.2 Global RTD beverages Market Competitive Landscape, by Product Type, 2022
  • 7.3 Asia Pacific RTD beverages Market Competitive Landscape, 2022
  • 7.4 North America RTD beverages Market Competitive Landscape, 2022
  • 7.5 Europe RTD beverages Market Competitive Landscape, 2022
  • 7.6 Middle East & Africa RTD beverages Market Competitive Landscape, 2022
  • 7.7 South & Central America RTD beverages Market Competitive Landscape, 2022
  • 08. Company Profiles
  • 8.1 Company Overview
  • 8.2 Financial Performance
  • 8.3 Strategic Initiatives
  • 8.4 Key Employees
  • 09. Research Methodology
  • 10. About Us

Table

Table 1 List of Key Players by Product Type

Table 2 Technological Trends

Table 3 Macroeconomic Trends

Table 4 Regulatory Trends

Table 5 Top Five Merger & Acquisition Deals in the RTD Beverages Market, 2022-2023 (YTD)

Table 6 Top Five Venture Finance Deals in the RTD Beverages Market, 2022-2023 (YTD)

Figures

Fig 1 Top RTD beverages Country Markets, 2022 vs 2027

Fig 2 RTD beverages CAGR by Pack Size Type, 2023 -2027

Fig 3 Major Trends Impacting the RTD Beverages Market

Fig 4 RTD Beverages Market – Segmentation

Fig 5 Global consumer spending pattern on RTD Beverages, Q1 2023

Fig 6 RTD Non-Alcoholic Beverages – Value Chain

Fig 7 RTD Alcoholic Beverages – Value Chain

Fig 8 Deal Volume: Global RTD beverages M&A Deals, 2019-2022

Fig 9 Deal Value: Global RTD beverages M&A Deals, 2019-2022 ($M)

Fig 10 Geographical Distribution: RTD beverages Deals (volume %), 2019-2022

Fig 11 Geographical Distribution: RTD beverages Deals, 2019-2022

Fig 12 Deal Volume: Global RTD beverages VF Deals, 2019-2022

Fig 13 Deal Volume: Global RTD beverages VF Deals ($M), 2019-2022

Fig 14 Geographical Distribution: RTD beverages VF Deals (volume %), 2019-2022

Fig 15 Geographical Distribution: RTD beverages VF Deals, 2019-2022

Fig 16 Global Filing/Grant Trends in RTD beverages, 2020-2022

Fig 17 RTD beverages Patents: Trending Sectors by Total Publications, 2019-2022

Fig 18 Geographical Distribution: RTD beverages Patents by Total Publication (%), 2019-2022

Fig 19 Top Patent Assignee for RTD beverages by Total Publications, 2019-2022

Fig 20 Geographical Distribution: RTD beverages Patents across all Sectors by Total Publications, 2019-2022

Fig 21 Global RTD beverages Market – Revenue Opportunity Forecast, 2017-2027 ($ Trillion)

Fig 22 Global RTD beverages Market – Packaging Volume Forecast, 2017-2027 (Unit Packs Trillion)

Fig 23 Global RTD beverages Market Revenue, By Region, 2017-2027 ($ Billion)

Fig 24 Global RTD beverages Market Packaging Volume, By Region, 2017-2027 (Unit Packs Billion)

Fig 32 Global RTD beverages Market Revenue, By Product Type, 2017-2027 ($ Billion)

Fig 33 Global RTD beverages Market Packaging Volume, By Product Type, 2017-2027 (Unit Packs Billion)

Fig 34 Global RTD beverages Market Packaging Volume, By Pack Size Type, 2017-2027 (Unit Packs Billion)

Fig 33 Global RTD beverages Market Packaging Volume, By Pack Material Type, 2017-2027 (Unit Packs Billion)

Fig 34 Asia Pacific RTD beverages Market – Revenue Opportunity Forecast, 2017-2027 ($ Billion)

Fig 35 Asia Pacific RTD beverages Market Revenue, By Country, 2017-2027 ($ Billion)

Fig 36 Asia Pacific RTD beverages Market Revenue, By Product Type, 2017-2027 ($ Billion)

Fig 37 Asia Pacific RTD beverages Market – Packaging Volume Forecast, 2017-2027 (Unit Packs Billion)

Fig 38 Asia Pacific RTD beverages Market Packaging Volume, By Country, 2017-2027 (Unit Packs Billion)

Fig 39 Asia Pacific RTD beverages Market Packaging Volume, By Product Type, 2017-2027 (Unit Packs Billion)

Fig 40 Asia Pacific RTD beverages Market Packaging Volume, By Pack Size Type, 2017-2027 (Unit Packs Billion)

Fig 40 Asia Pacific RTD beverages Market Packaging Volume, By Pack Material Type, 2017-2027 (Unit Packs Billion)

Fig 41 China RTD beverages Market Revenue, By Product Type, 2017-2027 ($ Million)

Fig 40 China RTD beverages Market Packaging Volume, By Product Type, 2017-2027 (Unit Packs Billion)

Fig 42 China RTD beverages Market Volume, By Pack Size Type, 2017-2027 (Unit Packs Billion)

Fig 43 China RTD beverages Market Volume, By Pack Material Type, 2017-2027 (Unit Packs Billion)

Fig 44 Japan RTD beverages Market Revenue, By Product Type, 2017-2027 ($ Million)

Fig 45 Japan RTD beverages Market Packaging Volume, By Product Type, 2017-2027 (Unit Packs Billion)

Fig 46 Japan RTD beverages Market Volume, By Pack Size Type, 2017-2027 (Unit Packs Billion)

Fig 47 Japan RTD beverages Market Volume, By Pack Material Type, 2017-2027 (Unit Packs Billion)

Fig 48 India RTD beverages Market Revenue, By Product Type, 2017-2027 ($ Million)

Fig 49 India RTD beverages Market Packaging Volume, By Product Type, 2017-2027 (Unit Packs Billion)

Fig 50 India RTD beverages Market Volume, By Pack Size Type, 2017-2027 (Unit Packs Billion)

Fig 51 India RTD beverages Market Volume, By Pack Material Type, 2017-2027 (Unit Packs Billion)

Fig 52 Rest of Asia Pacific RTD beverages Market Revenue, By Product Type, 2017-2027 ($ Million)

Fig 53 Rest of Asia Pacific RTD beverages Market Packaging Volume, By Product Type, 2017-2027 (Unit Packs Billion)

Fig 54 Rest of Asia Pacific RTD beverages Market Volume, By Pack Size Type, 2017-2027 (Unit Packs Billion)

Fig 55 Rest of Asia Pacific RTD beverages Market Volume, By Pack Material Type, 2017-2027 (Unit Packs Billion)

Fig 56 North America RTD beverages Market – Revenue Opportunity Forecast, 2017-2027 ($ Billion)

Fig 57 North America RTD beverages Market Revenue, By Country, 2017-2027 ($ Billion)

Fig 58 North America RTD beverages Market Revenue, By Product Type, 2017-2027 ($ Billion)

Fig 59 North America RTD beverages Market – Packaging Volume Forecast, 2017-2027 (Unit Packs Billion)

Fig 60 North America RTD beverages Market Packaging Volume, By Country, 2017-2027 (Unit Packs Billion)

Fig 61 North America RTD beverages Market Packaging Volume, By Product Type, 2017-2027 (Unit Packs Billion)

Fig 62 North America RTD beverages Market Packaging Volume, By Pack Size Type, 2017-2027 (Unit Packs Billion)

Fig 63 North America RTD beverages Market Packaging Volume, By Pack Material Type, 2017-2027 (Unit Packs Billion)

Fig 64 US RTD beverages Market Revenue, By Product Type, 2017-2027 ($ Million)

Fig 65 US RTD beverages Market Packaging Volume, By Product Type, 2017-2027 (Unit Packs Billion)

Fig 66 US RTD beverages Market Volume, By Pack Size Type, 2017-2027 (Unit Packs Billion)

Fig 67 US RTD beverages Market Volume, By Pack Material Type, 2017-2027 (Unit Packs Billion)

Fig 68 Canada RTD beverages Market Revenue, By Product Type, 2017-2027 ($ Million)

Fig 69 Canada RTD beverages Market Packaging Volume, By Product Type, 2017-2027 (Unit Packs Billion)

Fig 70 Canada RTD beverages Market Volume, By Pack Size Type, 2017-2027 (Unit Packs Billion)

Fig 71 Canada RTD beverages Market Volume, By Pack Material Type, 2017-2027 (Unit Packs Billion)

Fig 72 Europe RTD beverages Market – Revenue Opportunity Forecast, 2017-2027 ($ Billion)

Fig 73 Europe RTD beverages Market Revenue, By Country, 2017-2027 ($ Billion)

Fig 74 Europe RTD beverages Market Revenue, By Product Type, 2017-2027 ($ Billion)

Fig 75 Europe beverages Market – Packaging Volume Forecast, 2017-2027 (Unit Packs Billion)

Fig 76 Europe beverages Market Packaging Volume, By Country, 2017-2027 (Unit Packs Billion)

Fig 77 Europe beverages Market Packaging Volume, By Product Type, 2017-2027 (Unit Packs Billion)

Fig 78 Europe beverages Market Packaging Volume, By Pack Size Type, 2017-2027 (Unit Packs Billion)

Fig 79 Europe beverages Market Packaging Volume, By Pack Material Type, 2017-2027 (Unit Packs Billion)

Fig 80 UK RTD beverages Market Revenue, By Product Type, 2017-2027 ($ Million)

Fig 81 UK RTD beverages Market Packaging Volume, By Product Type, 2017-2027 (Unit Packs Billion)

Fig 82 UK RTD beverages Market Volume, By Pack Size Type, 2017-2027 (Unit Packs Billion)

Fig 83 UK RTD beverages Market Volume, By Pack Material Type, 2017-2027 (Unit Packs Billion)

Fig 84 Germany RTD beverages Market Revenue, By Product Type, 2017-2027 ($ Million)

Fig 85 Germany RTD beverages Market Packaging Volume, By Product Type, 2017-2027 (Unit Packs Billion)

Fig 86 Germany RTD beverages Market Volume, By Pack Size Type, 2017-2027 (Unit Packs Billion)

Fig 87 Germany RTD beverages Market Volume, By Pack Material Type, 2017-2027 (Unit Packs Billion)

Fig 88 Russia RTD beverages Market Revenue, By Product Type, 2017-2027 ($ Million)

Fig 89 Russia RTD beverages Market Packaging Volume, By Product Type, 2017-2027 (Unit Packs Billion)

Fig 90 Russia RTD beverages Market Volume, By Pack Size Type, 2017-2027 (Unit Packs Billion)

Fig 91 Russia RTD beverages Market Volume, By Pack Material Type, 2017-2027 (Unit Packs Billion)

Fig 92 Rest of Europe RTD beverages Market Revenue, By Product Type, 2017-2027 ($ Million)

Fig 93 Rest of Europe RTD beverages Market Packaging Volume, By Product Type, 2017-2027 (Unit Packs Billion)

Fig 94 Rest of Europe RTD beverages Market Volume, By Pack Size Type, 2017-2027 (Unit Packs Billion)

Fig 95 Rest of Europe RTD beverages Market Volume, By Pack Material Type, 2017-2027 (Unit Packs Billion)

Fig 96 South & Central America RTD beverages Market – Revenue Opportunity Forecast, 2017-2027 ($ Billion)

Fig 97 South & Central America RTD beverages Market Revenue, By Country, 2017-2027 ($ Billion)

Fig 98 South & Central America RTD beverages Market Revenue, By Product Type, 2017-2027 ($ Billion)

Fig 99 South & Central America beverages Market – Packaging Volume Forecast, 2017-2027 (Unit Packs Billion)

Fig 100 South & Central America beverages Market Packaging Volume, By Country, 2017-2027 (Unit Packs Billion)

Fig 101 South & Central America beverages Market Packaging Volume, By Product Type, 2017-2027 (Unit Packs Billion)

Fig 102 South & Central America beverages Market Packaging Volume, By Pack Size Type, 2017-2027 (Unit Packs Billion)

Fig 103 South & Central America beverages Market Packaging Volume, By Pack Material Type, 2017-2027 (Unit Packs Billion)

Fig 104 Brazil RTD beverages Market Revenue, By Product Type, 2017-2027 ($ Million)

Fig 105 Brazil RTD beverages Market Packaging Volume, By Product Type, 2017-2027 (Unit Packs Billion)

Fig 106 Brazil RTD beverages Market Volume, By Pack Size Type, 2017-2027 (Unit Packs Billion)

Fig 107 Brazil RTD beverages Market Volume, By Pack Material Type, 2017-2027 (Unit Packs Billion)

Fig 108 Mexico RTD beverages Market Revenue, By Product Type, 2017-2027 ($ Million)

Fig 109 Mexico RTD beverages Market Packaging Volume, By Product Type, 2017-2027 (Unit Packs Billion)

Fig 110 Mexico RTD beverages Market Volume, By Pack Size Type, 2017-2027 (Unit Packs Billion)

Fig 111 Mexico RTD beverages Market Volume, By Pack Material Type, 2017-2027 (Unit Packs Billion)

Fig 112 Colombia RTD beverages Market Revenue, By Product Type, 2017-2027 ($ Million)

Fig 113 Colombia RTD beverages Market Packaging Volume, By Product Type, 2017-2027 (Unit Packs Billion)

Fig 114 Colombia RTD beverages Market Volume, By Pack Size Type, 2017-2027 (Unit Packs Billion)

Fig 115 Colombia RTD beverages Market Volume, By Pack Material Type, 2017-2027 (Unit Packs Billion)

Fig 116 Rest of South & Central America beverages Market Revenue, By Product Type, 2017-2027 ($ Million)

Fig 117 Rest of South & Central America RTD beverages Market Packaging Volume, By Product Type, 2017-2027 (Unit Packs Billion)

Fig 118 Rest of South & Central America RTD beverages Market Volume, By Pack Size Type, 2017-2027 (Unit Packs Billion)

Fig 119 Rest of South & Central America RTD beverages Market Volume, By Pack Material Type, 2017-2027 (Unit Packs Billion)

Fig 120 Middle East & Africa RTD beverages Market – Revenue Opportunity Forecast, 2017-2027 ($ Billion)

Fig 121 Middle East & Africa RTD beverages Market Revenue, By Country, 2017-2027 ($ Billion)

Fig 122 Middle East & Africa beverages Market Revenue, By Product Type, 2017-2027 ($ Billion)

Fig 123 Middle East & Africa beverages Market – Packaging Volume Forecast, 2017-2027 (Unit Packs Billion)

Fig 124 Middle East & Africa beverages Market Packaging Volume, By Country, 2017-2027 (Unit Packs Billion)

Fig 125 Middle East & Africa beverages Market Packaging Volume, By Product Type, 2017-2027 (Unit Packs Billion)

Fig 126 Middle East & Africa beverages Market Packaging Volume, By Pack Size Type, 2017-2027 (Unit Packs Billion)

Fig 127 Middle East & Africa beverages Market Packaging Volume, By Pack Material Type, 2017-2027 (Unit Packs Billion)

Fig 128 South Africa RTD beverages Market Revenue, By Product Type, 2017-2027 ($ Million)

Fig 129 South Africa RTD beverages Market Packaging Volume, By Product Type, 2017-2027 (Unit Packs Billion)

Fig 130 South Africa RTD beverages Market Volume, By Pack Size Type, 2017-2027 (Unit Packs Billion)

Fig 131 South Africa RTD beverages Market Volume, By Pack Material Type, 2017-2027 (Unit Packs Billion)

Fig 132 Nigeria RTD beverages Market Revenue, By Product Type, 2017-2027 ($ Million)

Fig 133 Nigeria RTD beverages Market Packaging Volume, By Product Type, 2017-2027 (Unit Packs Billion)

Fig 134 Nigeria RTD beverages Market Volume, By Pack Size Type, 2017-2027 (Unit Packs Billion)

Fig 135 Nigeria RTD beverages Market Volume, By Pack Material Type, 2017-2027 (Unit Packs Billion)

Fig 136 Ethiopia RTD beverages Market Revenue, By Product Type, 2017-2027 ($ Million)

Fig 137 Ethiopia RTD beverages Market Packaging Volume, By Product Type, 2017-2027 (Unit Packs Billion)

Fig 138 Ethiopia RTD beverages Market Volume, By Pack Size Type, 2017-2027 (Unit Packs Billion)

Fig 139 Ethiopia RTD beverages Market Volume, By Pack Material Type, 2017-2027 (Unit Packs Billion)

Fig 140 Rest Middle East & Africa RTD beverages Market Revenue, By Product Type, 2017-2027 ($ Million)

Fig 141 Rest of Middle East & Africa RTD beverages Market Packaging Volume, By Product Type, 2017-2027 (Unit Packs Billion)

Fig 142 Rest of Middle East & Africa RTD beverages Market Volume, By Pack Size Type, 2017-2027 (Unit Packs Billion)

Fig 143 Rest of Middle East & Africa RTD beverages Market Volume, By Pack Material Type, 2017-2027 (Unit Packs Billion)

Fig 144 Top 10 Global RTD beverages Companies, 2022

Fig 145 Top 10 Global RTD Non-Alcoholic Beverages Companies, 2022

Fig 146 Top 10 Global RTD Alcoholic Beverages Companies, 2022

Fig 147 Top 10 RTD beverages Companies in Asia Pacific, 2022

Fig 148 Top 10 RTD beverages Companies in North America, 2022

Fig 149 Top 10 RTD beverages Companies in Europe, 2022

Fig 150 Top 10 RTD beverages Companies in Middle East & Africa, 2022

Fig 151 Top 10 RTD beverages Companies in South & Central America, 2022

Frequently asked questions

Currency USD
$3,950

Can be used by individual purchaser only

$7,950

Can be shared globally by unlimited users within the purchasing corporation e.g. all employees of a single company


Undecided about purchasing this report?

Enquire Before Buying Request a Free Sample

Get in touch to find out about multi-purchase discounts

reportstore@globaldata.com
Tel +44 20 7947 2745

Every customer’s requirement is unique. With over 220,000 construction projects tracked, we can create a tailored dataset for you based on the types of projects you are looking for. Please get in touch with your specific requirements and we can send you a quote.

Sample Report

We are confident about Ready-to-Drink (RTD) Beverages Market Size, Share, Trends and Analysis by Region, Product, Pack Size, Material and Segment Forecast to 2028 report's unique quality. However, we want you to make the most beneficial decision for your business, so we offer free sample pages to help you:

  • Assess the relevance of the report
  • Evaluate the quality of the report
  • Justify the cost

Download your copy of the sample report and make an informed decision about whether the full report will provide you with the insights and information you need.

Below is a sample report to understand what you are buying

See what our customers are saying

“The GlobalData platform is our go-to tool for intelligence services. GlobalData provides an easy way to access comprehensive intelligence data around multiple sectors, which essentially makes it a one-for-all intelligence platform, for tendering and approaching customers.

GlobalData is very customer orientated, with a high degree of personalised services, which benefits everyday use. The highly detailed project intelligence and forecast reports can be utilised across multiple departments and workflow scopes, from operational to strategic level, and often support strategic decisions. GlobalData Analytics and visualisation solutions has contributed positively when preparing management presentations and strategic papers.”

Business Intelligence & Marketing Manager, SAL Heavy Lift

“COVID-19 has caused significant interference to our business and the COVID-19 intelligence from GlobalData has helped us reach better decisions around strategy. These two highlights have helped enormously to understand the projections into the future concerning our business units, we also utilise the project database to source new projects for Liebherr-Werk to use as an additional source to pitch for new business.”

Market Analyst & Management, Liebherr-Werk

Your daily news has saved me a lot of time and keeps me up-to-date with what is happening in the market, I like that you almost always have a link to the source origin. We also use your market data in our Strategic Business Process to support our business decisions. By having everything in one place on the Intelligence Center it has saved me a lot of time versus looking on different sources, the alert function also helps with this.

Head of Key Accounts, Saab AB

Having used several other market research companies, I find that GlobalData manages to provide that ‘difficult-to-get’ market data that others can’t, as well as very diverse and complete consumer surveys.

Marketing Intelligence Manager, Portugal Foods

Our experience with GlobalData has been very good, from the platform itself to the people. I find that the analysts and the account team have a high level of customer focus and responsiveness and therefore I can always rely on. The platform is more holistic than other providers. It is convenient and almost like a one stop shop. The pricing suite is highly competitive and value for our organisation.

I like reports that inform new segments such as the analysis on generation Z, millennials, the impact of COVID 19 to our banking customers and their new channel habits. Secondly the specialist insight on affluent sector significantly increases our understanding about this group of customers. The combination of those give us depth and breadth of the evolving market.

I’m in the business of answering and helping people make decisions so with the intelligence center I can do that, effectively and efficiently. I can share quickly key insights that answer and satisfy our country stakeholders by giving them many quality studies and primary research about competitive landscape beyond the outlook of our bank. It helps me be seen as an advisory partner and that makes a big difference. A big benefit of our subscription is that no one holds the whole data and because it allows so many people, so many different parts of our organisation have access, it enables all teams to have the same level of knowledge and decision support.

Head of Customer Insight and Research, Standard Chartered

“I know that I can always rely on Globaldata’s work when I’m searching for the right consumer and market insights. I use Globaldata insights to understand the changing market & consumer landscape and help create better taste & wellbeing solutions for our customers in food, beverage and healthcare industries.

Globaldata has the right data and the reports are of very high quality compared to your competitors. Globaldata not only has overall market sizes & consumer insights on food & beverages but also provides insights at the ingredient & flavour level. That is key for B2B companies like Givaudan. This way we understand our customers’ business and also gain insight to our unique industry”

Head of Consumer Sensory Insights, Givaudan

GlobalData provides a great range of information and reports on various sectors that is highly relevant, timely, easy to access and utilise.  The reports and data dashboards help engagement with clients; they provide valuable industry and market insights that can enrich client conversations and can help in the shaping of value propositions. Moreover, using GlobalData products has helped increase my knowledge of the finance sector, the players within it, and the general threats and opportunities.

I find the consumer surveys that are carried out to be extremely beneficial and not something I have seen anywhere else. They provided an insightful view of why and which consumers take (or don’t) particular financial products. This can help shape conversations with clients to ensure they make the right strategic decisions for their business.

One of the challenges I have found is that data in the payments space is often piecemeal. With GD all of the data I need is in one place, but it also comes with additional market reports that provide useful extra context and information. Having the ability to set-up alerts on relevant movements in the industry, be it competitors or customers, and have them emailed directly to me, ensures I get early sight of industry activity and don’t have to search for news.

Senior Account Manager, TSYS
Go even deeper with GlobalData Intelligence Center

Every Company Report we produce is powered by the GlobalData Intelligence Center.

Subscribing to our intelligence platform means you can monitor developments at Ready-to-Drink (RTD) Beverages Market Size, Share, Trends and Analysis by Region, Product, Pack Size, Material and Segment Forecast to 2028 in real time.

  • Access a live Ready-to-Drink (RTD) Beverages Market Size, Share, Trends and Analysis by Region, Product, Pack Size, Material and Segment Forecast to 2028 dashboard for 12 months, with up-to-the-minute insights.
  • Fuel your decision making with real-time deal coverage and media activity.
  • Turn insights on financials, deals, products and pipelines into powerful agents of commercial advantage.