Automotive Autonomous Driving Systems Market Trends, Sector Overview and Forecast to 2028

Powered by

All the vital news, analysis, and commentary curated by our industry experts.

The size of the global autonomous driving systems market was 212.5 mn units in 2023, recording a substantial annual growth of 15.2%. During 2018–23, the sector posted a CAGR of 5.1%. Over the forecast period, the sector is expected to record a CAGR of 5.2% to reach 274.2 mn units by 2028. In 2023 adaptive cruise control (ACC) garnered a share of 14.0%, radar -–long range garnered a share of 16.3%, radar-short/medium garnered a share of 27.7%, and GPS/GNSS unit garnered a share of 23.3%. In 2028, Adaptive Cruise Control (ACC) is expected to record a share of 14.4%, radar–long range is expected to record a share of 15.9%, radar-short/medium is expected to record a share of 23.9%, and GPS/GNSS unit is expected to record a share of 22.3%.

This report brings together multiple data sources to provide a comprehensive overview of the global ADAS and Autonomous Vehicles sector. It includes analysis on the following –

Trends & Drivers: Provides an overview of current sector scenario regarding the future outlook in terms of key trends and drivers of the sector.

Technological Developments: Provides a detailed overview of technological developments and innovations in the sector.

PESTER Analysis: Provides a detailed understanding of various factors such as political, economic, social, technological, environmental, and regulatory impacting the sector.

Sector Forecast: Provides deep-dive analysis of global market covering volume growth during 2018–2028, and spot estimates for 2023 and 2028. The analysis also covers regional overview across four regions-Asia-Pacific, Europe, North America, and South America and MEA-highlighting sector size, and growth drivers for the region.

Competitive Landscape: Provides an overview of leading component suppliers at a global and regional level, besides analyzing the recent product innovations and key strategic initiatives taken by the companies.

Patent Analysis: Provides an overview of patent filings in the sector across regions, countries and top applicants.

Automotive ADAS and Autonomous Vehicles Market Trends

The development of artificial chips​ is one of the key trends shaping the automotive advanced driver assistance systems and autonomous vehicles market. The adoption of legislation to facilitate autonomous vehicle development and deployment also helps in the market growth​.

Adoption of legislation: Vehicle-to-infrastructure (V2I) and vehicle-to-vehicle (V2V) communication serve as some of the foundational elements for the development of autonomous vehicles.​ Since 2009, the US, EU, and Japan have formed working groups to assist in developing the standards for V2I and V2V communication.

Buy the Full Report for More Trend Insights into the Automotive ADAS and Autonomous Vehicles Market

Download a Free Report Sample

Automotive ADAS and Autonomous Vehicles Market Segmentation by Regions

In 2023, Asia-Pacific accounted for the highest share among all the regions

The key regions in the automotive ADAS and autonomous vehicles market are Asia-Pacific, Europe, North America, South America, and MEA. The Japanese government collaborated with regional automakers, suppliers, and research centers from the Universities of Tokyo and Nagoya to permit autonomous vehicle testing on roads.

Automotive ADAS and Autonomous Vehicles Market Analysis by Regions, 2023 (%)

Automotive ADAS and Autonomous Vehicles Market Analysis by Regions, 2023 (%)

Buy the Full Report for More Regional Insights into the Automotive ADAS and Autonomous Vehicles Market

Download a Free Report Sample

Automotive ADAS and Autonomous Vehicles Market - Competitive Landscape

 A few of the top companies operating in the market are:

  • Audi
  • BMW
  • Honda
  • Mercedez-Benz
  • ZF

In BMW, sensor technology in the assistance systems measures, assesses, and detects changes in the car’s immediate and surrounding environments. Currently, these sensors are used in traffic sign recognition, emergency braking assistance, dynamic stability control (DSC), and for other purposes.

BMW is also taking strategic actions to aid the growth of the automotive ADAS and autonomous vehicles market. In August 2023, BMW and Innoviz developed highly automated LiDAR imaging technology which will be incorporated into the BMW 7 Series in the future.

Automotive ADAS and Autonomous Vehicles Market Analysis by Companies

Automotive ADAS and Autonomous Vehicles Market Analysis by Companies

Buy the Full Report to Know More about Major Developments and Strategic Actions of Automotive ADAS and Autonomous Vehicles Market Companies

Download a Free Report Sample

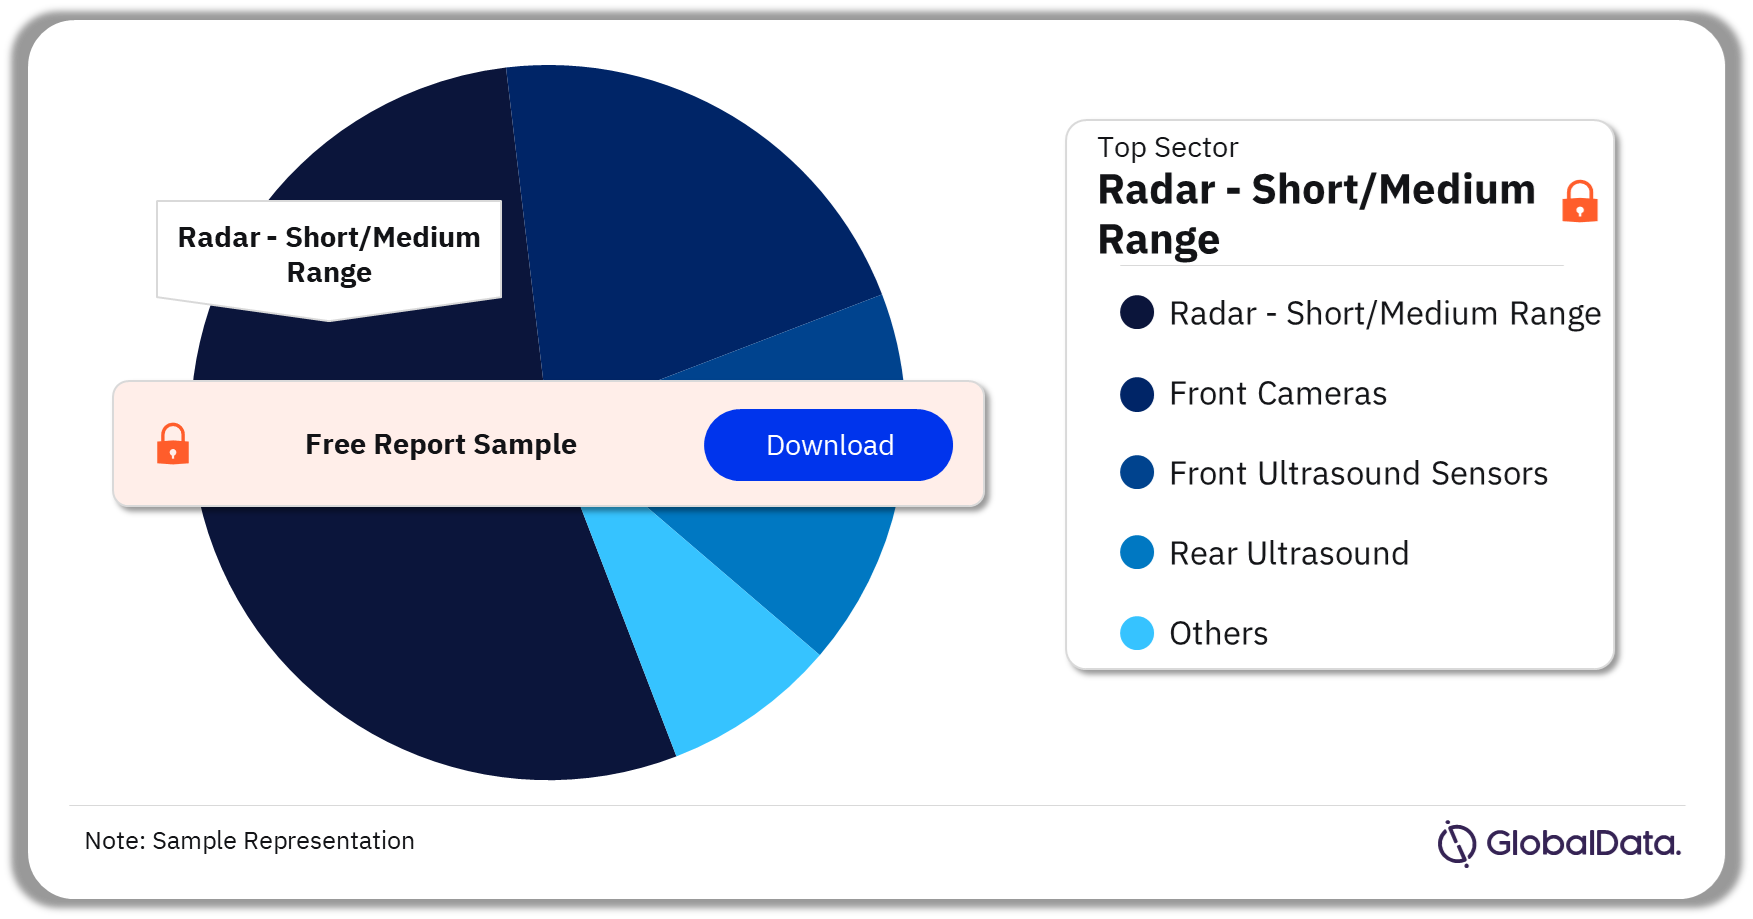
Automotive ADAS and Autonomous Vehicles Market Segmentation by Sectors

The key sectors in the automotive ADAS and autonomous vehicles market are front cameras, front ultrasound sensors, radar – short/medium range, and rear ultrasound. In 2023, radar – short/medium range was the dominant sector in the market.

Automotive ADAS and Autonomous Vehicles Market Analysis by Sectors, 2023 (%)

Automotive ADAS and Autonomous Vehicles Market Analysis by Sectors, 2023 (%)

Buy the Full Report for More Sector Insights into the Automotive ADAS and Autonomous Vehicles Market

Download a Free Report Sample

Automotive ADAS and Autonomous Vehicles Market - Latest Developments

A few of the latest developments in the automotive ADAS and autonomous vehicles market are as follows:

  • 5th September 2023: Mobileye and Valeo collaborated to supply imaging radars for automated driving and next-generation driver assistance capabilities. They announced this collaboration at the IAA Mobility in Munich.
  • 4th September 2023: Samsung Electro-Mechanics Co. entered into an agreement with a US electric car manufacturer for the supply of camera modules for automobiles. People assume the US electric car manufacturer to be Tesla.

Buy the Full Report to Know More about the Latest Developments in the Automotive ADAS and Autonomous Vehicles Market

Download a Free Report Sample

Segments Covered in the Report

Automotive ADAS and Autonomous Vehicles Sector Outlook (Value, Million Units, 2018-2028)

  • Front Cameras
  • Front Ultrasound Sensors
  • Radar – Short/Medium Range
  • Rear Ultrasound

Automotive ADAS and Autonomous Vehicles Regional Outlook (Value, Million Units, 2018-2028)

  • Asia-Pacific
  • Europe
  • North America
  • South America
  • MEA

Scope

This report brings together multiple data sources to provide a comprehensive overview of the global autonomous driving systems sector. It includes an analysis of the following: ​

Trends & Drivers: Provides an overview of the current sector scenario regarding the future outlook in terms of key trends and drivers of the sector. ​

Technological Developments: Provides a detailed overview of technological developments and innovations in the sector.​

PESTER Analysis: Provides a detailed understanding of various factors such as political, economic, social, technological, environmental, and regulatory impacting the sector.​

Sector Forecast: Provides deep-dive analysis of the global market covering volume growth during 2018–2028, and spot estimates for 2030 and 2036. The analysis also covers a regional overview across four regions-Asia-Pacific, Europe, MEA, North America, and South America -highlighting sector size, and growth drivers for the region.​

Competitive Landscape: Provides an overview of leading component suppliers at a global and regional level, besides analyzing the recent product innovations and key strategic initiatives taken by the companies.​

Patent Analysis: Provides an overview of patent filings in the sector across regions, countries, and top applicants.​

Reasons to Buy

Auto OEMs and component suppliers seek the latest information on how the market is evolving to formulate their sales and marketing strategies. There is also a demand for authentic market data with a high level of detail. This report has been created to provide its readers with up-to-date information and analysis to uncover emerging opportunities for growth within the sector in the region. The report provides a detailed analysis of the regions and competitive landscape that can help companies gain insight into the region-specific nuances. The analysts have also placed a significant emphasis on the key trends that drive customer choice and the future opportunities that can be explored in the region, which can help companies in revenue expansion. To gain competitive intelligence about leading component suppliers in the sector in the region with information about their market share and growth rates.

Audi
BMW
Bosch
ZF
Magna

Table of Contents

Executive Summary

Part 1: Main Trends and Drivers

Trends

Drivers

Part 2: Technologies and Developments

Part 3: PESTER Analysis

Part 4: Sector Forecast

Autonomous Driving Systems – Global Volumes

Asia-Pacific Market Growth Analysis

European Market Growth Analysis

North American Market Growth Analysis

South America Market Growth Analysis

MEA Market Growth Analysis

Part 5: Latest Developments

Part 6: Key Companies

Part 7: Patent Analysis

Part 8: Appendix

Table

List of Tables

Table 1: Main trends in the Autonomous Vehicles sector

Table 2: Global market volumes of autonomous light vehicles by SAE definition, 2016-2036, (‘000s units)

Table 3: Global penetration rates of autonomous light vehicles by SAE definition, 2016-2036, (%)

Table 4: North American penetration rates of autonomous light vehicles by SAE definition, 2016-2036, (%)

Table 5: Mercosur penetration rates of autonomous light vehicles by SAE definition, 2016-2036, (%)

Table 6: West European penetration rates of autonomous light vehicles by SAE definition, 2016-2036, (%)

Table 7: Central European penetration rates of autonomous light vehicles by SAE definition, 2016-2036, (%)

Table 8: Russian penetration rates of autonomous light vehicles by SAE definition, 2016-2036, (%)

Table 9: Japanese penetration rates of autonomous light vehicles by SAE definition, 2016-2036, (%)

Table 10: Chinese penetration rates of autonomous light vehicles by SAE definition, 2016-2036, (%)

Table 11: Indian penetration rates of autonomous light vehicles by SAE definition, 2016-2036, (%)

Table 12: Korean penetration rates of autonomous light vehicles by SAE definition, 2016-2036, (%)

Table 13: Thai penetration rates of autonomous light vehicles by SAE definition, 2016-2036, (%)

Table 14: Other Asia penetration rates of autonomous light vehicles by SAE definition, 2016-2036, (%)

Table 15: Iranian penetration rates of autonomous light vehicles by SAE definition, 2016-2036, (%)

Table 16: South African penetration rates of autonomous light vehicles by SAE definition, 2016-2036, (%)

Table 17: Australian penetration rates of autonomous light vehicles by SAE definition, 2016-2036, (%)

Table 18: North American market volumes of autonomous light vehicles by SAE definition, 2016-2036, (‘000s units)

Table 19: Mercosur market volumes of autonomous light vehicles by SAE definition, 2016-2036, (‘000s units)

Table 20: West European market volumes of autonomous light vehicles by SAE definition, 2016-2036, (‘000s units)

Table 21: Central European market volumes of autonomous light vehicles by SAE definition, 2016-2036, (‘000s units)

Table 22: Russan market volumes of autonomous light vehicles by SAE definition, 2016-2036, (‘000s units)

Table 23: Japanese market volumes of autonomous light vehicles by SAE definition, 2016-2036, (‘000s units)

Table 24: Chinese market volumes of autonomous light vehicles by SAE definition, 2016-2036, (‘000s units)

Table 25: Indian market volumes of autonomous light vehicles by SAE definition, 2016-2036, (‘000s units)

Table 26: Korean market volumes of autonomous light vehicles by SAE definition, 2016-2036, (‘000s units)

Table 27: Thai market volumes of autonomous light vehicles by SAE definition, 2016-2036, (‘000s units)

Table 28: Other Asia market volumes of autonomous light vehicles by SAE definition, 2016-2036, (‘000s units)

Table 29: Iranian market volumes of autonomous light vehicles by SAE definition, 2016-2036, (‘000s units)

Table 30: South African market volumes of autonomous light vehicles by SAE definition, 2016-2036, (‘000s units)

Table 31: Australian market volumes of autonomous light vehicles by SAE definition, 2016-2036, (‘000s units)

Table 32: Market volumes of Level 3 autonomous light vehicles by sensor type, 2016-2036, (‘000s units)

Table 33: Market volumes of Level 4 autonomous light vehicles by sensor type, 2016-2036, (‘000s units)

Table 34: Market volumes of Level 5 autonomous light vehicles by sensor type, 2016-2036, (‘000s units)

Table 35: Market volumes of Level 3-5 autonomous light vehicles by sensor type, 2016-2036, (‘000s units)

Table 36: Market fitment of Level 3-5 autonomous light vehicles by sensor type, 2016-2036, (per cent)

Figures

List of Tables

Table 1: Main trends in the Autonomous Vehicles sector

Table 2: Global market volumes of autonomous light vehicles by SAE definition, 2016-2036, (‘000s units)

Table 3: Global penetration rates of autonomous light vehicles by SAE definition, 2016-2036, (%)

Table 4: North American penetration rates of autonomous light vehicles by SAE definition, 2016-2036, (%)

Table 5: Mercosur penetration rates of autonomous light vehicles by SAE definition, 2016-2036, (%)

Table 6: West European penetration rates of autonomous light vehicles by SAE definition, 2016-2036, (%)

Table 7: Central European penetration rates of autonomous light vehicles by SAE definition, 2016-2036, (%)

Table 8: Russian penetration rates of autonomous light vehicles by SAE definition, 2016-2036, (%)

Table 9: Japanese penetration rates of autonomous light vehicles by SAE definition, 2016-2036, (%)

Table 10: Chinese penetration rates of autonomous light vehicles by SAE definition, 2016-2036, (%)

Table 11: Indian penetration rates of autonomous light vehicles by SAE definition, 2016-2036, (%)

Table 12: Korean penetration rates of autonomous light vehicles by SAE definition, 2016-2036, (%)

Table 13: Thai penetration rates of autonomous light vehicles by SAE definition, 2016-2036, (%)

Table 14: Other Asia penetration rates of autonomous light vehicles by SAE definition, 2016-2036, (%)

Table 15: Iranian penetration rates of autonomous light vehicles by SAE definition, 2016-2036, (%)

Table 16: South African penetration rates of autonomous light vehicles by SAE definition, 2016-2036, (%)

Table 17: Australian penetration rates of autonomous light vehicles by SAE definition, 2016-2036, (%)

Table 18: North American market volumes of autonomous light vehicles by SAE definition, 2016-2036, (‘000s units)

Table 19: Mercosur market volumes of autonomous light vehicles by SAE definition, 2016-2036, (‘000s units)

Table 20: West European market volumes of autonomous light vehicles by SAE definition, 2016-2036, (‘000s units)

Table 21: Central European market volumes of autonomous light vehicles by SAE definition, 2016-2036, (‘000s units)

Table 22: Russan market volumes of autonomous light vehicles by SAE definition, 2016-2036, (‘000s units)

Table 23: Japanese market volumes of autonomous light vehicles by SAE definition, 2016-2036, (‘000s units)

Table 24: Chinese market volumes of autonomous light vehicles by SAE definition, 2016-2036, (‘000s units)

Table 25: Indian market volumes of autonomous light vehicles by SAE definition, 2016-2036, (‘000s units)

Table 26: Korean market volumes of autonomous light vehicles by SAE definition, 2016-2036, (‘000s units)

Table 27: Thai market volumes of autonomous light vehicles by SAE definition, 2016-2036, (‘000s units)

Table 28: Other Asia market volumes of autonomous light vehicles by SAE definition, 2016-2036, (‘000s units)

Table 29: Iranian market volumes of autonomous light vehicles by SAE definition, 2016-2036, (‘000s units)

Table 30: South African market volumes of autonomous light vehicles by SAE definition, 2016-2036, (‘000s units)

Table 31: Australian market volumes of autonomous light vehicles by SAE definition, 2016-2036, (‘000s units)

Table 32: Market volumes of Level 3 autonomous light vehicles by sensor type, 2016-2036, (‘000s units)

Table 33: Market volumes of Level 4 autonomous light vehicles by sensor type, 2016-2036, (‘000s units)

Table 34: Market volumes of Level 5 autonomous light vehicles by sensor type, 2016-2036, (‘000s units)

Table 35: Market volumes of Level 3-5 autonomous light vehicles by sensor type, 2016-2036, (‘000s units)

Table 36: Market fitment of Level 3-5 autonomous light vehicles by sensor type, 2016-2036, (per cent)

Frequently asked questions

Automotive Autonomous Driving Systems Market Trends, Sector Overview and Forecast to 2028 standard reports
Currency USD
$995

Can be used by individual purchaser only

$1,990

Can be shared globally by unlimited users within the purchasing corporation e.g. all employees of a single company


Undecided about purchasing this report?

Enquire Before Buying Request a Free Sample

Get in touch to find out about multi-purchase discounts

reportstore@globaldata.com
Tel +44 20 7947 2745

Every customer’s requirement is unique. With over 220,000 construction projects tracked, we can create a tailored dataset for you based on the types of projects you are looking for. Please get in touch with your specific requirements and we can send you a quote.

Sample Report

Automotive Autonomous Driving Systems Market Trends, Sector Overview and Forecast to 2028 was curated by the best experts in the industry and we are confident about its unique quality. However, we want you to make the most beneficial decision for your business, so we offer free sample pages to help you:

  • Assess the relevance of the report
  • Evaluate the quality of the report
  • Justify the cost

Download your copy of the sample report and make an informed decision about whether the full report will provide you with the insights and information you need.

Below is a sample report to understand what you are buying

See what our customers are saying

“The GlobalData platform is our go-to tool for intelligence services. GlobalData provides an easy way to access comprehensive intelligence data around multiple sectors, which essentially makes it a one-for-all intelligence platform, for tendering and approaching customers.

GlobalData is very customer orientated, with a high degree of personalised services, which benefits everyday use. The highly detailed project intelligence and forecast reports can be utilised across multiple departments and workflow scopes, from operational to strategic level, and often support strategic decisions. GlobalData Analytics and visualisation solutions has contributed positively when preparing management presentations and strategic papers.”

Business Intelligence & Marketing Manager, SAL Heavy Lift

“COVID-19 has caused significant interference to our business and the COVID-19 intelligence from GlobalData has helped us reach better decisions around strategy. These two highlights have helped enormously to understand the projections into the future concerning our business units, we also utilise the project database to source new projects for Liebherr-Werk to use as an additional source to pitch for new business.”

Market Analyst & Management, Liebherr-Werk

Your daily news has saved me a lot of time and keeps me up-to-date with what is happening in the market, I like that you almost always have a link to the source origin. We also use your market data in our Strategic Business Process to support our business decisions. By having everything in one place on the Intelligence Center it has saved me a lot of time versus looking on different sources, the alert function also helps with this.

Head of Key Accounts, Saab AB

Having used several other market research companies, I find that GlobalData manages to provide that ‘difficult-to-get’ market data that others can’t, as well as very diverse and complete consumer surveys.

Marketing Intelligence Manager, Portugal Foods

Our experience with GlobalData has been very good, from the platform itself to the people. I find that the analysts and the account team have a high level of customer focus and responsiveness and therefore I can always rely on. The platform is more holistic than other providers. It is convenient and almost like a one stop shop. The pricing suite is highly competitive and value for our organisation.

I like reports that inform new segments such as the analysis on generation Z, millennials, the impact of COVID 19 to our banking customers and their new channel habits. Secondly the specialist insight on affluent sector significantly increases our understanding about this group of customers. The combination of those give us depth and breadth of the evolving market.

I’m in the business of answering and helping people make decisions so with the intelligence center I can do that, effectively and efficiently. I can share quickly key insights that answer and satisfy our country stakeholders by giving them many quality studies and primary research about competitive landscape beyond the outlook of our bank. It helps me be seen as an advisory partner and that makes a big difference. A big benefit of our subscription is that no one holds the whole data and because it allows so many people, so many different parts of our organisation have access, it enables all teams to have the same level of knowledge and decision support.

Head of Customer Insight and Research, Standard Chartered

“I know that I can always rely on Globaldata’s work when I’m searching for the right consumer and market insights. I use Globaldata insights to understand the changing market & consumer landscape and help create better taste & wellbeing solutions for our customers in food, beverage and healthcare industries.

Globaldata has the right data and the reports are of very high quality compared to your competitors. Globaldata not only has overall market sizes & consumer insights on food & beverages but also provides insights at the ingredient & flavour level. That is key for B2B companies like Givaudan. This way we understand our customers’ business and also gain insight to our unique industry”

Head of Consumer Sensory Insights, Givaudan

GlobalData provides a great range of information and reports on various sectors that is highly relevant, timely, easy to access and utilise.  The reports and data dashboards help engagement with clients; they provide valuable industry and market insights that can enrich client conversations and can help in the shaping of value propositions. Moreover, using GlobalData products has helped increase my knowledge of the finance sector, the players within it, and the general threats and opportunities.

I find the consumer surveys that are carried out to be extremely beneficial and not something I have seen anywhere else. They provided an insightful view of why and which consumers take (or don’t) particular financial products. This can help shape conversations with clients to ensure they make the right strategic decisions for their business.

One of the challenges I have found is that data in the payments space is often piecemeal. With GD all of the data I need is in one place, but it also comes with additional market reports that provide useful extra context and information. Having the ability to set-up alerts on relevant movements in the industry, be it competitors or customers, and have them emailed directly to me, ensures I get early sight of industry activity and don’t have to search for news.

Senior Account Manager, TSYS
Go even deeper with GlobalData Intelligence Center

Every Company Report we produce is powered by the GlobalData Intelligence Center.

Subscribing to our intelligence platform means you can monitor developments at Automotive Autonomous Driving Systems Market Trends, Sector Overview and Forecast to 2028 in real time.

  • Access a live Automotive Autonomous Driving Systems Market Trends, Sector Overview and Forecast to 2028 dashboard for 12 months, with up-to-the-minute insights.
  • Fuel your decision making with real-time deal coverage and media activity.
  • Turn insights on financials, deals, products and pipelines into powerful agents of commercial advantage.