BRIC Countries (Brazil, Russia, India, China) Car Manufacturing Market Summary, Competitive Analysis and Forecast, 2017-2026

Powered by

All the vital news, analysis, and commentary curated by our industry experts.

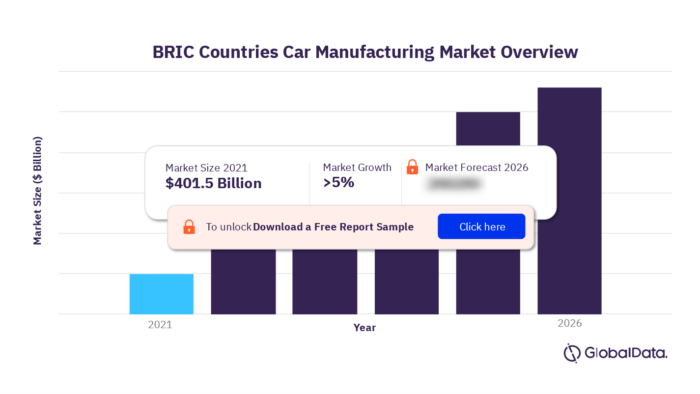
The BRIC countries, which include Brazil, Russia, India, and China, contributed $401.5 billion to the global car manufacturing industry in 2021 and are expected to accelerate at a CAGR of more than 5% over the 2021-26 period. The BRIC countries (Brazil, Russia, India, and China) car manufacturing market research report provides top-line qualitative and quantitative summary information including market share, industry size (value and volume 2017-21, and forecast to 2026). The profile also contains descriptions of the leading players including key financial metrics and an analysis of competitive pressures within the industry.

BRIC Countries (Brazil, Russia, India, China) Car Manufacturing Market Summary

For more insights, download a free report sample

BRIC Countries Car Manufacturing Market Outlook

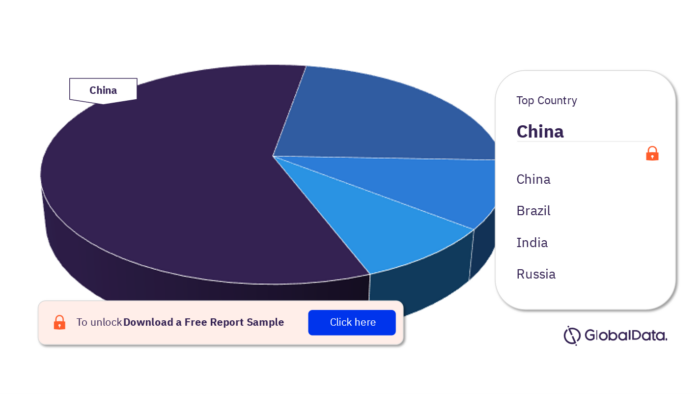
The BRIC countries include Brazil, Russia, India, and China. China led the BRIC car manufacturing industry in terms of revenue in 2021.

Brazil

The Brazilian car manufacturing industry has fluctuated between growth and decline in recent years, with the steepest decline being seen in 2020 amid the COVID-19 pandemic. 2021 saw a surge in the industry value, with manufacturing output also registering a healthy increase. The forecast period looks promising in both value and volume terms.

The Brazilian car manufacturing industry is expected to follow a strong growth trajectory over the forecast period. Pent-up demand is expected to drive growth, while the improving macroeconomic environment brought about by the end of the pandemic should support spending over the coming years. 

China

Growth in this industry has been hindered by environmental concerns in China. High pollution levels in the major urban cities have led the government to encourage consumers to revert to non-fossil fuel-burning substitutes such as bicycles. This return to bicycles has been boosted by the emergence of bike-sharing start-ups such as Ofo, Bluegogo, and Mobike, which now operate millions of bicycles across the country. On top of this, many of the younger consumers in the Chinese industry increasingly see bicycles as trendy, much like their counterparts do in Amsterdam or Copenhagen. 

India

The Indian car manufacturing industry has fluctuated between growth and decline in value and volume terms in recent years. The industry suffered a particularly steep decline in 2020 amid the COVID-19 pandemic. 2021 saw a considerable recovery in the industry in both value and volume terms. The industry is set to follow a strong growth trajectory over the forecast period given that the macroeconomic environment will continue to improve. 

Russia

The Russian car manufacturing industry had been growing at a good rate in value terms before 2020. However, the industry declined in both value and volume terms in 2020 amid the COVID-19 pandemic. While forecasts suggest the industry could follow a positive growth trajectory in the coming years, Russia’s invasion of Ukraine has the potential to significantly disrupt the industry.

BRIC Countries Car Manufacturing Market, by Regions

BRIC Countries Car Manufacturing Market, by Regions

For more regional insights, download a free report sample

Key Companies in the BRIC Countries Car Manufacturing Market

There are many companies in the BRIC in car manufacturing such as Stellantis NV, Volkswagen AG, Renault SA, Toyota Motor Corporation, General Motors Company, Zhejiang Geely Holding Group Co Ltd, Suzuki Motor Corporation, Tata Motors Limited, and Hyundai Motor Company.

Stellantis NV                          

Stellantis NV (Stellantis), formerly Fiat Chrysler Automobiles NV, is an automotive company, formed because of a merger with PSA Group. Stellantis is headquartered in Amsterdam, Netherlands.

Volkswagen AG

Volkswagen AG (Volkswagen or ‘the group’) is an automobile manufacturer and car manufacturer in Europe. The company is headquartered in Wolfsburg, Germany. 

Toyota Motor Corporation

Toyota Motor Corporation (Toyota or the company) is a manufacturer and seller of motor vehicles. The company is headquartered in Toyota City, Aichi, Japan. 

General Motors Company

General Motors Company (GM or the company) is engaged in the design, development, production, and marketing of cars, trucks, and automobile parts. The company is headquartered in Detroit, Michigan, US.

Market Report Overview

Key Countries Brazil, Russia, India, and China
Market Size 2021 $401.5 billion
CAGR % (2021-2026) >5%
Key Companies Stellantis NV, Volkswagen AG, Renault SA, Toyota Motor Corporation, General Motors Company, Zhejiang Geely Holding Group Co Ltd, Suzuki Motor Corporation, Tata Motors Limited, and Hyundai Motor Company

Scope

  • Save time carrying out entry-level research by identifying the size, growth, and leading players in the BRIC car manufacturing industry
  • Use the Five Forces analysis to determine the competitive intensity and therefore attractiveness of the BRIC car manufacturing industry
  • Leading company profiles reveal details of key car manufacturing industry players’ BRIC operations and financial performance
  • Add weight to presentations and pitches by understanding the future growth prospects of the BRIC car manufacturing industry with five year forecasts by both value and volume
  • Compares data from Brazil, Russia, India, and China, alongside individual chapters on each country

Reasons to Buy

  • The size of the BRIC car manufacturing industry by value in 2021
  • The size of the BRIC car manufacturing industry in 2026
  • Factors are affecting the strength of competition in the BRIC car manufacturing industry
  • The industry performance over the last five years
  • The top competitors in the BRIC car manufacturing industry

Stellantis NV
Volkswagen AG
Renault SA
Toyota Motor Corporation
General Motors Company
Zhejiang Geely Holding Group Co Ltd
Suzuki Motor Corporation
Tata Motors Limited
Hyundai Motor Company

Table of Contents

Table of Contents

1 Introduction

1.1. What is this report about?

1.2. Who is the target reader?

1.3. How to use this report

1.4. Definitions

2 BRIC Car Manufacturing

2.1. Industry Outlook

3 Car Manufacturing in Brazil

3.1. Market Overview

3.2. Market Data

3.3. Market Segmentation

3.4. Market outlook

3.5. Five forces analysis

4 Macroeconomic Indicators

4.1. Country data

5 Car Manufacturing in China

5.1. Market Overview

5.2. Market Data

5.3. Market Segmentation

5.4. Market outlook

5.5. Five forces analysis

6 Macroeconomic Indicators

6.1. Country data

7 Car Manufacturing in India

7.1. Market Overview

7.2. Market Data

7.3. Market Segmentation

7.4. Market outlook

7.5. Five forces analysis

8 Macroeconomic Indicators

8.1. Country data

9 Car Manufacturing in Russia

9.1. Market Overview

9.2. Market Data

9.3. Market Segmentation

9.4. Market outlook

9.5. Five forces analysis

10 Macroeconomic Indicators

10.1. Country data

11 Company Profiles

11.1. Stellantis NV

11.2. Volkswagen AG

11.3. Renault SA

11.4. Toyota Motor Corporation

11.5. General Motors Company

11.6. Zhejiang Geely Holding Group Co Ltd

11.7. Suzuki Motor Corporation

11.8. Tata Motors Limited

11.9. Hyundai Motor Company

12 Appendix

12.1. Methodology

12.2. About GlobalData

Table

List of Tables

Table 1: BRIC car manufacturing industry, revenue($bn), 2017-26

Table 2: BRIC car manufacturing industry, revenue($bn), 2017-21

Table 3: BRIC car manufacturing industry, revenue($bn), 2021-26

Table 4: Brazil car manufacturing industry value: $ billion, 2017–21

Table 5: Brazil car manufacturing industry volume: thousand units, 2017–21

Table 6: Brazil car manufacturing industry geography segmentation: $ billion, 2021

Table 7: Brazil car manufacturing industry share: % share, by volume, 2021

Table 8: Brazil car manufacturing industry value forecast: $ billion, 2021–26

Table 9: Brazil car manufacturing industry volume forecast: thousand units, 2021–26

Table 10: Brazil size of population (million), 2017–21

Table 11: Brazil gdp (constant 2005 prices, $ billion), 2017–21

Table 12: Brazil gdp (current prices, $ billion), 2017–21

Table 13: Brazil inflation, 2017–21

Table 14: Brazil consumer price index (absolute), 2017–21

Table 15: Brazil exchange rate, 2017–21

Table 16: China car manufacturing industry value: $ billion, 2017–21

Table 17: China car manufacturing industry volume: thousand units, 2017–21

Table 18: China car manufacturing industry geography segmentation: $ billion, 2021

Table 19: China car manufacturing industry share: % share, by volume, 2021

Table 20: China car manufacturing industry value forecast: $ billion, 2021–26

Table 21: China car manufacturing industry volume forecast: thousand units, 2021–26

Table 22: China size of population (million), 2017–21

Table 23: China gdp (constant 2005 prices, $ billion), 2017–21

Table 24: China gdp (current prices, $ billion), 2017–21

Table 25: China inflation, 2017–21

Table 26: China consumer price index (absolute), 2017–21

Table 27: China exchange rate, 2017–21

Table 28: India car manufacturing industry value: $ billion, 2017–21

Table 29: India car manufacturing industry volume: thousand units, 2017–21

Table 30: India car manufacturing industry geography segmentation: $ billion, 2021

Table 31: India car manufacturing industry share: % share, by volume, 2021

Table 32: India car manufacturing industry value forecast: $ billion, 2021–26

Table 33: India car manufacturing industry volume forecast: thousand units, 2021–26

Table 34: India size of population (million), 2017–21

Table 35: India gdp (constant 2005 prices, $ billion), 2017–21

Table 36: India gdp (current prices, $ billion), 2017–21

Table 37: India inflation, 2017–21

Table 38: India consumer price index (absolute), 2017–21

Table 39: India exchange rate, 2017–21

Table 40: Russia car manufacturing industry value: $ billion, 2017–21

Table 41: Russia car manufacturing industry volume: thousand units, 2017–21

Table 42: Russia car manufacturing industry geography segmentation: $ billion, 2021

Table 43: Russia car manufacturing industry share: % share, by volume, 2021

Table 44: Russia car manufacturing industry value forecast: $ billion, 2021–26

Table 45: Russia car manufacturing industry volume forecast: thousand units, 2021–26

Table 46: Russia size of population (million), 2017–21

Table 47: Russia gdp (constant 2005 prices, $ billion), 2017–21

Table 48: Russia gdp (current prices, $ billion), 2017–21

Table 49: Russia inflation, 2017–21

Table 50: Russia consumer price index (absolute), 2017–21

Table 51: Russia exchange rate, 2017–21

Table 52: Stellantis NV: key facts

Table 53: Stellantis NV: Annual Financial Ratios

Table 54: Stellantis NV: Key Employees

Table 55: Stellantis NV: Key Employees Continued

Table 56: Stellantis NV: Key Employees Continued

Table 57: Volkswagen AG: key facts

Table 58: Volkswagen AG: Annual Financial Ratios

Table 59: Volkswagen AG: Key Employees

Table 60: Volkswagen AG: Key Employees Continued

Table 61: Volkswagen AG: Key Employees Continued

Table 62: Renault SA: key facts

Table 63: Renault SA: Annual Financial Ratios

Table 64: Renault SA: Key Employees

Table 65: Renault SA: Key Employees Continued

Table 66: Renault SA: Key Employees Continued

Table 67: Renault SA: Key Employees Continued

Table 68: Toyota Motor Corporation: key facts

Table 69: Toyota Motor Corporation: Annual Financial Ratios

Table 70: Toyota Motor Corporation: Key Employees

Table 71: Toyota Motor Corporation: Key Employees Continued

Table 72: Toyota Motor Corporation: Key Employees Continued

Table 73: General Motors Company: key facts

Table 74: General Motors Company: Annual Financial Ratios

Table 75: General Motors Company: Key Employees

Table 76: General Motors Company: Key Employees Continued

Table 77: General Motors Company: Key Employees Continued

Table 78: Zhejiang Geely Holding Group Co Ltd: key facts

Table 79: Zhejiang Geely Holding Group Co Ltd: Key Employees

Table 80: Suzuki Motor Corporation: key facts

Table 81: Suzuki Motor Corporation: Annual Financial Ratios

Table 82: Suzuki Motor Corporation: Key Employees

Table 83: Suzuki Motor Corporation: Key Employees Continued

Table 84: Tata Motors Limited: key facts

Table 85: Tata Motors Limited: Annual Financial Ratios

Table 86: Tata Motors Limited: Key Employees

Table 87: Hyundai Motor Company: key facts

Table 88: Hyundai Motor Company: Annual Financial Ratios

Table 89: Hyundai Motor Company: Key Employees

Figures

List of Figures

Figure 1: BRIC car manufacturing industry, revenue($bn), 2017-26

Figure 2: BRIC car manufacturing industry, revenue($bn), 2017-21

Figure 3: BRIC car manufacturing industry, revenue($bn), 2021-26

Figure 4: Brazil car manufacturing industry value: $ billion, 2017–21

Figure 5: Brazil car manufacturing industry volume: thousand units, 2017–21

Figure 6: Brazil car manufacturing industry geography segmentation: % share, by value, 2021

Figure 7: Brazil car manufacturing industry share: % share, by volume, 2021

Figure 8: Brazil car manufacturing industry value forecast: $ billion, 2021–26

Figure 9: Brazil car manufacturing industry volume forecast: thousand units, 2021–26

Figure 10: Forces driving competition in the car manufacturing industry in Brazil, 2021

Figure 11: Drivers of buyer power in the car manufacturing industry in Brazil, 2021

Figure 12: Drivers of supplier power in the car manufacturing industry in Brazil, 2021

Figure 13: Factors influencing the likelihood of new entrants in the car manufacturing industry in Brazil, 2021

Figure 14: Factors influencing the threat of substitutes in the car manufacturing industry in Brazil, 2021

Figure 15: Drivers of degree of rivalry in the car manufacturing industry in Brazil, 2021

Figure 16: China car manufacturing industry value: $ billion, 2017–21

Figure 17: China car manufacturing industry volume: thousand units, 2017–21

Figure 18: China car manufacturing industry geography segmentation: % share, by value, 2021

Figure 19: China car manufacturing industry share: % share, by volume, 2021

Figure 20: China car manufacturing industry value forecast: $ billion, 2021–26

Figure 21: China car manufacturing industry volume forecast: thousand units, 2021–26

Figure 22: Forces driving competition in the car manufacturing industry in China, 2021

Figure 23: Drivers of buyer power in the car manufacturing industry in China, 2021

Figure 24: Drivers of supplier power in the car manufacturing industry in China, 2021

Figure 25: Factors influencing the likelihood of new entrants in the car manufacturing industry in China, 2021

Figure 26: Factors influencing the threat of substitutes in the car manufacturing industry in China, 2021

Figure 27: Drivers of degree of rivalry in the car manufacturing industry in China, 2021

Figure 28: India car manufacturing industry value: $ billion, 2017–21

Figure 29: India car manufacturing industry volume: thousand units, 2017–21

Figure 30: India car manufacturing industry geography segmentation: % share, by value, 2021

Figure 31: India car manufacturing industry share: % share, by volume, 2021

Figure 32: India car manufacturing industry value forecast: $ billion, 2021–26

Figure 33: India car manufacturing industry volume forecast: thousand units, 2021–26

Figure 34: Forces driving competition in the car manufacturing industry in India, 2021

Figure 35: Drivers of buyer power in the car manufacturing industry in India, 2021

Figure 36: Drivers of supplier power in the car manufacturing industry in India, 2021

Figure 37: Factors influencing the likelihood of new entrants in the car manufacturing industry in India, 2021

Figure 38: Factors influencing the threat of substitutes in the car manufacturing industry in India, 2021

Figure 39: Drivers of degree of rivalry in the car manufacturing industry in India, 2021

Figure 40: Russia car manufacturing industry value: $ billion, 2017–21

Figure 41: Russia car manufacturing industry volume: thousand units, 2017–21

Figure 42: Russia car manufacturing industry geography segmentation: % share, by value, 2021

Figure 43: Russia car manufacturing industry share: % share, by volume, 2021

Figure 44: Russia car manufacturing industry value forecast: $ billion, 2021–26

Figure 45: Russia car manufacturing industry volume forecast: thousand units, 2021–26

Figure 46: Forces driving competition in the car manufacturing industry in Russia, 2021

Figure 47: Drivers of buyer power in the car manufacturing industry in Russia, 2021

Figure 48: Drivers of supplier power in the car manufacturing industry in Russia, 2021

Figure 49: Factors influencing the likelihood of new entrants in the car manufacturing industry in Russia, 2021

Figure 50: Factors influencing the threat of substitutes in the car manufacturing industry in Russia, 2021

Figure 51: Drivers of degree of rivalry in the car manufacturing industry in Russia, 2021

Frequently asked questions

BRIC Countries (Brazil, Russia, India, China) Car Manufacturing Market Summary, Competitive Analysis and Forecast, 2017-2026 thematic reports
Currency USD
$995

Can be used by individual purchaser only

$1,990

Can be shared globally by unlimited users within the purchasing corporation e.g. all employees of a single company


Undecided about purchasing this report?

Enquire Before Buying Request a Free Sample

Get in touch to find out about multi-purchase discounts

reportstore@globaldata.com
Tel +44 20 7947 2745

Every customer’s requirement is unique. With over 220,000 construction projects tracked, we can create a tailored dataset for you based on the types of projects you are looking for. Please get in touch with your specific requirements and we can send you a quote.

Sample Report

BRIC Countries (Brazil, Russia, India, China) Car Manufacturing Market Summary, Competitive Analysis and Forecast, 2017-2026 was curated by the best experts in the industry and we are confident about its unique quality. However, we want you to make the most beneficial decision for your business, so we offer free sample pages to help you:

  • Assess the relevance of the report
  • Evaluate the quality of the report
  • Justify the cost

Download your copy of the sample report and make an informed decision about whether the full report will provide you with the insights and information you need.

Below is a sample report to understand what you are buying

See what our customers are saying

“The GlobalData platform is our go-to tool for intelligence services. GlobalData provides an easy way to access comprehensive intelligence data around multiple sectors, which essentially makes it a one-for-all intelligence platform, for tendering and approaching customers.

GlobalData is very customer orientated, with a high degree of personalised services, which benefits everyday use. The highly detailed project intelligence and forecast reports can be utilised across multiple departments and workflow scopes, from operational to strategic level, and often support strategic decisions. GlobalData Analytics and visualisation solutions has contributed positively when preparing management presentations and strategic papers.”

Business Intelligence & Marketing Manager, SAL Heavy Lift

“COVID-19 has caused significant interference to our business and the COVID-19 intelligence from GlobalData has helped us reach better decisions around strategy. These two highlights have helped enormously to understand the projections into the future concerning our business units, we also utilise the project database to source new projects for Liebherr-Werk to use as an additional source to pitch for new business.”

Market Analyst & Management, Liebherr-Werk

Your daily news has saved me a lot of time and keeps me up-to-date with what is happening in the market, I like that you almost always have a link to the source origin. We also use your market data in our Strategic Business Process to support our business decisions. By having everything in one place on the Intelligence Center it has saved me a lot of time versus looking on different sources, the alert function also helps with this.

Head of Key Accounts, Saab AB

Having used several other market research companies, I find that GlobalData manages to provide that ‘difficult-to-get’ market data that others can’t, as well as very diverse and complete consumer surveys.

Marketing Intelligence Manager, Portugal Foods

Our experience with GlobalData has been very good, from the platform itself to the people. I find that the analysts and the account team have a high level of customer focus and responsiveness and therefore I can always rely on. The platform is more holistic than other providers. It is convenient and almost like a one stop shop. The pricing suite is highly competitive and value for our organisation.

I like reports that inform new segments such as the analysis on generation Z, millennials, the impact of COVID 19 to our banking customers and their new channel habits. Secondly the specialist insight on affluent sector significantly increases our understanding about this group of customers. The combination of those give us depth and breadth of the evolving market.

I’m in the business of answering and helping people make decisions so with the intelligence center I can do that, effectively and efficiently. I can share quickly key insights that answer and satisfy our country stakeholders by giving them many quality studies and primary research about competitive landscape beyond the outlook of our bank. It helps me be seen as an advisory partner and that makes a big difference. A big benefit of our subscription is that no one holds the whole data and because it allows so many people, so many different parts of our organisation have access, it enables all teams to have the same level of knowledge and decision support.

Head of Customer Insight and Research, Standard Chartered

“I know that I can always rely on Globaldata’s work when I’m searching for the right consumer and market insights. I use Globaldata insights to understand the changing market & consumer landscape and help create better taste & wellbeing solutions for our customers in food, beverage and healthcare industries.

Globaldata has the right data and the reports are of very high quality compared to your competitors. Globaldata not only has overall market sizes & consumer insights on food & beverages but also provides insights at the ingredient & flavour level. That is key for B2B companies like Givaudan. This way we understand our customers’ business and also gain insight to our unique industry”

Head of Consumer Sensory Insights, Givaudan

GlobalData provides a great range of information and reports on various sectors that is highly relevant, timely, easy to access and utilise.  The reports and data dashboards help engagement with clients; they provide valuable industry and market insights that can enrich client conversations and can help in the shaping of value propositions. Moreover, using GlobalData products has helped increase my knowledge of the finance sector, the players within it, and the general threats and opportunities.

I find the consumer surveys that are carried out to be extremely beneficial and not something I have seen anywhere else. They provided an insightful view of why and which consumers take (or don’t) particular financial products. This can help shape conversations with clients to ensure they make the right strategic decisions for their business.

One of the challenges I have found is that data in the payments space is often piecemeal. With GD all of the data I need is in one place, but it also comes with additional market reports that provide useful extra context and information. Having the ability to set-up alerts on relevant movements in the industry, be it competitors or customers, and have them emailed directly to me, ensures I get early sight of industry activity and don’t have to search for news.

Senior Account Manager, TSYS
Go even deeper with GlobalData Intelligence Center

Every Company Report we produce is powered by the GlobalData Intelligence Center.

Subscribing to our intelligence platform means you can monitor developments at BRIC Countries (Brazil, Russia, India, China) Car Manufacturing Market Summary, Competitive Analysis and Forecast, 2017-2026 in real time.

  • Access a live BRIC Countries (Brazil, Russia, India, China) Car Manufacturing Market Summary, Competitive Analysis and Forecast, 2017-2026 dashboard for 12 months, with up-to-the-minute insights.
  • Fuel your decision making with real-time deal coverage and media activity.
  • Turn insights on financials, deals, products and pipelines into powerful agents of commercial advantage.