Business to Consumer (B2C) Ecommerce Market Trends and Analysis by Region, Payment Type and Segment Forecast to 2028
Powered by ![]()
Access in-depth insight and stay ahead of the market

Accessing the in-depth insights from the ‘B2C Ecommerce’ report can help:
- Gain a valuable understanding of the market size based on payment type and regional markets.
- Map the entire value chain ecosystem.
- Identify key market segments with country-level insights.
- Evaluate growth opportunities in payment-type segments supported by qualitative commentary.
- Identify market dynamics of the sector and align business strategies to capitalize on them.
- Analyze recent B2C ecommerce mergers & acquisitions and venture financing.
How is our ‘B2C Ecommerce’ report different from other reports in the market?
- The report provides a detailed analysis of the market size and forecast in terms of revenue ($Billion) for over 23 countries, including historical and projected data from 2019 to 2028.
- Detailed segmentation by payment type- online payment and offline payment.
- The report highlights the use cases of the B2C ecommerce market.
- The study identifies the key factors influencing the market dynamics of the B2C ecommerce market space. These factors are categorized based on their positive and negative attributes respectively into drivers and challenges.
- The market timeline covers the major milestones in the journey of the B2C ecommerce market space.
- The competitive landscape of the market features recent mergers and acquisitions and venture financing to provide insights into competitive trends.
- Detailed company profiles for key vendors of the market, focusing on business overview, financial performance, SWOT analysis, key personnel, and strategic initiatives.
We recommend this valuable source of information to:
- B2C Ecommerce Companies
- Ecommerce Solution Providers
- M&A Consultants
- Consulting & Professional Services Firms
- Venture Capital/Equity Firms
Get a Snapshot of the B2C Ecommerce Market, Download a Free Report Sample
B2C Ecommerce Market Report Overview
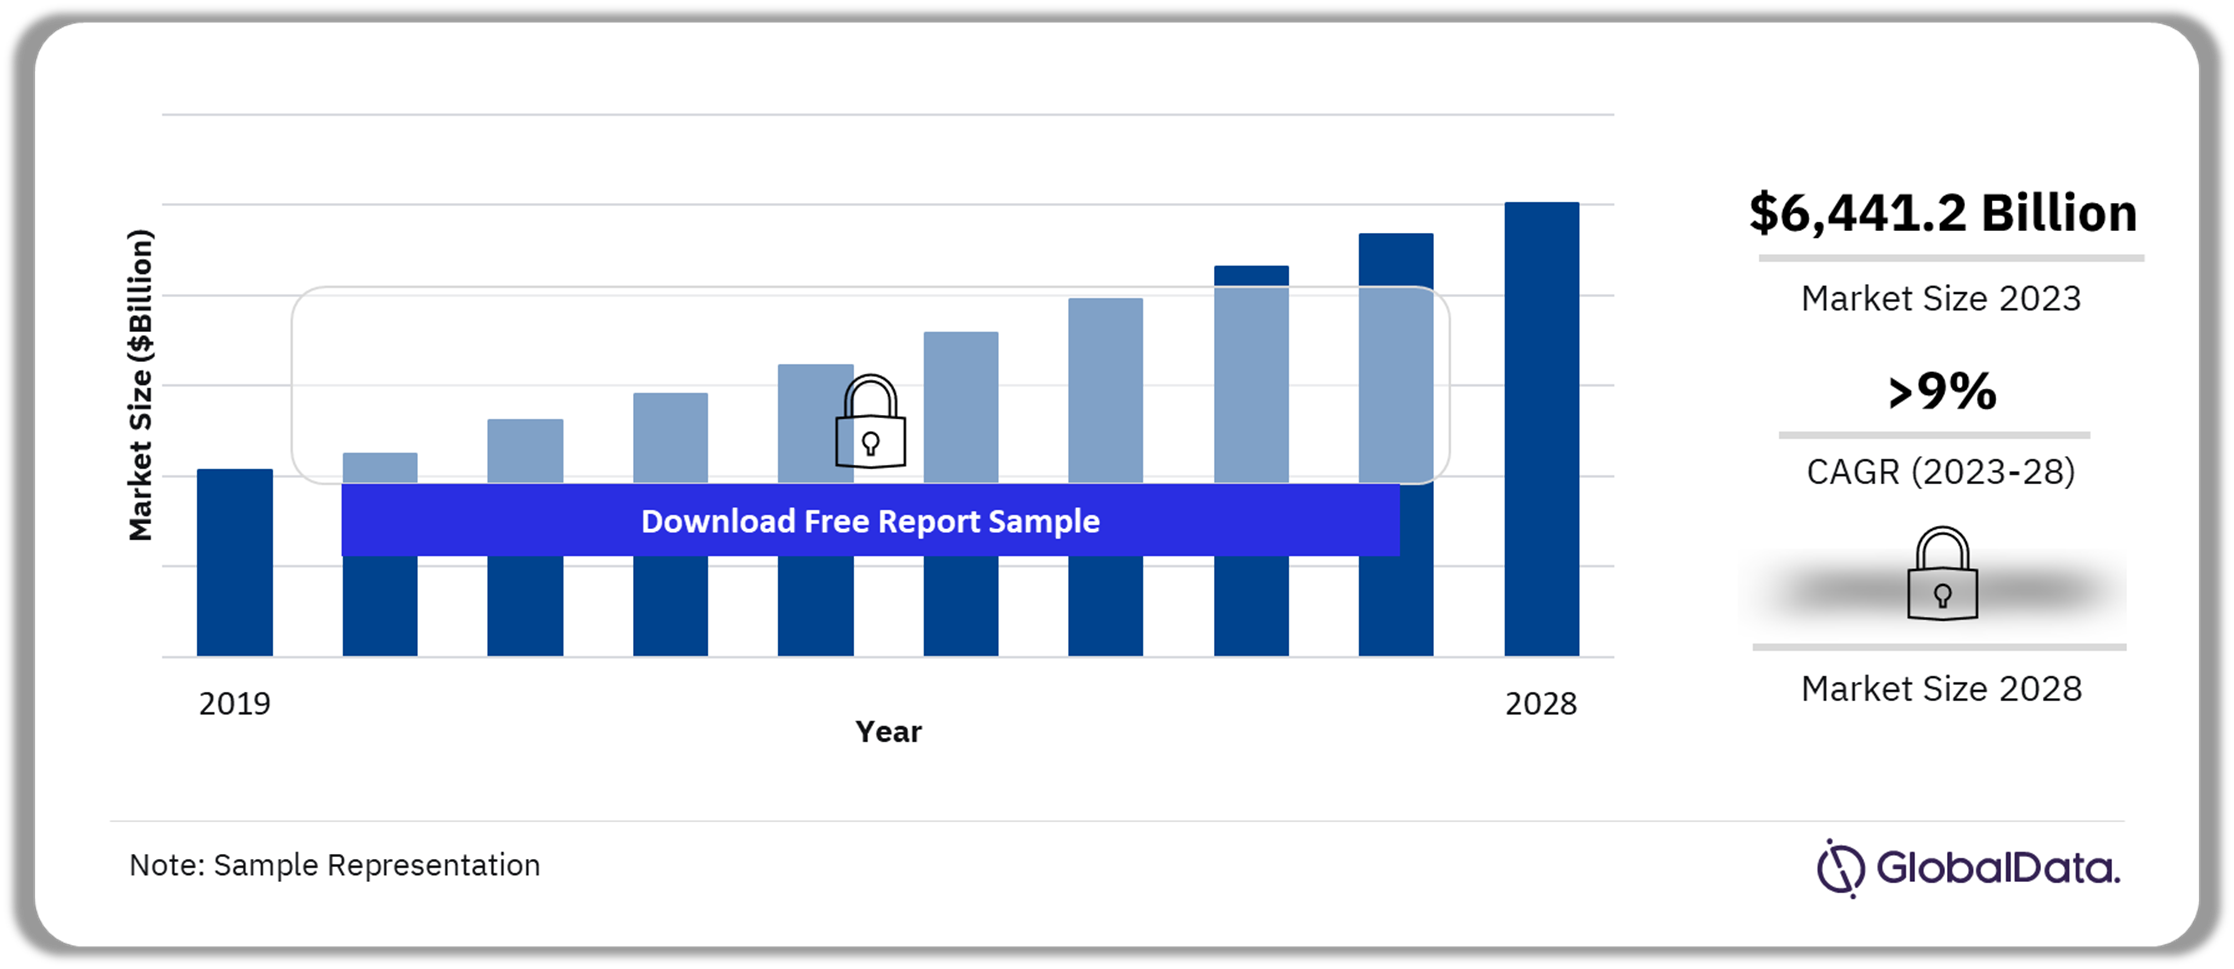
The B2C ecommerce market size revenue was valued at $6.4 trillion in 2023 and is expected to grow at a compound annual growth rate (CAGR) of more than 9% over the forecast period. The market for B2C ecommerce is primarily driven by the increasing number of smartphone users, coupled with the growing internet penetration globally. The convenience associated with online shopping applications, such as the availability of various options at one’s fingertips and doorstep delivery at chosen time slots, is supporting market growth.
The rising trend of personalization for shoppers in the B2C ecommerce sector is supporting the market growth. With the use of advanced technology, ecommerce companies are targeting audiences with personalized recommendations based on similar shoppers, demographics, past orders, or search history. Furthermore, the expanding social media user base is contributing to the growth. Social media platforms are being increasingly used to target specific audiences and promote new retailers or brand highlights.
B2C Ecommerce Market Outlook, 2019–2028 ($Billion)
Buy the Full Report for Additional Insights on the B2C Ecommerce Market Forecast
Online demand is projected to remain strong over the forecast period, favoring the B2C ecommerce growth, due to the continuously increasing number of online shoppers worldwide. According to Eurostat, in 2023, 75% of internet users bought or ordered goods or services online in the EU. The estimates also show that more than 85% of internet users between the ages of 25-34 bought or ordered goods or services for private use. These figures are further projected to grow with the increasing internet penetration in the coming years.
The growth is further being supported by the high-speed internet connection along with the proliferation of 4G & 5G technology. The increasing internet connection, particularly in emerging economies of Asia Pacific and South & Central America, is driving the growth across the B2C ecommerce sector. According to the International Telecommunication Union (ITU), 5G mobile network coverage has increased to reach 40% of the world population in 2023. This encompasses the coverage of 89% of the population in high-income countries with 5G networks.
The ecommerce sector is highly regulated by global organizations due to the risk of hackers leaking personal information, which can have adverse effects on individuals using these ecommerce platforms. Thus, companies in the industry must ensure compliance with regulations such as the General Data Protection Regulation (GDPR) or risk significant financial penalties, as these ecommerce companies collect large amounts of personal data. This poses a significant challenge to the market growth over the forecast period.
However, implementing strong data security solutions and leveraging available service providers in the industry, can enable companies to overcome these challenges. Service providers use technologies such as encryption or tokenization to secure customer data from being hacked or stolen. As a result, technology giants such as Amazon are partnering with security providers, specializing in various categories such as application security, compliance and privacy, data protection, identity and access management, infrastructure protection, threat detection and response, perimeter protection, and core security.
| Market Size (2023) | $6,441.2 billion |
| CAGR (2023 – 2028) | > 9% |
| Forecast Period | 2023-2028 |
| Historical Period | 2019-2022 |
| Report Scope & Coverage | Industry Overview, Revenue Forecast, Regional Analysis, Competitive Landscape, Company Profiles, Growth Trends |
| Payment Type Segment | Online Payment and Offline Payment |
| Geographies | North America, Europe, Asia Pacific, Middle East & Africa, South & Central America |
| Countries | US, Canada, Mexico, Germany, Italy, Sweden, Spain, France, UK, Rest of Europe, China, Japan, India, Indonesia, South Korea, Taiwan, Thailand, Australia, Rest of Asia Pacific, South Africa, Saudi Arabia, UAE, Rest of Middle East & Africa, Argentina, Brazil, Chile, Rest of South & Central America |
| Key Companies | Alibaba Group Holding Ltd., Amazon.com Inc., Apple Inc., eBay Inc., JD.com Inc., PDD Holdings Inc., Rakuten Group, Inc., Shopify Inc., Walmart Inc., and Zalando SE |
| Enquire & Decide | Discover the perfect solution for your business needs. Enquire now and let us help you make an informed decision before making a purchase. |
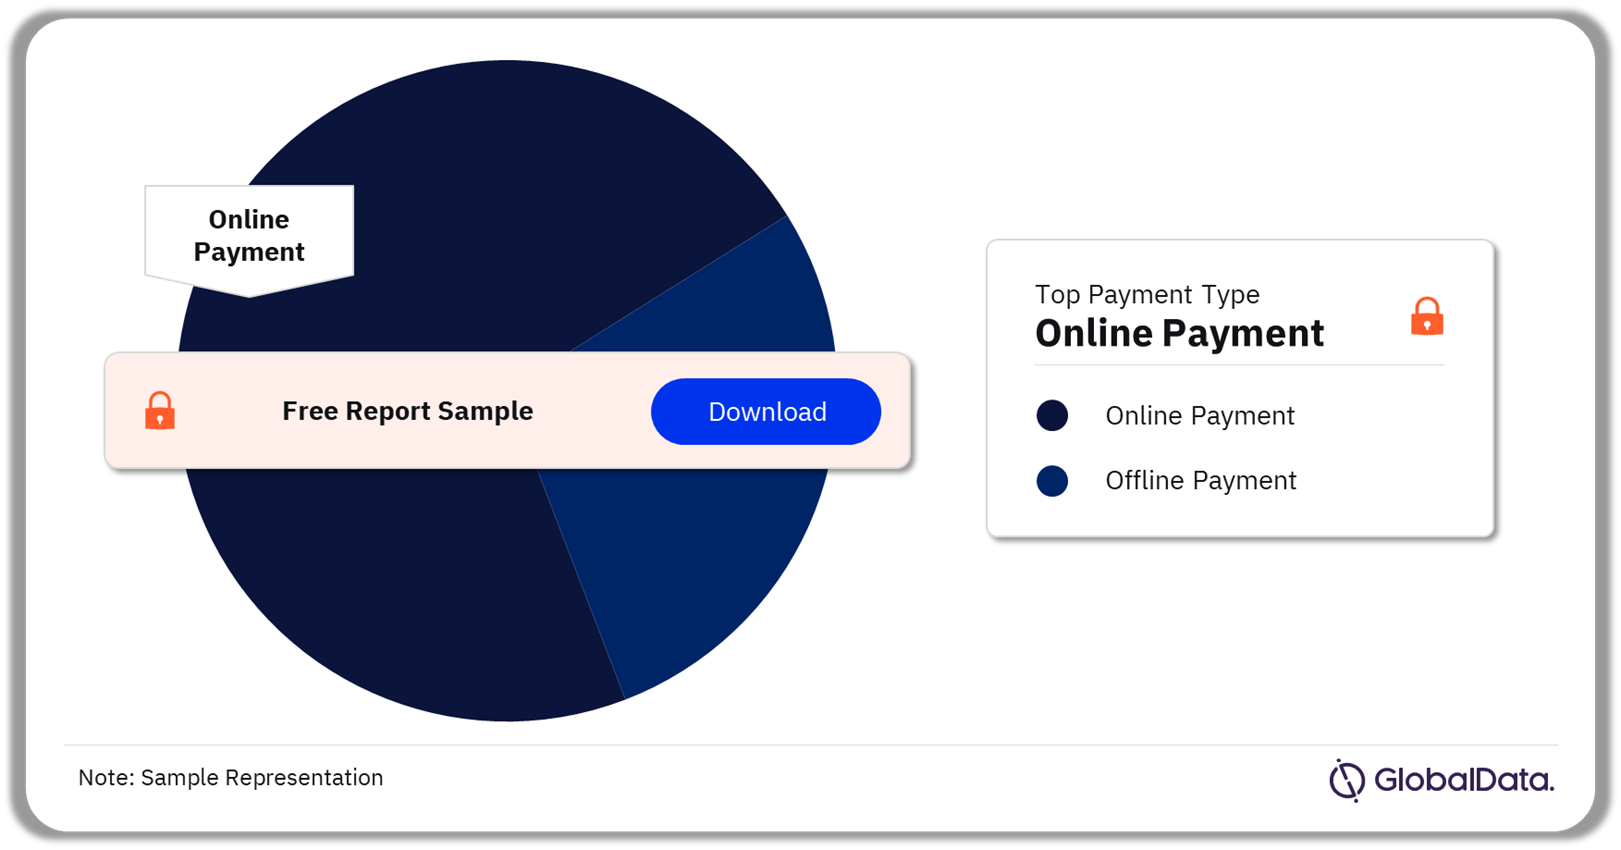
B2C Ecommerce Market Segmentation by Payment Type
Based on the payment type, the online payment segment is leading the overall B2C ecommerce market and is further projected to grow at the highest CAGR over the forecast timeframe. The advent of mobile payments (m-payments) has moved the industry a step ahead by allowing consumers to purchase goods remotely. One of the recent developments in the m-wallet sector is biometric (fingerprint) payment verification, which reduces the time taken for payment and payment verification by customers through a quick fingerprint scan.
The global trend towards electronic payments is also being driven by the increasing efforts of governmental organizations to provide the required support to service providers. For instance, the Central Asia Regional Economic Cooperation (CAREC) Digital Strategy 2030 launched in February 2022 by the CAREC Secretariat and supported by the Asian Development Bank (ADB), aims to establish a shared CAREC Digital Space. Member countries of the CAREC plan to collaborate to eliminate legal barriers in cross-border trade and harmonize policies to facilitate ecommerce development (including e-payments) across the CAREC region.
B2C Ecommerce Market Share by Payment Type, 2023 (%)
Buy the Full Report for More Information on B2C Ecommerce Market End-Users
The online payment segment is further projected to witness the fastest growth over the estimated period. The emergence of m-commerce or mobile commerce, where transactions are initiated from a mobile device, such as a smartphone or tablet, is rapidly becoming one of the main growth drivers for the ecommerce market globally. This trend is stronger in emerging markets where smartphones are the primary online tools to access the internet.
Ecommerce companies are further considering partnerships with m-wallet providers to speed up the payment verification process and make it more seamless. This is because the availability of a highly secure payment system encourages users to make online purchases. In addition, this leads to a frictionless shopping experience for users, which creates growth opportunities coupled with repetitive purchases by customers.
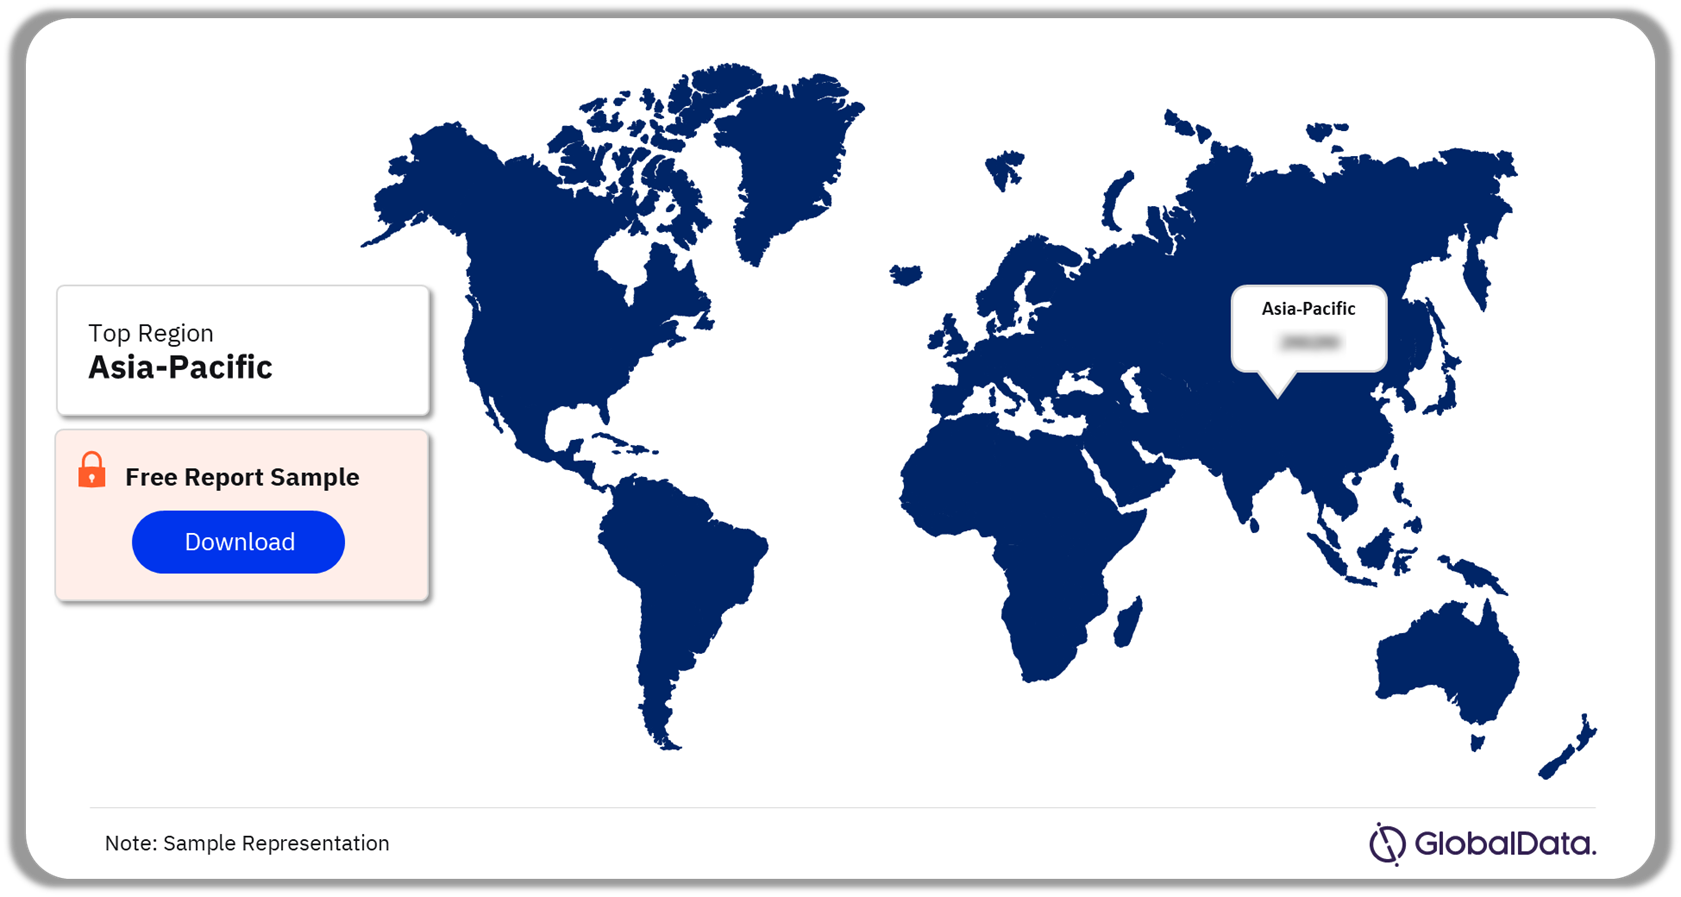
B2C Ecommerce Market Analysis by Region
The Asia Pacific region is leading the B2C ecommerce market with a revenue share exceeding 44% in 2023. The region has embraced digital technologies and e-commerce, fueled by growing mobile penetration and a tech-savvy population. This has led to the rise of digital platforms, online marketplaces, and fintech solutions, transforming various sectors. China leads the regional market in 2023 and is also a global leader in the B2C ecommerce market. The growth has been supported by a surge in internet users, propelled by a boost in recent years due to notable changes in spending patterns and consumer expectations.
Moreover, India is projected to exhibit the fastest growth over the forecast period with the highest CAGR of more than 21%. India is also one of the world’s fastest-growing ecommerce markets, primarily driven by the emergence of a younger, more tech-savvy generation, growing consumer purchasing power, increasing internet usage, and rising smartphone penetration.
B2C Ecommerce Market Share by Region, 2023 (%)
Buy the Full Report for Regional Insights into the B2C Ecommerce Market
North America is the second largest region led by the US. The US market is technologically mature and is driven by factors such as the increasing use of big data and AI to improve customer experience, which results in higher usage. In addition, these technically advanced data analytics processes help companies predict future trends more accurately and devise strategies accordingly.
Canada is anticipated to exhibit the fastest growth in the regional market during the estimated timeframe. According to the International Trade Administration U.S. Department of Commerce, in 2022, 75% of the Canadian population i.e., around 27 million people were ecommerce users in the country and this figure is expected to grow to 77.6% in 2025. The increasing number of online shoppers is the key factor driving the Canadian ecommerce sector growth.
The B2C ecommerce market is led by the UK in the European region. During the forecast period, Spain is estimated to exhibit the highest growth. Key factors influencing the regional growth include the high internet & smartphone penetration. The Digital Single Market (DSM) initiative, aimed at creating a homogeneous digital marketplace for consumers and businesses is further supporting the regional growth.
B2C Ecommerce Market – Competitive Landscape
B2C ecommerce companies are continuously focusing on investments in R&D and advanced technology to meet the requirements of changing consumer preferences. This leads to strategic collaborations, mergers & acquisitions, new product/service launches, and warehouse optimization. For instance, in Jun 2023, Techstars and eBay announced a partnership to launch Techstars future of ecommerce powered by eBay. This program is designed to support startups with innovative technologies that have the power to shape the future of ecommerce.
Along with this, companies are highly focusing on AI technology owing to its advanced features, which can provide profitable results to ecommerce companies. For instance, in Jun 2023, Google launched GenAI tools for immersive fashion retail. These new AI-based tools aim to provide a realistic and inclusive representation of products, particularly in the fashion industry. It focuses on helping users find clothes that suit various skin tones and body types. The goal is to instill confidence in online shoppers by providing more detailed representations of how clothing will appear on their bodies before making a purchase.
Similarly, Indian e-commerce marketplace Meesho, collaborated with Juniper Networks (Juniper) in Mar 2023 to implement its AI-driven software-defined wide area network (SD-WAN) solution. The deployment aims to enhance network connectivity and uptime for Meesho’s voice-over-internet protocol (VoIP) applications across its partner call centers in India. B2C ecommerce companies continuously strive to develop advanced solutions to enhance the online shopping experience for users. Key market leaders include Alibaba Group Holding Ltd., Amazon.com Inc., Apple Inc., eBay Inc., JD.com Inc., PDD Holdings Inc., Rakuten Group, Inc., Shopify Inc., Walmart Inc., and Zalando SE.
Leading Companies in the B2C Ecommerce Market
- Alibaba Group Holding Ltd.
- Amazon.com Inc.
- Apple Inc.
- eBay Inc.
- JD.com Inc.
- PDD Holdings Inc.
- Rakuten Group, Inc.
- Shopify Inc.
- Walmart Inc.
- Zalando SE
Other B2C Ecommerce Market Vendors Mentioned
Flipkart.com, SkipTheDishes, Btab Ecommerce Group, Inc., From You Flowers, LLC, FTD, LLC, ASOS plc., Meituan, Mercado Libre, among others.
Buy the Full Report to Know More About Leading B2C Ecommerce Companies
B2C Ecommerce Market Segments
GlobalData Plc has segmented the B2C ecommerce market report by payment type and region:
B2C Ecommerce Market Product Outlook (Revenue, $Billion, 2019–2028)
- Online Payment
- Offline Payment
B2C Ecommerce Market Regional Outlook (Revenue, $Billion, 2019–2028)
- North America
- Canada
- Mexico
- US
- Europe
- France
- Germany
- Italy
- Sweden
- Spain
- UK
- Rest of Europe
- Asia Pacific
- Australia
- China
- India
- Indonesia
- Japan
- South Korea
- Taiwan
- Thailand
- Rest of Asia Pacific
- South & Central America
- Argentina
- Brazil
- Chile
- Rest of South & Central America
- Middle East & Africa
- South Africa
- Saudi Arabia
- UAE
- Rest of the Middle East & Africa
Scope
The market intelligence report provides an in-depth analysis of the following –
• B2C ecommerce market outlook: analysis as well as historical figures and forecasts of revenue opportunities for payment type and regional segments
• The competitive landscape: an examination of recent mergers & acquisitions and venture financing in the B2C ecommerce market
• Company Analysis: analysis of the market position of leading providers in the B2C ecommerce market
• Underlying assumptions behind our published base-case forecasts, as well as potential market developments that would alter, either positively or negatively, our base-case outlook.
Key Highlights
The B2C ecommerce market size revenue was valued at $6.4 trillion in 2023 and is expected to grow at a compound annual growth rate (CAGR) of 9.3% over the forecast period. The B2C ecommerce market growth is primarily driven by the increasing number of smartphone users coupled with the growing internet penetration globally.
Reasons to Buy
• This market intelligence report offers a thorough, forward-looking analysis of the global B2C ecommerce market by payment type and key drivers in a concise format to help executives build proactive and profitable growth strategies.
• Accompanying GlobalData’s Forecast products, the report examines the assumptions, drivers, deals, strategic initiatives, and trend analysis in B2C ecommerce markets.
• Detailed segmentation by payment type – online payment and offline payment
• The report includes 60+ figures and tables providing in-depth analysis of the market size, forecast, and supporting factors which are tailor-made for an executive-level audience, with enhanced presentation quality.
• The report provides an easily digestible market assessment for decision-makers built around in-depth information gathered from local market players, which enables executives to quickly get up to speed with the current and emerging trends in B2C ecommerce market.
• The report evaluates the entire value chain of the B2C ecommerce market space while highlighting the key players of the industry.
• The report offers a list of recent mergers and acquisitions and a dedicated list of venture financing under competitive landscape.
Key Players
Alibaba Group Holding Ltd.Amazon.com Inc.
Apple Inc.
eBay Inc.
JD.com Inc.
PDD Holdings Inc.
Rakuten Group, Inc.
Shopify Inc.
Walmart Inc.
Zalando SE
Table of Contents
Table
Figures
Frequently asked questions
-
What was the B2C ecommerce market size in 2023?
The B2C ecommerce market size was valued at $6,441.2 billion in 2023.
-
What is the B2C ecommerce market growth rate?
The B2C ecommerce market is expected to grow at a CAGR of more than 9% during the forecast period.
-
What is the key B2C ecommerce market driver?
The B2C ecommerce market growth is primarily driven by the increasing number of smartphone users coupled with the growing internet penetration globally.
-
Which was the leading payment type segment in the B2C ecommerce market in 2023?
The online payment accounted for the largest B2C ecommerce market share in 2023.
-
Which are the leading B2C ecommerce companies globally?
The leading B2C ecommerce companies are Alibaba Group Holding Ltd., Amazon.com Inc., Apple Inc., eBay Inc., JD.com Inc., PDD Holdings Inc., Rakuten Group, Inc., Shopify Inc., Walmart Inc., and Zalando SE.
-
Is there a third level of segmentation in the report?
GlobalData’s focus is on providing reliable and accurate data that is supported by robust research methodology. Our reports undergo rigorous quality checks and are based on primary and secondary research sources, ensuring that the numbers and insights provided are trustworthy. However, despite the best efforts to gather comprehensive data, there could be instances where the available data is limited, making it challenging to provide third-level segmentation. In such cases, GlobalData may choose to provide high-level insights and general trends rather than forcing segmentation that may not be backed by sufficient data. This approach ensures that the report’s overall quality and credibility are maintained.
Get in touch to find out about multi-purchase discounts
reportstore@globaldata.com
Tel +44 20 7947 2745
Every customer’s requirement is unique. With over 220,000 construction projects tracked, we can create a tailored dataset for you based on the types of projects you are looking for. Please get in touch with your specific requirements and we can send you a quote.
Sample Report
We are confident about Business to Consumer (B2C) Ecommerce Market Trends and Analysis by Region, Payment Type and Segment Forecast to 2028 report's unique quality. However, we want you to make the most beneficial decision for your business, so we offer free sample pages to help you:
- Assess the relevance of the report
- Evaluate the quality of the report
- Justify the cost
Download your copy of the sample report and make an informed decision about whether the full report will provide you with the insights and information you need.


Related reports
View more Technology reports