Computer Vision Market Size, Share, Trends and Analysis by Region, Industry Vertical and Segment Forecasts to 2026

Powered by

Access in-depth insight and stay ahead of the market

Explore actionable market insights from the following data in our ‘Computer Vision’ report:

  • Make informed decisions about investments, partnerships, and product development
  • Identify your competitors positioning to stay ahead in the market
  • Identify promising areas, growth trends, segments, and markets to expand your product portfolio or successful investment
  • Anticipate expected changes in demand and adjust your business development strategies
  • Identify potential areas of disruption

How is our Computer Vision’ report different from other reports in the market?

  • The report presents in-depth market sizing and forecast at a segment level for more than 15 countries including historical and forecast analysis for the period 2019-2026 for market assessment
  • Detailed segmentation by vertical segments (IT & Telecom, BFSI, Healthcare, Government, Retail, Manufacturing, Energy & Utilities, and Others)
  • Detailed value chain analysis helping businesses identify areas where they can improve their efficiency and effectiveness, reduce costs, and enhance their competitive advantage
  • The growth innovation matrix included in the report, divides the market players in to four categories i.e., flagbearers, contenders, specialists, and experimenters, which will help value chain participants in understanding how competition is performing based on their revenue growth and their R&D efforts
  • Competitive profiling and benchmarking of key players in the market to provide deeper understanding of industry competition

We recommend this valuable source of information to anyone involved in:

  • Computer Vision Companies
  • System Integration Companies
  • Semiconductor Companies
  • IT Hardware and Software Companies
  • Venture Capitalists
  • Advisory Firms

To Get a Snapshot of the Computer Vision Market Report, Download a Free Report Sample

Computer Vision Market Report Overview

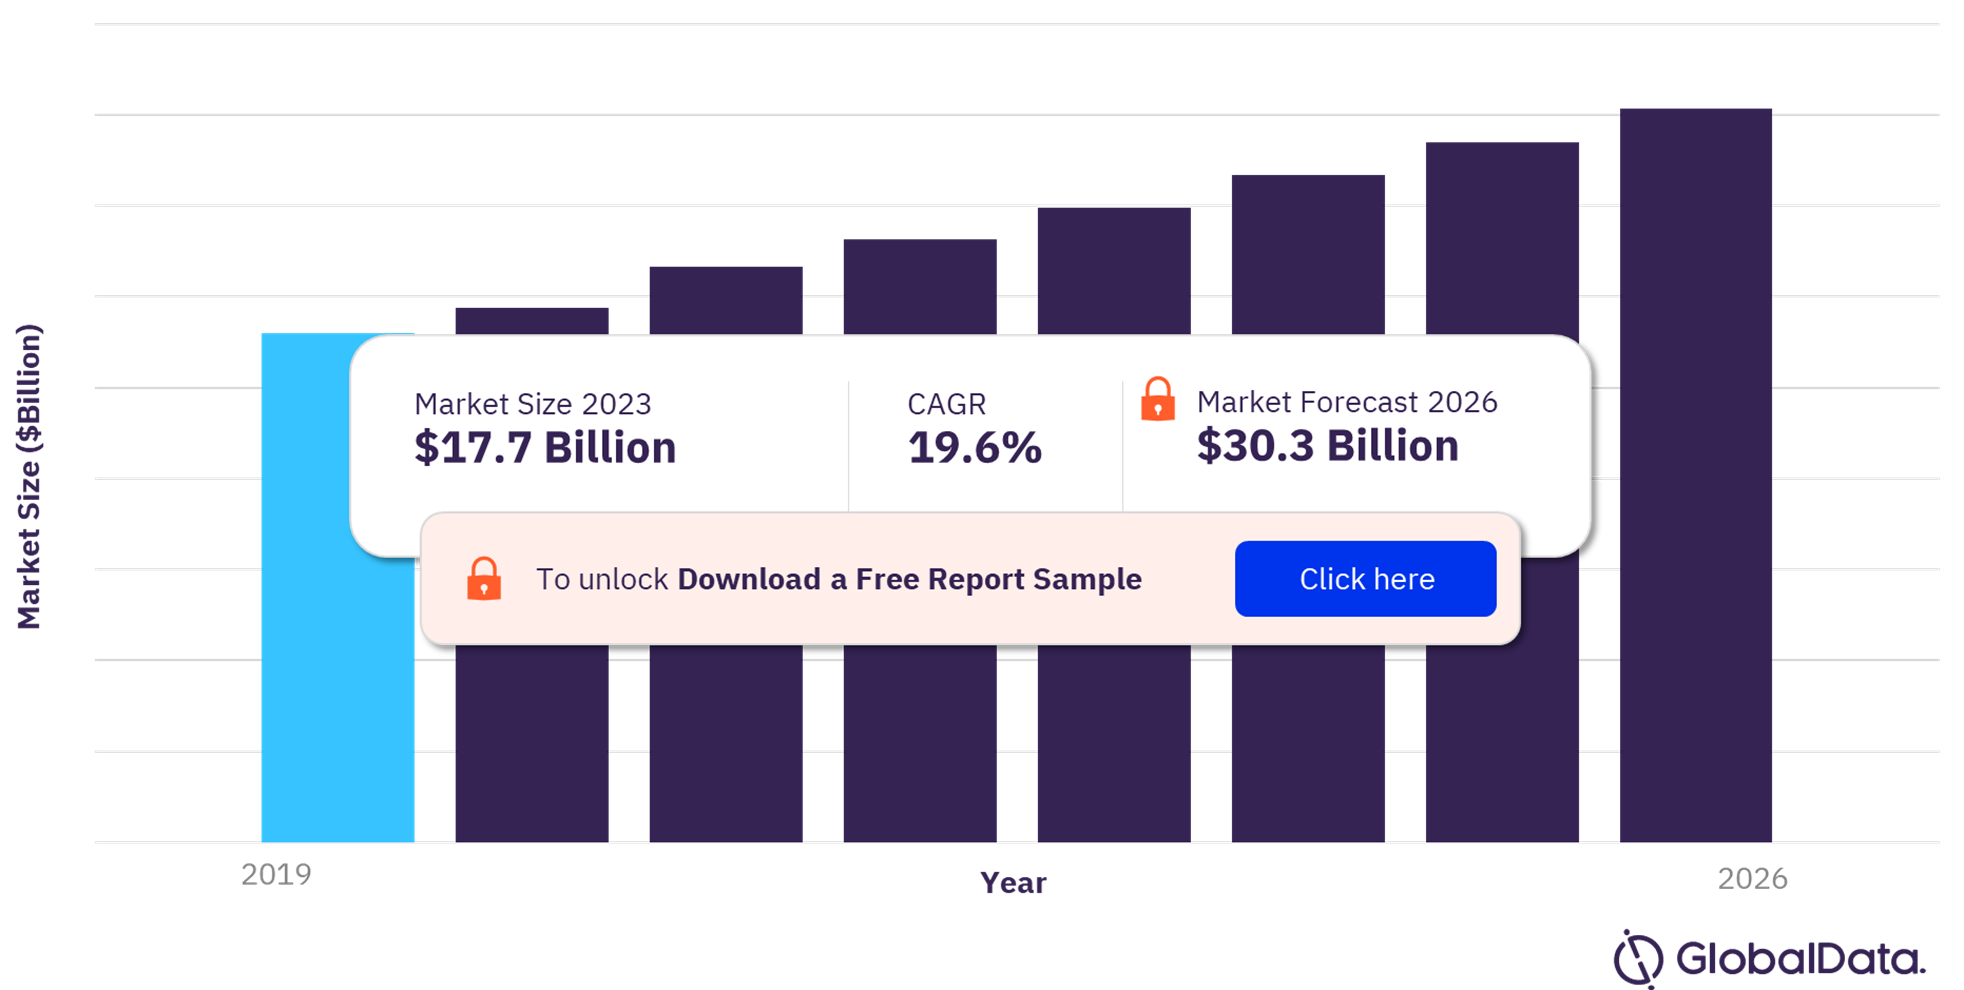
The computer vision market size will be valued at $17.7 billion in 2023 and is expected to grow at a compound annual growth rate (CAGR) of 19.6% during 2023-2026. An increasing need for automation and optimization of workflows across various sectors, including healthcare, automotive, retail, and BFSI are expected to drive the adoption of computer vision technology. The implementation of technologies such as edge computing, artificial intelligence, the Internet of Things (IoT), and automated machine learning, among others is also expected to drive the deployment of computer vision technology over the coming years.

The growing usage of augmented and virtual reality is anticipated to compel computer vision developers to broaden their expertise to new domains such as developing efficient and intuitive methods for interacting and replicating with real objects in 3D space. Continued refinement and research of the technology are expected to add new capabilities and a wide spectrum of functions. With the integration of edge and synchronization with synthetic databases, computer vision technology is anticipated to deliver accurate results in real-time.

Computer Vision Market Outlook, 2019-2026 ($ Billion)

Computer Vision Market Outlook, 2019-2026 ($ Billion)

View Sample Report for Additional Insights on the Computer Vision Market Forecast, Download a Free Sample

Continued advancements in computer vision have helped organizations to move from using the technology to retrieve descriptive diagnostic results to being predictive in their approach. The technology has enabled organizations to deploy prescriptive solutions that deliver real-time actionable insights and outcomes. Further, computer vision technologies such as image recognition (including facial recognition) and video recognition help in improving the security of valuable assets. Such advancements are anticipated to drive the adoption of computer vision systems in the future.

Although the technology has found an increasing number of use cases across various sectors, there are a few challenges, which are expected to hinder computer vision market growth. For example, high cost, inadequate hardware, lack of training data, and complex deployment of the computer vision technology could challenge adoption. The high cost and complex installation also make it difficult for small and medium enterprises to deploy these systems. The computer vision technology requires a set of sample data, including videos and images with tags and labels, which are used for training algorithms. Poor quality or limited amount of training data is prone to produce inaccurate output. Such shortcomings related to computer vision are anticipated to pose a challenge to market growth.

Market Size (2023) US$ 17.7 billion
Market Size (2026) US$ 30.3 billion
CAGR (2023-2026) 19.6%
Forecast Period 2023-2026
Historic Data 2019-2022
Report Scope & Coverage Revenue Forecast, Competitive Index, Company Market Share, and Growth Trends
Region Segment North America, Western Europe, Central & Eastern Europe, APAC, South & Central America, and Middle East & Africa
Vertical Segment IT & Telecom, BFSI, Healthcare, Government, Retail, Manufacturing, Energy & Utilities, and Others.
Key Companies Microsoft Corp, Alphabet Inc, IBM, Intel, Ambarella, Apple Inc, Amazon.com Inc, Hikvision, and Bosch

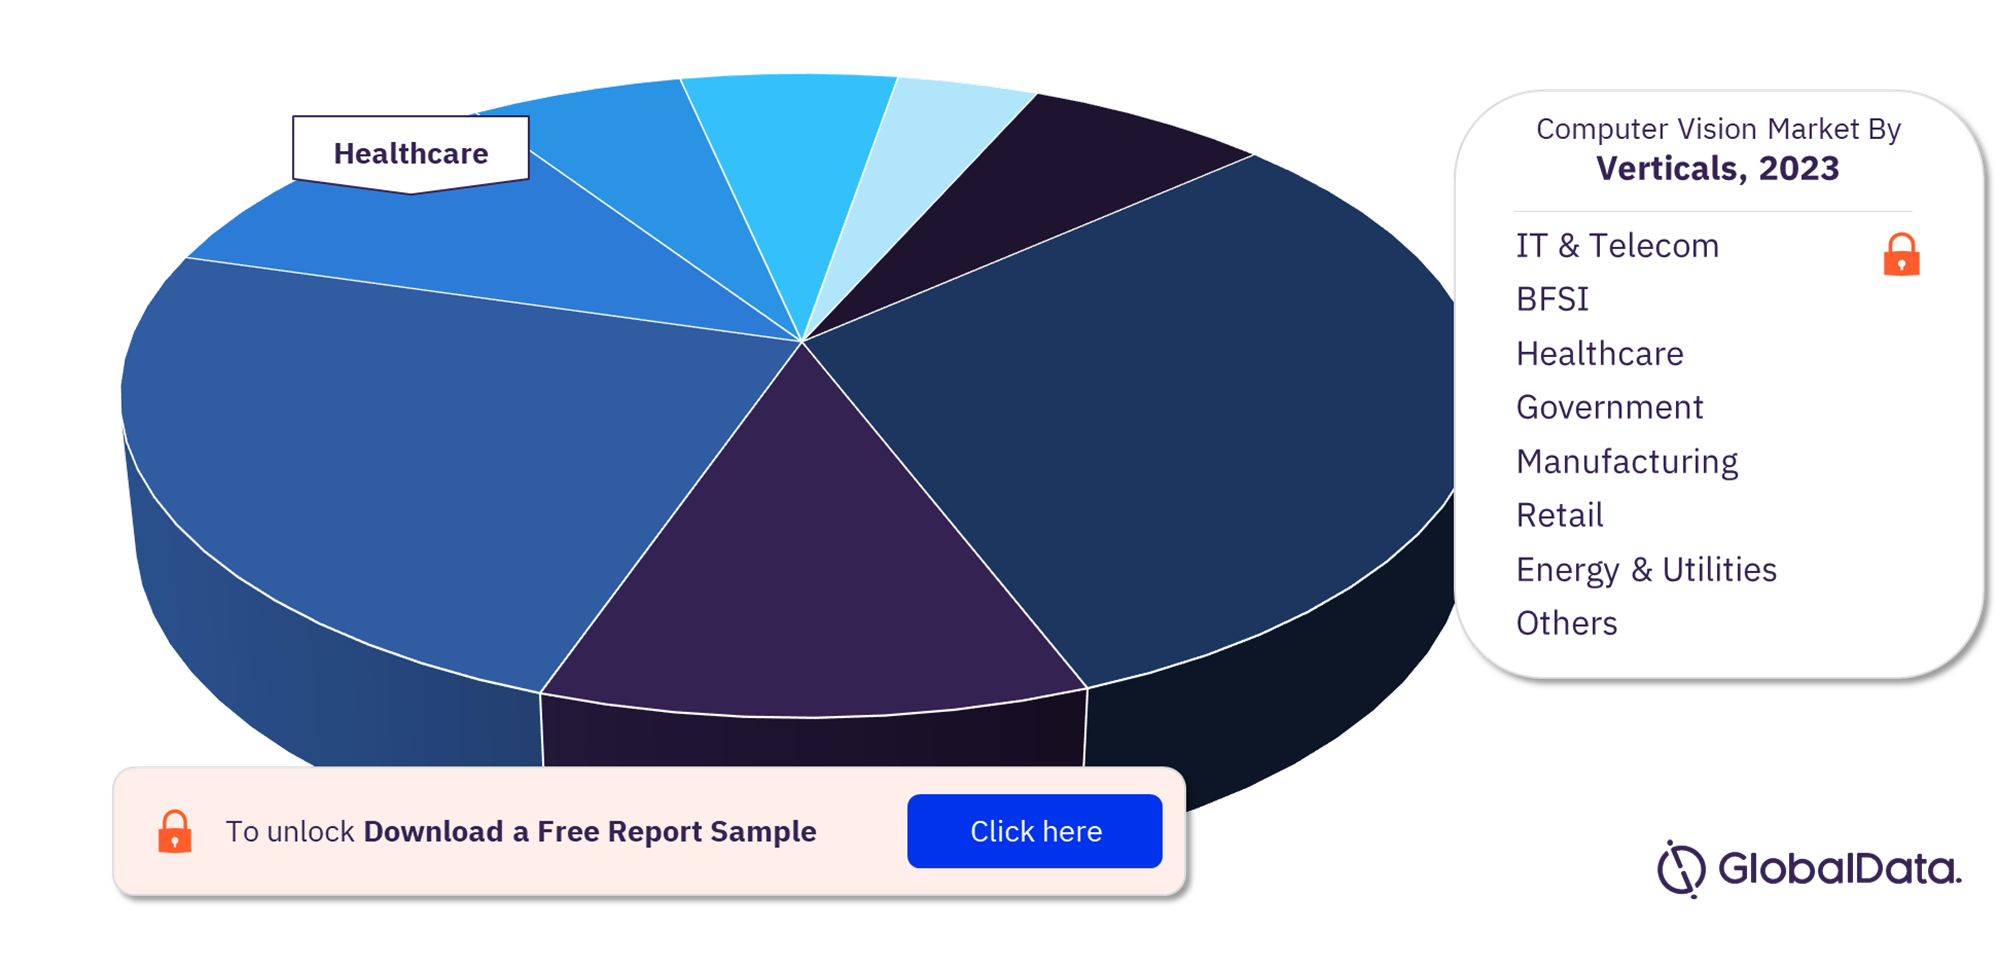
Computer Vision Market Segmentation by Vertical

Computer vision finds applications across verticals such as IT & Telecom, BFSI, healthcare, government, retail, manufacturing, and energy & utilities. The BFSI segment held a significant market share of over 20% in 2022 and is expected to retain its dominance over the forecast period. The BFSI sector is one of the early adopters of this technology, utilizing computer vision to optimize daily operations using customer experience metrics and sentiment analysis for increasing security while mitigating frauds. This helps the financial institutions in increasing the speed and accuracy while automating processes such as KYC, insurance documentation, commercial banking, and more.

Computer Vision Market Share by Vertical, 2023 (%)

Computer Vision Market Share by Vertical, 2023 (%)

Fetch Sample PDF for Segment-specific revenues and shares, Download a Free Sample

The IT & telecom and healthcare verticals captured over 15% of the overall market share in 2023. Computer vision as a service is gaining traction with telecom companies using the technology to offer enhanced response times to customers in government, private businesses, and industries. Telecom companies are offering these services to cater to the increasing need for low-latency and efficient computer vision for IoT and 5G use cases. As such, the proliferation of IoT devices and the roll-out of 5G is anticipated to propel the market growth. Further, computer vision is gaining prominence in the healthcare sector due to its ability to analyze medical imaging with speed and provide more accurate diagnoses than human professionals.

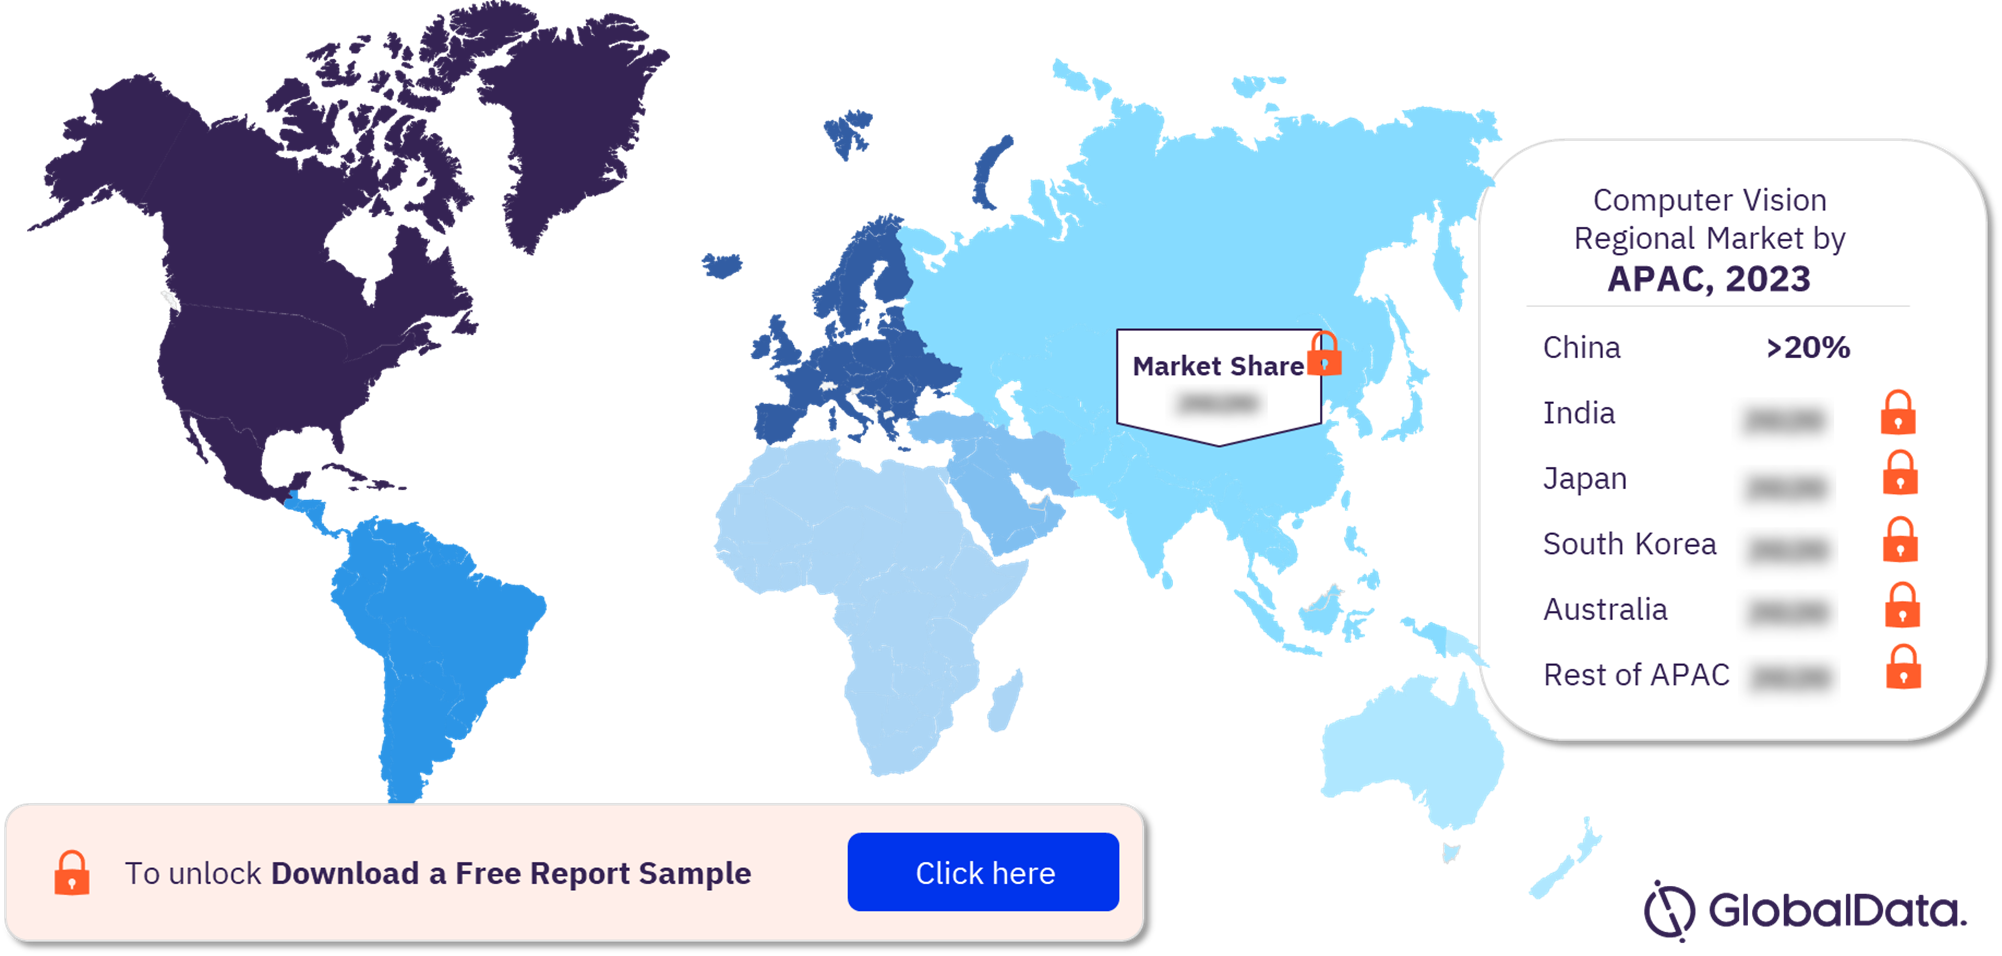
Computer Vision Market Analysis by Region

North America accounted for the highest market share of over 30% of the overall market in 2022. The high market share is attributed to the early adoption of technology in the region and a high number of IoT deployments. Further, the robust IT & Telecom infrastructure across the region and the number of clouds and edge deployments are some factors supporting the adoption of computer vision.

Asia Pacific Computer Vision Market Share by Country, 2023 (%)

APAC Computer Vision Market Share by Country, 2023 (%)

View Sample Report for Additional Computer Vision Market Insights, Download a Free Sample

The Asia Pacific is anticipated to register a significant growth exceeding 10% over the forecast period.  An increasing number of use cases across diverse verticals is the prime factor expected to propel regional market demand. The adoption of computer vision in the electronics, automotive, and manufacturing industries for improving safety and automating various workflows such as assembly lines, quality inspection, and inventory management, among others, is fueling the demand in the Asia Pacific. These industries are making continued investments in product research and development, which is anticipated to driving the demand for more computer vision systems over the future.

Computer Vision Market – Competitive Landscape

The computer vision market is highly competitive, with several technology players investing in developing innovative computer vision solutions. For instance, in December 2022, Ambarella Inc unveiled the world’s first 4D Imaging Radar Architecture for autonomous vehicles, which will be centrally processed using the company’s highly efficient 5nm CV3 AI Domain Control SoCs and Oculii Adaptive AI Radar Software. This technology is expected to facilitate safer path planning and enhanced environmental perception in L2+ to L5 autonomous driving systems, AI-based ADAS, and autonomous robotics

Companies operating in the market have strong hold in their respective solution offerings. For instance, Khronos Group, Autodesk, Apple Inc, Siemens (DIS) have a strong hold in the software market, whereas the hardware is dominated by Alphabet Inc., Ambarella, Nvidia Corp, and Intel. Companies such as IBM, Baidu, Amazon.com Inc, Hikvision, and Meta are some of the leaders in the delivery side of the value chain.

Leading Players in the Computer Vision Market

  • Microsoft Corp
  • Alphabet Inc
  • Hikvision
  • Intel Corp
  • Ambarella
  • Apple Inc
  • IBM
  • Amazon.com Inc
  • Baidu
  • Bosch

Other Computer Vision Market Vendors Mentioned

Megvii Face++, SenseTime, Dahua Technology, Clarifai, Luminar Technologies, Qualcomm, Tesla, Velodyne, ByteDance, Keyence Technologies, Rockwell Automation, NEC, NVIDIA AMD, and Cognex, among others.

To Know More About Leading Computer Vision Market Players, Download a Free Sample

Computer Vision Market Segments and Scope

GlobalData Plc has segmented the computer vision market report by vertical, and region:

Global Computer Vision Market Vertical Outlook (Revenue, USD Million, 2019-2026)

  • IT & Telecom
  • BFSI
  • Healthcare
  • Government
  • Retail
  • Manufacturing
  • Energy & Utilities
  • Others

Global Computer Vision Regional Outlook (Revenue, USD Million, 2019-2026)

  • North America
  • US
  • Canada
  • Mexico
  • Western Europe 
  • Germany
  • UK
  • Germany
  • France
  • Italy
  • Netherlands
  • Rest of Western Europe
  • Central & Eastern Europe
  • Asia Pacific 
  • China
  • India
  • Japan
  • Australia
  • South Korea
  • Rest of Asia Pacific
  • South & Central America
  • Brazil
  • Argentina
  • Rest of South & Central America
  • Middle East & Africa
  • Saudi Arabia
  • South Africa
  • United Arab Emirates (UAE)
  • Rest of Middle East & Africa

The market intelligence report provides an in-depth analysis of the following –

  • Computer vision market outlook: analysis as well as historical figures and forecasts of revenue opportunities from the vertical, and region segments.
  • The competitive landscape: an examination of the positioning of leading players in the computer vision market.
  • Company snapshots: analysis of the market position of leading service providers in the computer vision market.
  • Underlying assumptions behind our published base-case forecasts, as well as potential market developments that would alter, either positively or negatively, our base-case outlook.

Scope

This report provides overview and service addressable market for computer vision.

It identifies the key trends impacting growth of the market over the next 12 to 24 months.

It includes global market forecasts for the computer vision industry and analysis of patents, company filings, and hiring trends.

It contains details of M&A and VF deals in the computer vision space.

The detailed value chain consists of three main aspects: Hardware, Software (Foundation Layer, Application Layer), and Delivery

Key Highlights

The global computer vision market size was valued at US$14.9 billion in 2022 and is expected to grow at a compound annual growth rate (CAGR) of 19.6% during 2023-2026. The increasing need for automation and optimization of workflows across various sectors, including healthcare, automotive, retail, BFSI, and others, is expected to drive the adoption of computer vision technology.

Reasons to Buy

This market intelligence report offers a thorough, forward-looking analysis of the global computer vision market, product type, key vendor outlook, and key opportunities in a concise format to help executives build proactive and profitable growth strategies.

Accompanying GlobalData’s Forecast products, the report examines the assumptions and drivers behind ongoing and upcoming trends in computer vision markets.

With more than 20 charts and tables, the report is designed for an executive-level audience, boasting presentation quality.

The report provides an easily digestible market assessment for decision-makers built around in-depth information gathered from local market players, which enables executives to quickly get up to speed with the current and emerging trends in computer vision markets.

The broad perspective of the report coupled with comprehensive, actionable detail will help Internet of Things players, investors, and other stakeholders succeed in the growing Internet of Things market globally.

Table of Contents

  • Table of Contents
  • CHAPTER 01 Executive Summary

    • 1.1 Computer Vision Market Snapshot, 2022 & 2026

  • CHAPTER 02 Research Scope & Segmentation
  • CHAPTER 03 Computer Vision Industry Trend Analysis

    • 3.1 Computer Vision – Industry Value Chain

      • 3.1.1 HARDWARE

        • 3.1.1.1 Semiconductors

          • 3.1.1.1.1 Semiconductor: Leaders & Challengers

        • 3.1.1.2 Cameras

          • 3.1.1.2.1 Cameras: Leaders & Challengers

        • 3.1.1.3 Sensors and lasers

          • 3.1.1.3.1 Sensors and Lasers: Leaders & Challengers

        • 3.1.1.4 Servers

          • 3.1.1.4.1 Servers: Leaders & Challengers

        • 3.1.1.5 Storage

          • 3.1.1.5.1 Storage: Leaders & Challengers

        • 3.1.1.6 Networking Equipment

          • 3.1.1.6.1 Networking Equipment: Leaders & Challengers

        • 3.1.1.7 Edge Equipment

          • 3.1.1.7.1 Edge Equipment: Leaders & Challengers

      • 3.1.2 SOFTWARE

        • 3.1.2.1 Computer Vision Software: Foundation Layer

          • 3.1.2.1.1 Machine Learning

            • 3.1.2.1.1.1 Machine Learning: Leaders & Challengers

          • 3.1.2.1.2 3D Modeling

            • 3.1.2.1.2.1 3D Modeling: Leaders & Challengers

          • 3.1.2.1.3 Knowledge Representation and Reasoning

            • 3.1.2.1.3.1 Knowledge Representation and Reasoning: Leaders & Challengers

        • 3.1.2.2 Application Layer

          • 3.1.2.2.1 Image Recognition

            • 3.1.2.2.1.1 Image Recognition: Leaders & Challengers

          • 3.1.2.2.2 Video Recognition

            • 3.1.2.2.2.1 Video Recognition: Leaders & Challengers

          • 3.1.2.2.3 Object Recognition

            • 3.1.2.2.3.1 Object Recognition: Leaders & Challengers

          • 3.1.2.2.4 Positioning and Navigation

            • 3.1.2.2.4.1 Positioning and Navigation: Leaders & Challengers

      • 3.1.3 DELIVERY

        • 3.1.3.1 Delivery: Leaders & Challengers
        • 3.1.3.2 Hardware Appliance
        • 3.1.3.3 Licensed Software
        • 3.1.3.4 Computer Vision as a Service

    • 3.2 Computer Vision Market Structure – PORTER’s Analysis
    • 3.3 Computer Vision – Market Variables & Impact Analysis

      • 3.3.1 MARKET DRIVER ANALYSIS

        • 3.3.1.1 Growing Focus on Automation
        • 3.3.1.2 Increasing adoption of Computer Vision in Healthcare and Retail
        • 3.3.1.3 Technological Advancements in the Automotive Sector

      • 3.3.2 MARKET CHALLENGES/IMPEDIMENTS

        • 3.3.2.1 High Initial Cost
        • 3.3.2.2 Poor Quality of Data
        • 3.3.2.3 Latency in Data Processing

      • 3.3.3 COMPUTER VISION USE CASES

        • 3.3.3.1 Automotive
        • 3.3.3.2 Healthcare
        • 3.3.3.3 Advertising
        • 3.3.3.4 Banking and Finance

    • 3.4 Computer Vision– Mergers & Acquisitions (M&A) , 2018-2022 (Q3)

      • 3.4.1 M&A ACTIVITY DASHBOARD

    • 3.5 Computer Vision– Patent Analysis, 2019-2021

      • 3.5.1 PATENT ANALYTICS DASHBOARD

    • 3.6 Computer Vision– Job Analysis, 2021

      • 3.6.1 JOB ANALYTICS DASHBOARD

    • 3.7 Computer Vision– Venture Financing Analysis, 2018-2022 (Q3)

      • 3.7.1 VENTURE FINANCING DASHBOARD

    • 3.8 Social Media Analysis, 2018-2022 (Q3)

      • 3.8.1 SOCIAL MEDIA ANALYTICS DASHBOARD

    • 3.9 Technology Trends
    • 3.10 Macroeconomic Trends
    • 3.11 Regulatory Trends

  • CHAPTER 04 Global Computer Vision Revenue Opportunity

    • 4.1 Global Computer Vision Market Revenue Snapshot, 2019-2026 (US$ Mn)
    • 4.2 Global Computer Vision Market, By Verticals, 2019-2026 (US$ Mn)

  • CHAPTER 05 Global Computer Vision Market, By Verticals

    • 5.1 Global Computer Vision Market, By Verticals, 2019-2026 (US$ Mn)

      • 5.1.1 IT & TELECOM
      • 5.1.2 BFSI
      • 5.1.3 HEALTHCARE
      • 5.1.4 GOVERNMENT
      • 5.1.5 RETAIL
      • 5.1.6 MANUFACTURING
      • 5.1.7 ENERGY AND UTILITIES
      • 5.1.8 OTHERS

  • CHAPTER 06 Computer Vision Regional Outlook

    • 6.1 Computer Vision – Regional Deep Dive, 2022
    • 6.2 North America Computer Vision Market Snapshot

      • 6.2.1 NORTH AMERICA COMPUTER VISION MARKET, BY VERTICALS, 2019-2026 (US$ MN)
      • 6.2.2 US COMPUTER VISION MARKET

        • 6.2.2.1 US Computer Vision Market, By Verticals, 2019-2026 (US$ Mn)

      • 6.2.3 CANADA COMPUTER VISION MARKET

        • 6.2.3.1 Canada Computer Vision Market, By Verticals, 2019-2026 (US$ Mn)

      • 6.2.4 MEXICO COMPUTER VISION MARKET

        • 6.2.4.1 Mexico Computer Vision Market, By Verticals, 2019-2026 (US$ Mn)

    • 6.3 Western Europe Computer Vision Market Snapshot

      • 6.3.1 WESTERN EUROPE COMPUTER VISION MARKET, BY VERTICALS, 2019-2026 (US$ MN)
      • 6.3.2 UK COMPUTER VISION MARKET

        • 6.3.2.1 UK Computer Vision Market, By Verticals, 2019-2026 (US$ Mn)

      • 6.3.3 GERMANY COMPUTER VISION MARKET

        • 6.3.3.1 Germany Computer Vision Market, By Verticals, 2019-2026 (US$ Mn)

      • 6.3.4 FRANCE COMPUTER VISION MARKET

        • 6.3.4.1 France Computer Vision Market, By Verticals, 2019-2026 (US$ Mn)

      • 6.3.5 ITALY COMPUTER VISION MARKET

        • 6.3.5.1 Italy Computer Vision Market, By Verticals, 2019-2026 (US$ Mn)

      • 6.3.6 NETHERLANDS COMPUTER VISION MARKET

        • 6.3.6.1 Netherlands Computer Vision Market, By Verticals, 2019-2026 (US$ Mn)

      • 6.3.7 REST OF WESTERN EUROPE COMPUTER VISION MARKET

        • 6.3.7.1 Rest of Western Europe Computer Vision Market, By Verticals, 2019-2026 (US$ Mn)

    • 6.4 Central & Eastern Europe Computer Vision Market Snapshot

      • 6.4.1 CENTRAL & EASTERN EUROPE COMPUTER VISION MARKET, BY VERTICALS, 2019-2026 (US$ MN)

    • 6.5 Asia Pacific Computer Vision Market Snapshot

      • 6.5.1 ASIA PACIFIC COMPUTER VISION MARKET, BY VERTICALS, 2019-2026 (US$ MN)
      • 6.5.2 CHINA COMPUTER VISION MARKET

        • 6.5.2.1 China Computer Vision Market, By Verticals, 2019-2026 (US$ Mn)

      • 6.5.3 INDIA COMPUTER VISION MARKET6

        • 6.5.3.1 India Computer Vision Market, By Verticals, 2019-2026 (US$ Mn)

      • 6.5.4 JAPAN COMPUTER VISION MARKET

        • 6.5.4.1 Japan Computer Vision Market, By Verticals, 2019-2026 (US$ Mn)

      • 6.5.5 AUSTRALIA COMPUTER VISION MARKET

        • 6.5.5.1 Australia Computer Vision Market, By Verticals, 2019-2026 (US$ Mn)

      • 6.5.6 SOUTH KOREA COMPUTER VISION MARKET

        • 6.5.6.1 South Korea Computer Vision Market, By Verticals, 2019-2026 (US$ Mn)

      • 6.5.7 REST OF ASIA PACIFIC COMPUTER VISION MARKET

        • 6.5.7.1 Rest of Asia Pacific Computer Vision Market, By Verticals, 2019-2026 (US$ Mn)

    • 6.6 South & Central America Computer Vision Market Snapshot

      • 6.6.1 SOUTH & CENTRAL AMERICA COMPUTER VISION MARKET, BY VERTICALS, 2019-2026 (US$ MN)
      • 6.6.2 BRAZIL COMPUTER VISION MARKET

        • 6.6.2.1 Brazil Computer Vision Market, By Verticals, 2019-2026 (US$ Mn)

      • 6.6.3 ARGENTINA COMPUTER VISION MARKE

        • 6.6.3.1 Argentina Computer Vision Market, By Verticals, 2019-2026 (US$ Mn)

      • 6.6.4 REST OF SOUTH & CENTRAL AMERICA COMPUTER VISION MARKET

        • 6.6.4.1 Rest of South & Central America Computer Vision Market, By Verticals, 2019-2026 (US$ Mn)

    • 6.7 Middle East & Africa Computer Vision Market Snapshot

      • 6.7.1 MIDDLE EAST & AFRICA COMPUTER VISION MARKET, BY VERTICALS, 2019-2026 (US$ MN)
      • 6.7.2 SAUDI ARABIA COMPUTER VISION MARKET

        • 6.7.2.1 Saudi Arabia Computer Vision Market, By Verticals, 2019-2026 (US$ Mn)

      • 6.7.3 SOUTH AFRICA COMPUTER VISION MARKET

        • 6.7.3.1 South Africa Computer Vision Market, By Verticals, 2019-2026 (US$ Mn)

      • 6.7.4 UAE COMPUTER VISION MARKET

        • 6.7.4.1 UAE Computer Vision Market, By Verticals, 2019-2026 (US$ Mn)

      • 6.7.5 REST OF MIDDLE EAST & AFRICA COMPUTER VISION MARKET

        • 6.7.5.1 Rest of Middle East & Africa Computer Vision Market, By Verticals, 2019-2026 (US$ Mn)

  • CHAPTER 07 Global Computer Vision Competitive Landscape

    • 7.1 Computer Vision Competitive Analysis
    • 7.2 Key Computer Vision Vendors Profiles

      • 7.2.1 AMAZON.COM INC

        • 7.2.1.1 Company Overview and Financial Performance
        • 7.2.1.2 Recent Developments and Innovations

      • 7.2.2 ALPHABET INC

        • 7.2.2.1 Company Overview and Financial Performance
        • 7.2.2.2 Recent Developments and Innovations

      • 7.2.3 AMBARELLA INC

        • 7.2.3.1 Company Overview and Financial Performance
        • 7.2.3.2 Recent Developments and Innovations

      • 7.2.4 BAIDU INC

        • 7.2.4.1 Company Overview and Financial Performance
        • 7.2.4.2 Recent Developments and Innovations

      • 7.2.5 HANGZHOU HIKVISION DIGITAL TECHNOLOGY CO LTD

        • 7.2.5.1 Company Overview and Financial Performance
        • 7.2.5.2 Recent Developments and Innovations

      • 7.2.6 INTERNATIONAL BUSINESS MACHINES CORP

        • 7.2.6.1 Company Overview and Financial Performance
        • 7.2.6.2 Recent Developments and Innovations

      • 7.2.7 INTEL CORP

        • 7.2.7.1 Company Overview and Financial Performance
        • 7.2.7.2 Recent Developments and Innovations

      • 7.2.8 META PLATFORMS INC

        • 7.2.8.1 Company Overview and Financial Performance
        • 7.2.8.2 Recent Developments and Innovations

      • 7.2.9 MICROSOFT CORP

        • 7.2.9.1 Company Overview and Financial Performance
        • 7.2.9.2 Recent Developments and Innovations

      • 7.2.10 NVIDIA CORP

        • 7.2.10.1 Company Overview and Financial Performance
        • 7.2.10.2 Recent Developments and Innovations

      • 7.2.11 SENSETIME GROUP LTD

        • 7.2.11.1 Company Overview and Financial Performance
        • 7.2.11.2 Recent Developments and Innovations

    • 7.3 Other Participants in the Computer Vision Market:

      • 7.3.1 NEC CORPORATION OF AMERICA
      • 7.3.2 ADVANTECH CO., LTD.
      • 7.3.3 KEYENCE CORPORATION
      • 7.3.4 ADVANCED MICRO DEVICES, INC.
      • 7.3.5 NXP SEMICONDUCTORS
      • 7.3.6 QUALCOMM TECHNOLOGIES, INC.
      • 7.3.7 STMICROELECTRONICS
      • 7.3.8 LUMINAR TECHNOLOGIES, INC.
      • 7.3.9 ROCKWELL AUTOMATION, INC.
      • 7.3.10 TESLA
      • 7.3.11 MIDEA
      • 7.3.12 APPLE INC

  • 7.3.13 SIEMENS (DIS)
  • CHAPTER 08 Methodology and Scope

    • 8.1 Information Procurement
    • 8.2 Computer Vision Analysis
    • 8.3 Market Opportunity Forecast – Research Methodology & Formulation
    • 8.4 Competitive Index – Research Methodology & Formulation
    • 8.5 Additional Resources

      • 8.5.1 MARKET DEFINITIONS – VERTICALS SEGMENTS

  • About GlobalData
  • Contact Us

Table

Table 1 Key Trends Overview

Table 2 Technology Trends

Table 3 Macroeconomic Trends

Table 4 Regulatory Trends

Table 5 Global Computer Vision Market, By Verticals, 2019 – 2026 ($Mn)

Table 6 Global Computer Vision Market, By Verticals, 2019 – 2026 ($Mn)

Table 7 North America Computer Vision Market, By Verticals, 2019 – 2026 ($Mn)

Table 8 US Computer Vision Market, By Verticals, 2019 – 2026 ($Mn)

Table 9 Canada Computer Vision Market, By Verticals, 2019 – 2026 ($Mn)

Table 10 Mexico Computer Vision Market, By Verticals, 2019 – 2026 ($Mn)

Table 11 Western Europe Computer Vision Market, By Verticals, 2019 – 2026 ($Mn)

Table 12 UK Computer Vision Market, By Verticals, 2019 – 2026 ($Mn)

Table 13 Germany Computer Vision Market, By Verticals, 2019 – 2026 ($Mn)

Table 14 France Computer Vision Market, By Verticals, 2019 – 2026 ($Mn)

Table 15 Italy Computer Vision Market, By Verticals, 2019 – 2026 ($Mn)

Table 16 Netherlands Computer Vision Market, By Verticals, 2019 – 2026 ($Mn)

Table 17 Rest of Western Europe Computer Vision Market, By Verticals, 2019 – 2026 ($Mn)

Table 18 Central & Eastern Europe Computer Vision Market, By Verticals, 2019 – 2026 ($Mn)

Table 19 Asia Pacific Computer Vision Market, By Verticals, 2019 – 2026 ($Mn)

Table 20 China Computer Vision Market, By Verticals, 2019 – 2026 ($Mn)

Table 21 India Computer Vision Market, By Verticals, 2019 – 2026 ($Mn)

Table 22 Japan Computer Vision Market, By Verticals, 2019 – 2026 ($Mn)

Table 23 Australia Computer Vision Market, By Verticals, 2019 – 2026 ($Mn)

Table 24 South Korea Computer Vision Market, By Verticals, 2019 – 2026 ($Mn)

Table 25 Rest of Asia Pacific Computer Vision Market, By Verticals, 2019 – 2026 ($Mn)

Table 26 South & Central America Computer Vision Market, By Verticals, 2019 – 2026 ($Mn)

Table 27 Brazil Computer Vision Market, By Verticals, 2019 – 2026 ($Mn)

Table 28 Argentina Computer Vision Market, By Verticals, 2019 – 2026 ($Mn)

Table 29 Rest of South & Central America Computer Vision Market, By Verticals, 2019 – 2026 ($Mn)

Table 30 Middle East & Africa Computer Vision Market, By Verticals, 2019 – 2026 ($Mn)

Table 31 Saudi Arabia Computer Vision Market, By Verticals, 2019 – 2026 ($Mn)

Table 32 South Africa Computer Vision Market, By Verticals, 2019 – 2026 ($Mn)

Table 33 UAE Computer Vision Market, By Verticals, 2019 – 2026 ($Mn)

Table 34 Rest of Middle East & Africa Computer Vision Market, By Verticals, 2019 – 2026 ($Mn)

Figures

Fig.1 Computer Vision Market Snapshot

Fig.2 Computer Vision Market Segmentation

Fig.3 Computer Vision Industry Value Chain Analysis

Fig.4 Semiconductors: Leaders & Challengers

Fig.5 Cameras: Leaders & Challengers

Fig.6 Sensors and Lasers: Leaders & Challengers

Fig.7 Servers: Leaders & Challengers

Fig.8 Storage: Leaders & Challengers

Fig.9 Networking Equipment: Leaders & Challengers

Fig.10 Edge Equipment: Leaders & Challengers

Fig.11 Machine Learning:

Fig.12 3D Modeling: Leaders & Challengers

Fig.13 Knowledge Representation and Reasoning: Leaders & Challengers

Fig.14 Image Recognition: Leaders & Challengers

Fig.15 Video Recognition: Leaders & Challengers

Fig.16 Object Recognition: Leaders & Challengers

Fig.17 Positioning and Navigation: Leaders & Challengers

Fig.18 Delivery: Leaders & Challengers

Fig.19 Global Computer Vision PORTER’s Five Force Analysis

Fig.20 Computer Vision Market – Key Drivers Impact Analysis

Fig.21 Computer Vision– Key Market Challenges/Impediments Impact Analysis

Fig.22 Computer Vision– M&A Activity Dashboard

Fig.23 Computer Vision– Patent Activity Dashboard

Fig.24 Computer Vision– Job Analytics Dashboard

Fig.25 Computer Vision– Venture Financing Dashboard

Fig.26 Computer Vision– Social Media Analytics Dashboard

Fig.27 Global Computer Vision Market – Revenue Opportunity Forecast, 2019-2026 ($ Mn)

Fig.28 Global Computer Vision Market, By Verticals, 2019-2026 ($ Mn)

Fig.29 Global Computer Vision Market, By Verticals, 2019-2026 ($ Mn)

Fig.30 Computer Vision– Market Overview

Fig.31 North America Computer Vision Market Snapshot

Fig.32 North America Computer Vision, By Verticals Share – 2022 & 2026 (%)

Fig.33 US Computer Vision, By Verticals Share – 2022 & 2026 (%)

Fig.34 Canada Computer Vision, By Verticals Share – 2022 & 2026 (%)

Fig.35 Mexico Computer Vision, By Verticals Share – 2022 & 2026 (%)

Fig.36 Western Europe Computer Vision Market Snapshot

Fig.37 Western Europe Computer Vision, By Verticals Share – 2022 & 2026 (%)

Fig.38 UK Computer Vision, By Verticals Share – 2022 & 2026 (%)

Fig.39 Germany Computer Vision, By Verticals Share – 2022 & 2026 (%)

Fig.40 France Computer Vision, By Verticals Share – 2022 & 2026 (%)

Fig.41 Italy Computer Vision, By Verticals Share – 2022 & 2026 (%)

Fig.42 Netherlands Computer Vision, By Verticals Share – 2022 & 2026 (%)

Fig.43 Rest of Western Europe Computer Vision, By Verticals Share – 2022 & 2026 (%)

Fig.44 Central & Eastern Europe Computer Vision Market Snapshot

Fig.45 Central & Eastern Europe Computer Vision, By Verticals Share – 2022 & 2026 (%)

Fig.46 Asia Pacific Computer Vision Market Snapshot

Fig.47 Asia Pacific Computer Vision, By Verticals Share – 2022 & 2026 (%)

Fig.48 China Computer Vision, By Verticals Share – 2022 & 2026 (%)

Fig.49 India Computer Vision, By Verticals Share – 2022 & 2026 (%)

Fig.50 Japan Computer Vision, By Verticals Share – 2022 & 2026 (%)

Fig.51 Australia Computer Vision, By Verticals Share – 2022 & 2026 (%)

Fig.52 South Korea Computer Vision, By Verticals Share – 2022 & 2026 (%)

Fig.53 Rest of Asia Pacific Computer Vision, By Verticals Share – 2022 & 2026 (%)

Fig.54 South & Central America Computer Vision Market Snapshot

Fig.55 South & Central America Computer Vision, By Verticals Share – 2022 & 2026 (%)

Fig.56 Brazil Computer Vision, By Verticals Share – 2022 & 2026 (%)

Fig.57 Argentina Computer Vision, By Verticals Share – 2022 & 2026 (%)

Fig.58 Rest of South & Central America Computer Vision, By Verticals Share – 2022 & 2026 (%)

Fig.59 Middle East & Africa Computer Vision Market Snapshot

Fig.60 Middle East & Africa Computer Vision, By Verticals Share – 2022 & 2026 (%)

Fig.61 Saudi Arabia Computer Vision, By Verticals Share – 2022 & 2026 (%)

Fig.62 South Africa Computer Vision, By Verticals Share – 2022 & 2026 (%)

Fig.63 UAE Computer Vision Verticals Share – 2022 & 2026 (%)

Fig.64 Rest of Middle East & Africa Computer Vision, Verticals Share – 2022 & 2026 (%)

Fig.65 Computer Vision – Growth-Innovation Matrix

Fig.66 Information Procurement

Fig.67 Data Analysis Model

Fig.68 ICT Survey Process

Fig.69 Research Methodology

Fig.70 Market Definitions

Fig.71 GlobalData Proposition and Product Capabilities

Fig.72 GlobalData Sector Coverage

Fig.73 Supporting Critical Decision Making at the Largest & Most Successful Companies

Frequently asked questions

  • What was the computer vision market size in 2023?

    The computer vision market size globally will be valued at $17.7 billion in 2023.

  • What is the computer vision market growth rate?

    The computer vision market is expected to grow at a CAGR of 19.6% during the forecast period (2023-2026).

  • What are the key computer vision market drivers?

    The increasing number of use cases across diverse sectors and the growing need for automation of business workflows are anticipated to drive computer vision market growth.

  • What are the key computer vision market segments?

    Vertical Segments: IT & Telecom, BFSI, Healthcare, Government, Retail, Manufacturing, Energy & Utilities, and Others.

  • Which are the leading computer vision companies?

    The leading companies in the computer vision market are Microsoft Corp, Alphabet Inc, IBM, Intel, Ambarella, Apple Inc, Amazon.com Inc, Hikvision, and Bosch.

  • Is there a third level of segmentation in the report?

    GlobalData’s focus is on providing reliable and accurate data that is supported by robust research methodology. Our reports undergo rigorous quality checks and are based on primary and secondary research sources, ensuring that the numbers and insights provided are trustworthy.  However, despite the best efforts to gather comprehensive data, there could be instances where the available data is limited, making it challenging to provide third level segmentation. In such cases, GlobalData may choose to provide high-level insights and general trends rather than forcing segmentation that may not be backed by sufficient data. This approach ensures that the report’s overall quality and credibility are maintained.

Currency USD
$3,950

Can be used by individual purchaser only

$7,950

Can be shared globally by unlimited users within the purchasing corporation e.g. all employees of a single company


Undecided about purchasing this report?

Enquire Before Buying Request a Free Sample

Get in touch to find out about multi-purchase discounts

reportstore@globaldata.com
Tel +44 20 7947 2745

Every customer’s requirement is unique. With over 220,000 construction projects tracked, we can create a tailored dataset for you based on the types of projects you are looking for. Please get in touch with your specific requirements and we can send you a quote.

Sample Report

We are confident about Computer Vision Market Size, Share, Trends and Analysis by Region, Industry Vertical and Segment Forecasts to 2026 report's unique quality. However, we want you to make the most beneficial decision for your business, so we offer free sample pages to help you:

  • Assess the relevance of the report
  • Evaluate the quality of the report
  • Justify the cost

Download your copy of the sample report and make an informed decision about whether the full report will provide you with the insights and information you need.

Below is a sample report to understand what you are buying

See what our customers are saying

“The GlobalData platform is our go-to tool for intelligence services. GlobalData provides an easy way to access comprehensive intelligence data around multiple sectors, which essentially makes it a one-for-all intelligence platform, for tendering and approaching customers.

GlobalData is very customer orientated, with a high degree of personalised services, which benefits everyday use. The highly detailed project intelligence and forecast reports can be utilised across multiple departments and workflow scopes, from operational to strategic level, and often support strategic decisions. GlobalData Analytics and visualisation solutions has contributed positively when preparing management presentations and strategic papers.”

Business Intelligence & Marketing Manager, SAL Heavy Lift

“COVID-19 has caused significant interference to our business and the COVID-19 intelligence from GlobalData has helped us reach better decisions around strategy. These two highlights have helped enormously to understand the projections into the future concerning our business units, we also utilise the project database to source new projects for Liebherr-Werk to use as an additional source to pitch for new business.”

Market Analyst & Management, Liebherr-Werk

Your daily news has saved me a lot of time and keeps me up-to-date with what is happening in the market, I like that you almost always have a link to the source origin. We also use your market data in our Strategic Business Process to support our business decisions. By having everything in one place on the Intelligence Center it has saved me a lot of time versus looking on different sources, the alert function also helps with this.

Head of Key Accounts, Saab AB

Having used several other market research companies, I find that GlobalData manages to provide that ‘difficult-to-get’ market data that others can’t, as well as very diverse and complete consumer surveys.

Marketing Intelligence Manager, Portugal Foods

Our experience with GlobalData has been very good, from the platform itself to the people. I find that the analysts and the account team have a high level of customer focus and responsiveness and therefore I can always rely on. The platform is more holistic than other providers. It is convenient and almost like a one stop shop. The pricing suite is highly competitive and value for our organisation.

I like reports that inform new segments such as the analysis on generation Z, millennials, the impact of COVID 19 to our banking customers and their new channel habits. Secondly the specialist insight on affluent sector significantly increases our understanding about this group of customers. The combination of those give us depth and breadth of the evolving market.

I’m in the business of answering and helping people make decisions so with the intelligence center I can do that, effectively and efficiently. I can share quickly key insights that answer and satisfy our country stakeholders by giving them many quality studies and primary research about competitive landscape beyond the outlook of our bank. It helps me be seen as an advisory partner and that makes a big difference. A big benefit of our subscription is that no one holds the whole data and because it allows so many people, so many different parts of our organisation have access, it enables all teams to have the same level of knowledge and decision support.

Head of Customer Insight and Research, Standard Chartered

“I know that I can always rely on Globaldata’s work when I’m searching for the right consumer and market insights. I use Globaldata insights to understand the changing market & consumer landscape and help create better taste & wellbeing solutions for our customers in food, beverage and healthcare industries.

Globaldata has the right data and the reports are of very high quality compared to your competitors. Globaldata not only has overall market sizes & consumer insights on food & beverages but also provides insights at the ingredient & flavour level. That is key for B2B companies like Givaudan. This way we understand our customers’ business and also gain insight to our unique industry”

Head of Consumer Sensory Insights, Givaudan

GlobalData provides a great range of information and reports on various sectors that is highly relevant, timely, easy to access and utilise.  The reports and data dashboards help engagement with clients; they provide valuable industry and market insights that can enrich client conversations and can help in the shaping of value propositions. Moreover, using GlobalData products has helped increase my knowledge of the finance sector, the players within it, and the general threats and opportunities.

I find the consumer surveys that are carried out to be extremely beneficial and not something I have seen anywhere else. They provided an insightful view of why and which consumers take (or don’t) particular financial products. This can help shape conversations with clients to ensure they make the right strategic decisions for their business.

One of the challenges I have found is that data in the payments space is often piecemeal. With GD all of the data I need is in one place, but it also comes with additional market reports that provide useful extra context and information. Having the ability to set-up alerts on relevant movements in the industry, be it competitors or customers, and have them emailed directly to me, ensures I get early sight of industry activity and don’t have to search for news.

Senior Account Manager, TSYS
Go even deeper with GlobalData Intelligence Center

Every Company Report we produce is powered by the GlobalData Intelligence Center.

Subscribing to our intelligence platform means you can monitor developments at Computer Vision Market Size, Share, Trends and Analysis by Region, Industry Vertical and Segment Forecasts to 2026 in real time.

  • Access a live Computer Vision Market Size, Share, Trends and Analysis by Region, Industry Vertical and Segment Forecasts to 2026 dashboard for 12 months, with up-to-the-minute insights.
  • Fuel your decision making with real-time deal coverage and media activity.
  • Turn insights on financials, deals, products and pipelines into powerful agents of commercial advantage.