Edge Computing Market Size, Trends and Analysis by IT Infrastructure, Vertical, Employee Size Band, Region and Segment Forecast to 2027
Powered by ![]()
Access in-depth insight and stay ahead of the market

Accessing the in-depth insights from the ‘Edge Computing’ report can help:
- Understand the current and future state of the market, allowing businesses to make informed decisions about market entry, product development, and
- Identify competitors’ capabilities to stay ahead in the market.
- Identify segments and know the stakeholders across different stages of the value
- Anticipate changes in demand and adjust the business development strategies
- Identify potential regions and countries for growth
How is our ‘Edge Computing’ report different from other reports in the market?
- The report presents in-depth historical and forecast period data (2019-2027) for more than 28 countries.
- Detailed segmentation by:
- IT Infrastructure – Hardware (Device Edge, Edge Data Centers, Edge Gateway Hardware, Enterprise Edge Hardware, Telco Edge Solutions), Software (Edge Aggregation & Orchestration, Edge Software (Others), Edge Software/Platforms), Services (Edge Integration Services, IoT Edge/Edge Gateways Connectivity, Managed Edge Services)
- Vertical – BFSI, Manufacturing, Information Technology, Retail, Government, Others
- Employee Size Band – Micro (Less than 50), Small (51-250), Medium (251-1,000), Large (1,001-4,999), Very Large (5,000+)
- Region – North America, Western Europe, Central & Eastern Europe, Asia-Pacific, South & Central America, and Middle East & Africa
- The report covers key market drivers and challenges impacting the edge computing market.
- The report also covers mergers & acquisitions (M&A) analysis, venture financing analysis, patent activity analysis, social media analytics, and Porter’s analysis
- The competitive landscape includes edge computing leaders and challengers and deals by geography that will help the stakeholders in the ongoing process of identifying, researching, and evaluating competitors, to gain insight to form their business strategies.
- The report can be a valuable tool for stakeholders to improve their operations, increase customer satisfaction, and maximize profitability by analyzing the latest edge computing trends, tracking market growth and demand, and evaluating the existing competition in the market.
We recommend this valuable source of information to:
- Companies offering edge computing services/solutions
- Consulting & Professional Services Firms
- Venture Capital/Equity Firms
Edge Computing Report Overview
The edge computing market was valued at $14.1 billion in 2023 and will grow at a compound annual growth rate (CAGR) of 23.4% over the forecast period. The key factors driving market growth include the rising demand for low-latency processing, the proliferation of IoT devices generating massive data, and the need for real-time insights.
When it comes to IoT, AI, and autonomous car applications, edge computing is known for its capacity to process data closer to its source, lowering latency and increasing efficiency. Employing this technology enables businesses to significantly reduce operating costs associated with cloud computing, storage, and data transmission. The main industries using edge computing to improve operations and decision-making are healthcare, manufacturing, and retail.
Edge Computing Market Outlook, 2019 – 2027 ($ Billion)
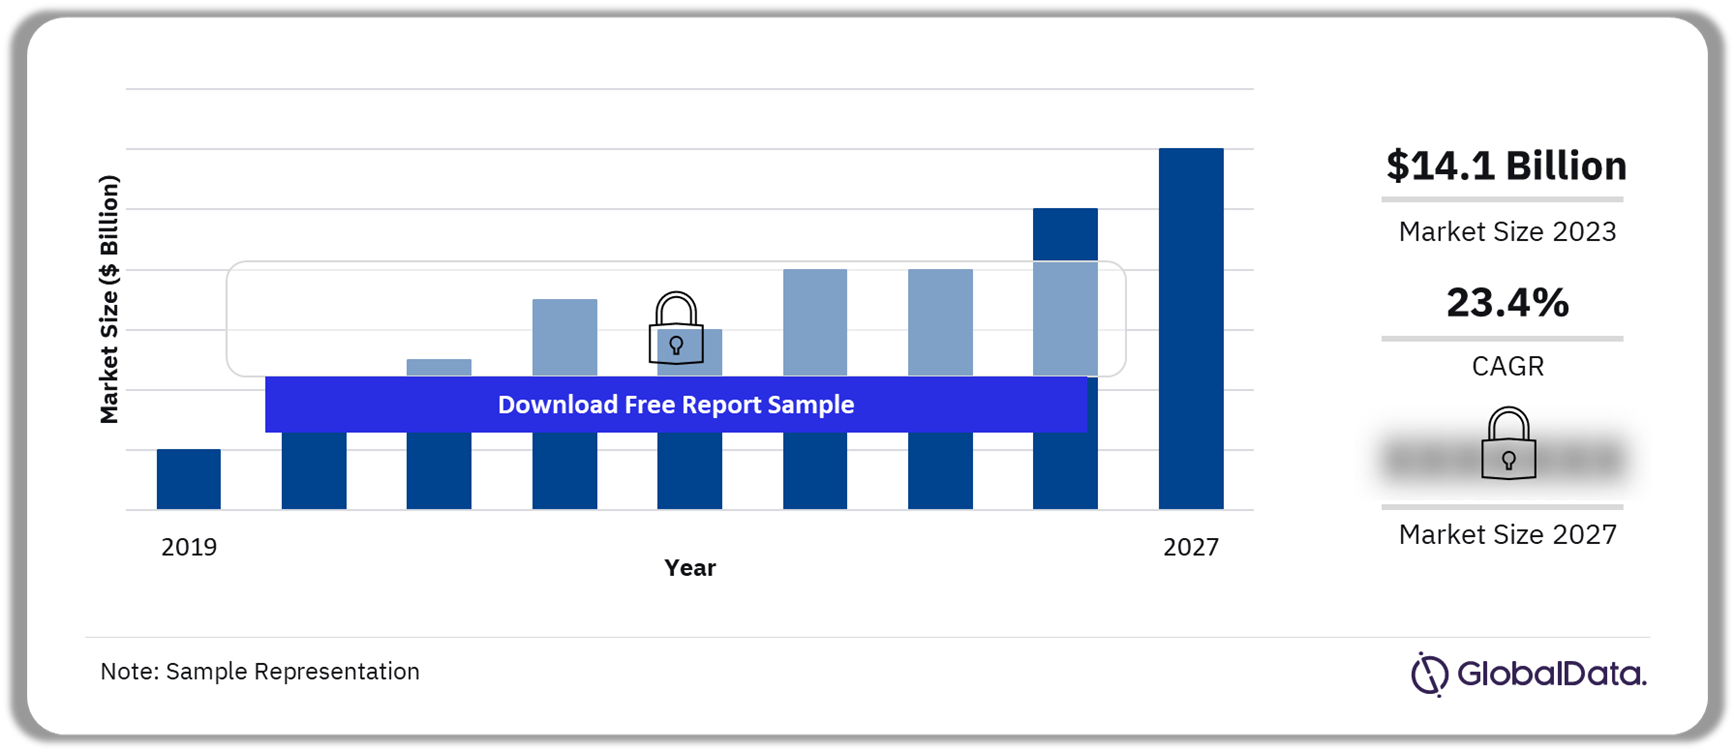
Buy the Full Report for Additional Insights on the Market Size Projections, Download a Free Sample
The expansion of 5G networks serves as one of the significant market drivers, revolutionizing various industries with its high-speed, low-latency capabilities. This advancement enables businesses to leverage this technology, which complements 5G by processing data closer to where it’s generated. Use cases demanding ultra-low latency, like AR/VR training, real-time drone fleet management, and autonomous control of robots and vehicles, necessitate edge processing at customer premises and distributed micro data centers at the edge of mobile networks.
The proliferation of IoT devices drives the edge computing market’s growth as IoT generates immense amounts of data that require fast, efficient processing. By processing data locally, edge computing lowers latency and facilitates real-time decision-making. Applications including self-driving cars, industrial automation, and smart cities are supported by this strategy.
| Market Size (2023) | $14.1 billion |
| CAGR (2022-2027) | 23.4% |
| Forecast Period | 2022-2027 |
| Historical Period | 2019-2021 |
| Report Scope & Coverage | · Industry Overview
· Market Dynamics · Revenue Forecast · Regional Analysis · Competitive Landscape · Company Profiles |
| IT Infrastructure | · Hardware (Device Edge, Edge Data Centers, Edge Gateway Hardware, Enterprise Edge Hardware, Telco Edge Solutions)
· Software (Edge Aggregation & Orchestration, Edge Software (Others)Edge Software/Platforms) · Services (Edge Integration Services · IoT Edge/Edge Gateways Connectivity Managed Edge Services) |
| Vertical | · BFSI
· Manufacturing · Information Technology · Retail, Government · Others |
| Employee Size Band | · Micro (Less than 50)
· Small (51-250) · Medium (251-1,000) · Large (1,001-4,999) · Very Large (5,000+) |
| Regional Segment | · North America
· Western Europe · Central & Eastern Europe · Asia-Pacific · South & Central America · Middle East & Africa |
| Key Companies | · Microsoft Corp
· IBM, HPE, Dell · Cisco Systems Inc · Amazon.com Inc · Lenovo Group Ltd · Inspur Software Co Ltd · Intel Corp · Huawei Technologies Co. Ltd · NVIDIA Corp |
Edge Computing IT Infrastructure Insights
Based on IT infrastructure, the edge computing market has been segmented into hardware, software, and services. In 2023, the hardware segment held the largest market share and is projected to exhibit the most substantial compound annual growth rate (CAGR) throughout the forecast period. The industry is driven by an increase in demand for edge computing products/solutions that offer benefits such as improved performance, low latency, cost savings, real-time data processing, and others.
Edge Computing Market Share, By IT Infrastructure, 2023 (%)
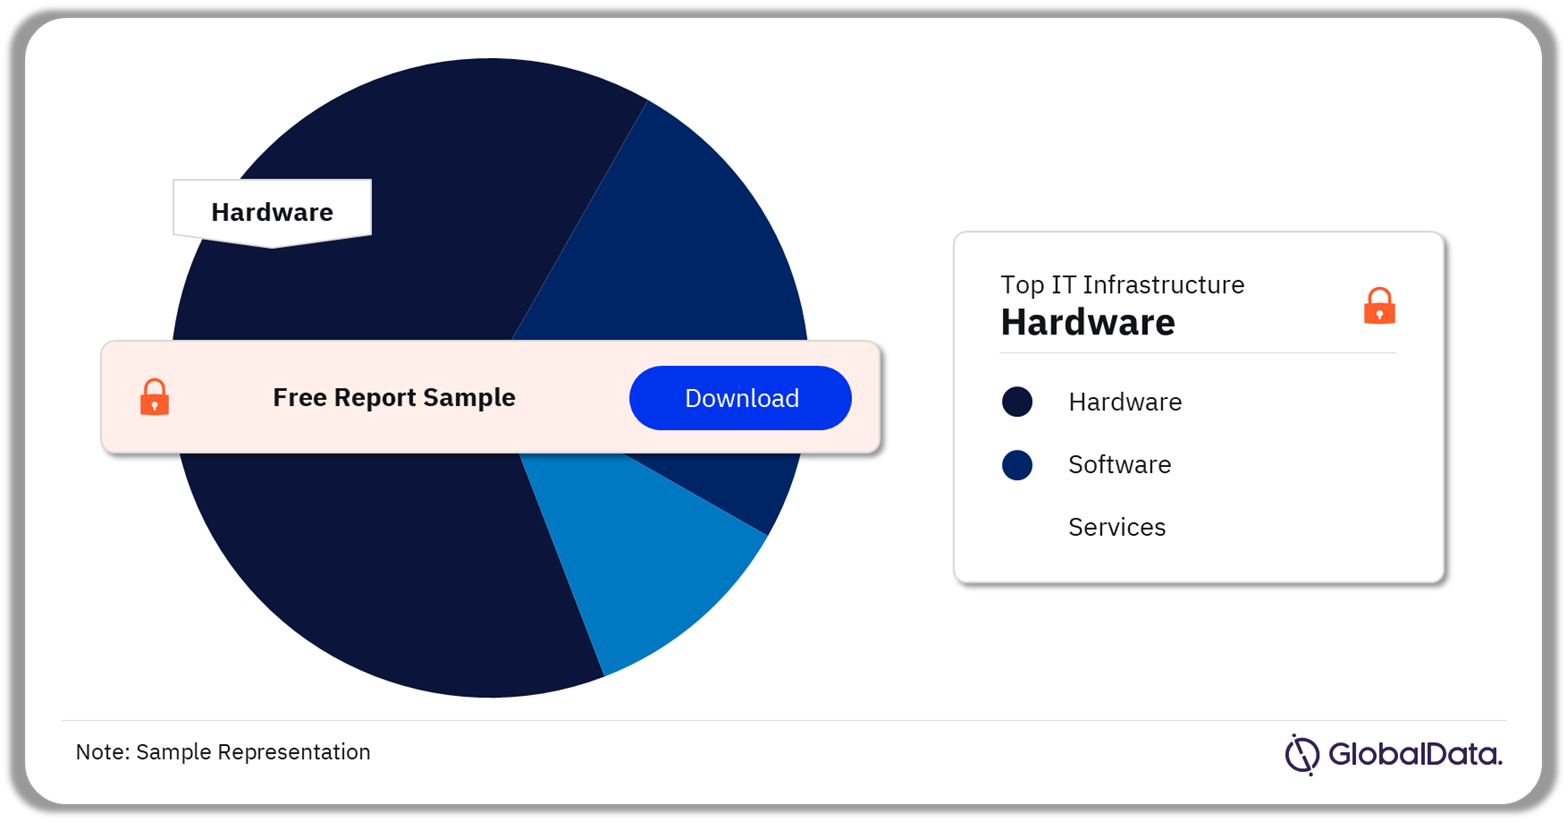
Buy the Full Report for More Segment Insights into the Edge Computing Market, Download a Free Sample
As edge computing applications proliferate across various industries, the need for specialized hardware to power these solutions naturally rises. This includes devices at the edge, data centers at the edge, gateways for data aggregation, and hardware tailored for specific enterprise and telco needs. Edge hardware plays a crucial role in securing sensitive data collected and processed at the edge. This drives demand for hardware with robust security features such as encryption and secure boot capabilities.
Edge Computing Market Segmentation by Hardware
The hardware market has been segmented into telco edge solutions, data centers, edge gateway hardware, enterprise edge hardware, and device edge. The enterprise edge hardware segment will be the fastest-growing segment over the forecast period. This rapid growth can be attributed to several factors, such as increasing demand from enterprises for more robust and scalable edge computing solutions. Businesses that want to increase their productivity and flexibility are looking to edge hardware. This can support the processing power needed for AI and real-time analytics applications.
Additionally, the proliferation of Internet of Things (IoT) devices in various industries is driving the need for edge hardware that can manage and process the massive amounts of data generated at the edge of networks. With the rise of remote work and distributed teams, enterprises are investing in edge hardware. This ensures seamless connectivity and secure access to resources for employees, regardless of their location. These trends are driving rapid growth in the enterprise edge hardware segment as businesses aim to modernize their infrastructure and remain competitive in the digital era.
Edge Computing Market Share, By Hardware, 2023 (%)
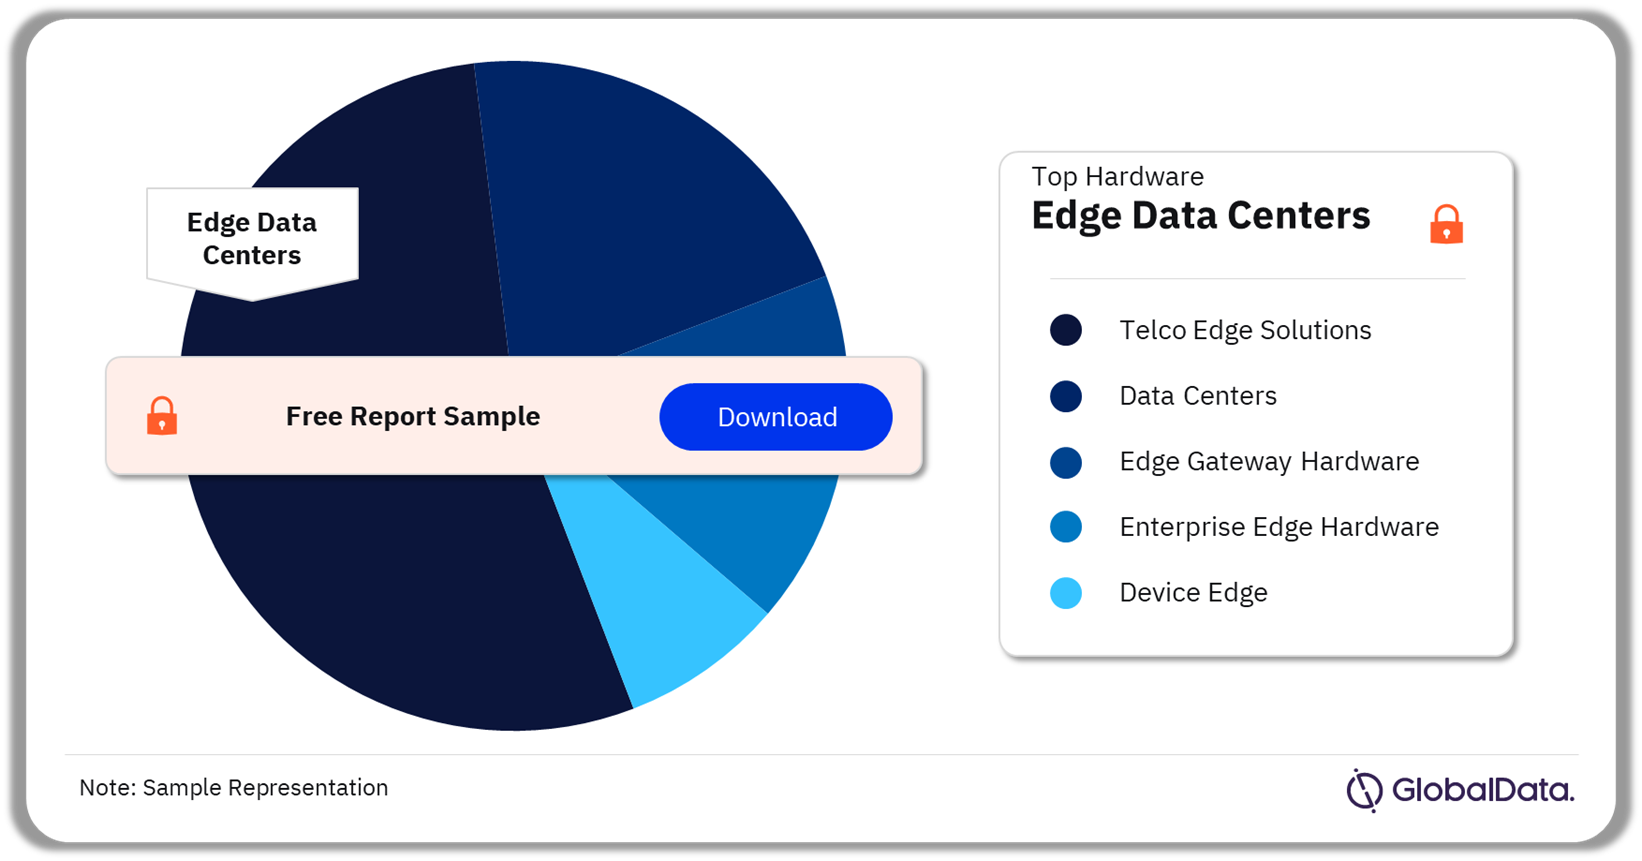
Buy the Full Report for More Segment Insights into the Edge Computing Market, Download a Free Sample
Edge Computing Market Segmentation by Software
The software market is segmented into edge software (others), edge software/platforms, and edge aggregation & orchestration. Among these, the edge software (others) segment is anticipated to grow at the fastest pace over the forecast timeframe. The edge software (others) is expected to register CAGR of 25.5% in terms of revenue over the estimated period. This category encompasses critical offerings such as analytics and API software, operating systems, edge security application software, and more, all essential for the operation of edge networks and requiring ongoing development.
The edge software/platforms segment is expected to follow the edge software (others) segment in growth over the forecast period. This growth is primarily driven by applications such as industrial IoT, Industry 4.0, and other digital initiatives. The proliferation of IoT devices and connected devices across various sectors has led to a substantial increase in data volume.
Edge Computing Market Share, By Software, 2023 (%)
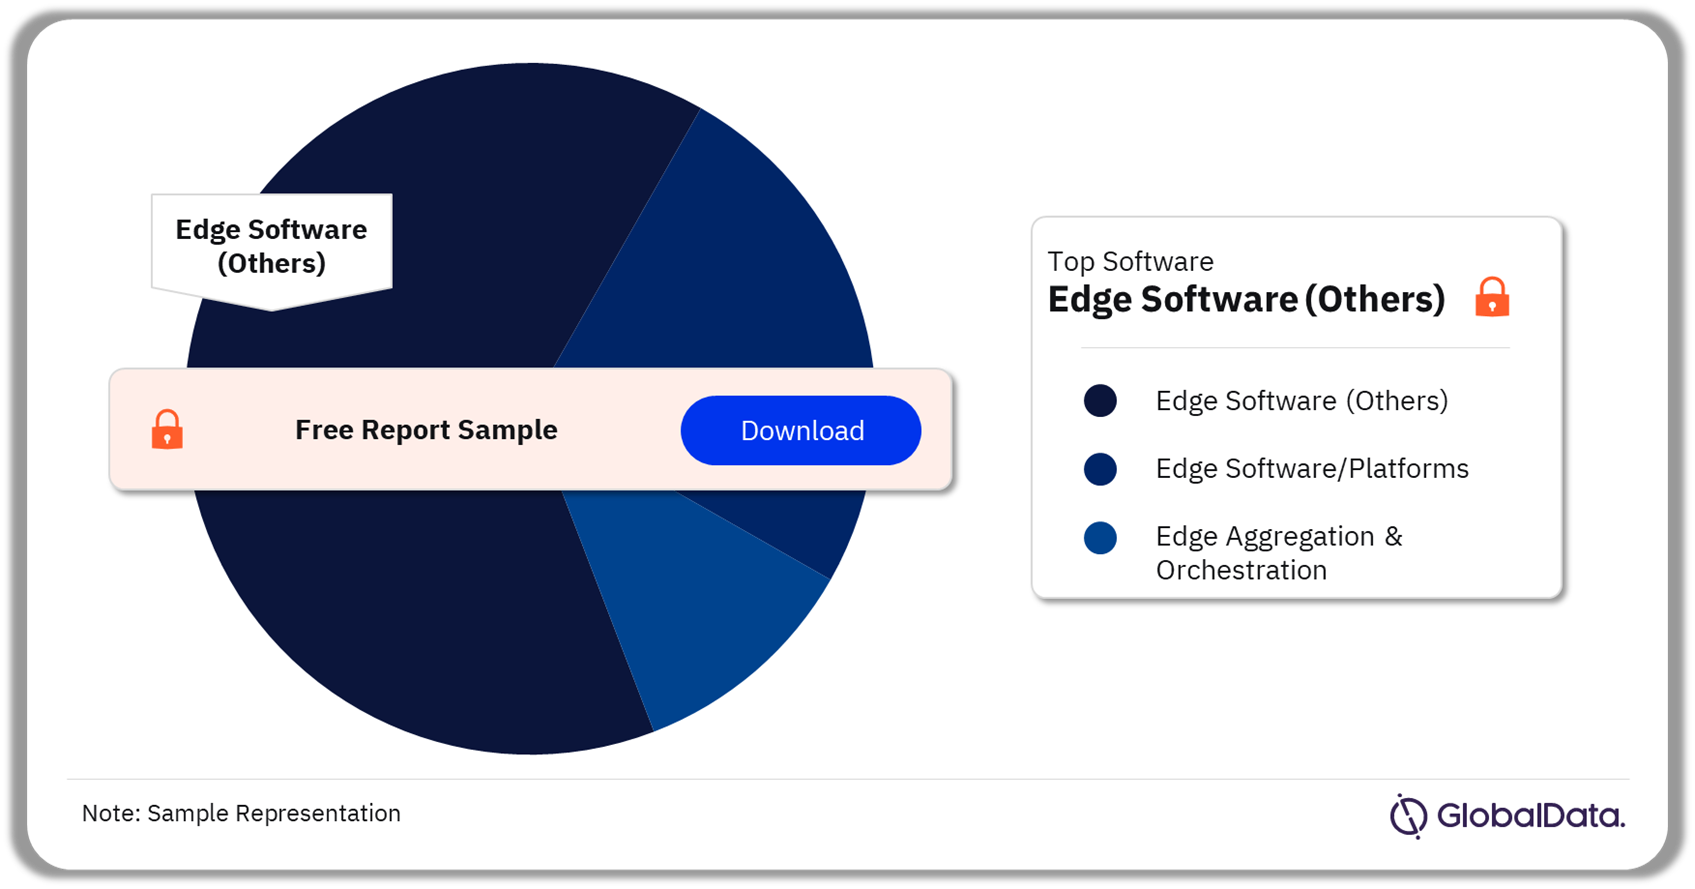
Buy the Full Report for More Segment Insights into the Edge Computing Market, Download a Free Sample
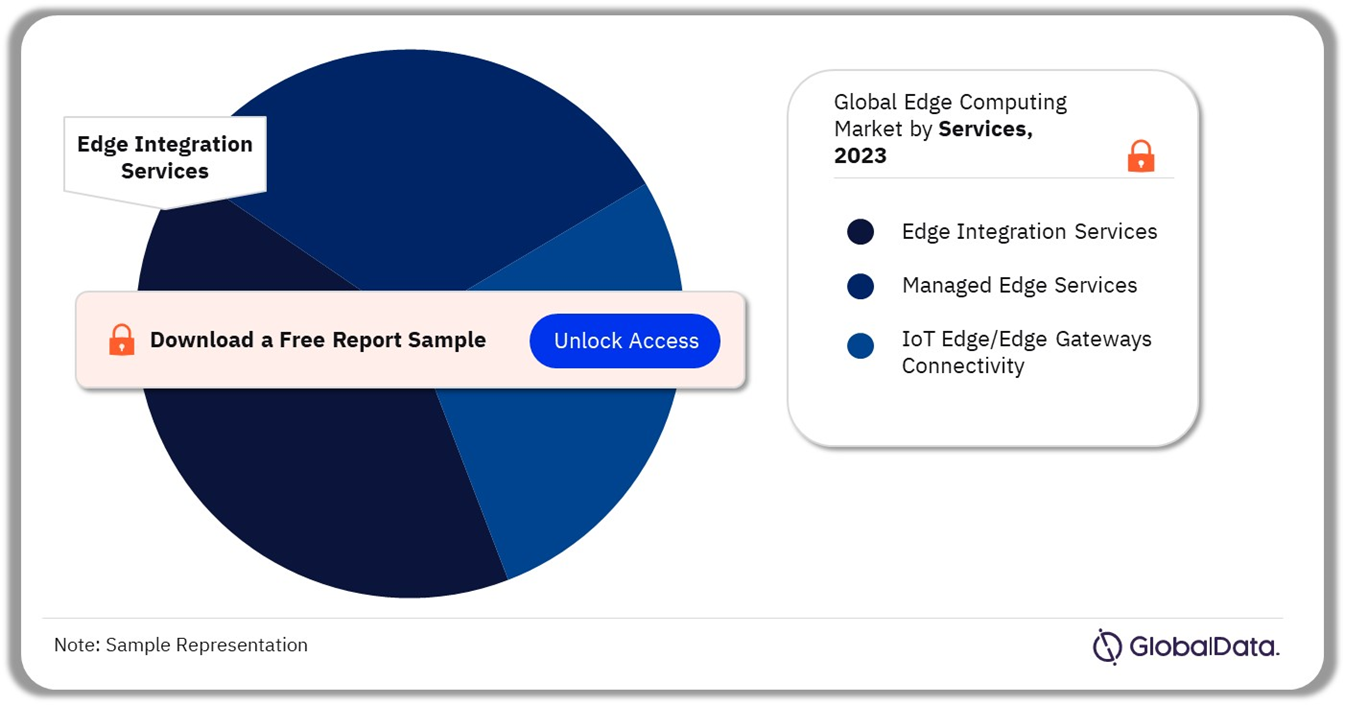
Edge Computing Market Segmentation by Services
The services market has been segmented into managed edge services, edge integration services, and IoT edge/edge gateways connectivity. Edge integration services was the largest segment in 2023. Growing adoption of edge computing across industries drives demand for integration services, which streamline complex setups involving diverse devices. These services facilitate seamless integration with existing IT systems, offer customization for unique needs, and address crucial security and compliance challenges.
Among the services category, IoT Edge/Edge Gateways Connectivity is the fastest growing segment due to the increasing adoption of industrial IoT, Industry 4.0, and other digital initiatives. Data processing at the edge must become more effective due to the proliferation of IoT devices and connected devices in different industries. Edge software facilitates this data’s handling, analysis, and processing at the edge, guaranteeing its timely and effective use.
Edge Computing Market Share, By Services, 2023 (%)
 Buy the Full Report for Additional Insights into the Market Size Projections, Download a Free Sample
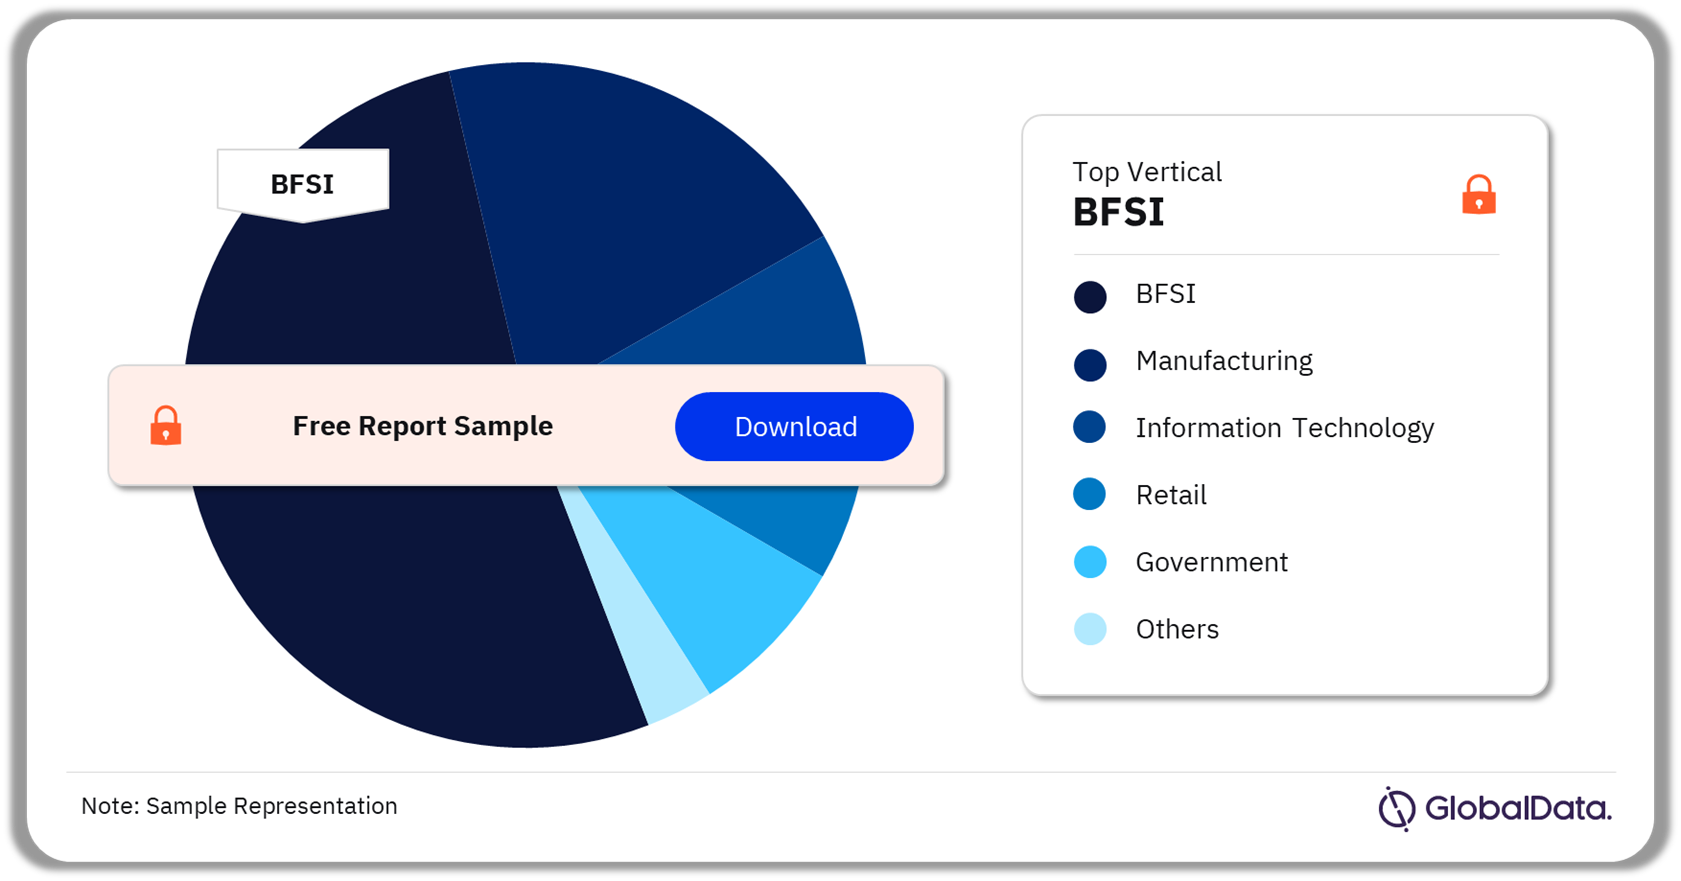
Edge Computing Vertical Insights
Based on vertical, the edge computing market has been segmented into BFSI, manufacturing, information technology, retail, government, and others. In 2023, the information technology segment was projected to exhibit the most substantial compound annual growth rate (CAGR) throughout the forecast period. This rapid growth is driven by its ability to meet the demands of modern data processing, real-time analytics, AI integration, enhanced security, and scalable connectivity.
The BFSI industry is transforming its digital infrastructure to provide customers with banking and financial services that are both personalized and highly secure. The adoption of edge computing in the BFSI industry offers numerous benefits, from improved speed and security to enhanced customer experiences and cost savings. Moreover, banks will be able to proactively take further steps to prevent fraud by deploying AI-powered analytics at the edge for identifying fraudulent patterns.
Edge Computing Market Share, By Vertical, 2023 (%)
Buy The Full Report for Segment-Specific Revenues and Shares, Download a Free Sample
Edge Computing Employee Size Band Insights
Based on employee size, the edge computing market has been segmented into very large, large, medium, small, and micro. The micro segment will grow at a faster growth rate during the forecast period. This growth is driven by the rising adoption among micro companies looking for cost-effective and scalable solutions for data processing and analytics at the edge.
The very large segment, comprising enterprises with over 5,000 employees, holds largest market share and is expected to maintain its dominance throughout the forecast period. This segment’s growth is driven by the rapid digital revolution in business operations and the substantial financial resources available for transforming network infrastructure, which will modernize business functions effectively.
Edge Computing Market Share, By Employee Size Band, 2023 (%)

Buy the Full Report for Additional Insights on the Market Size Projections, Download a Free Sample
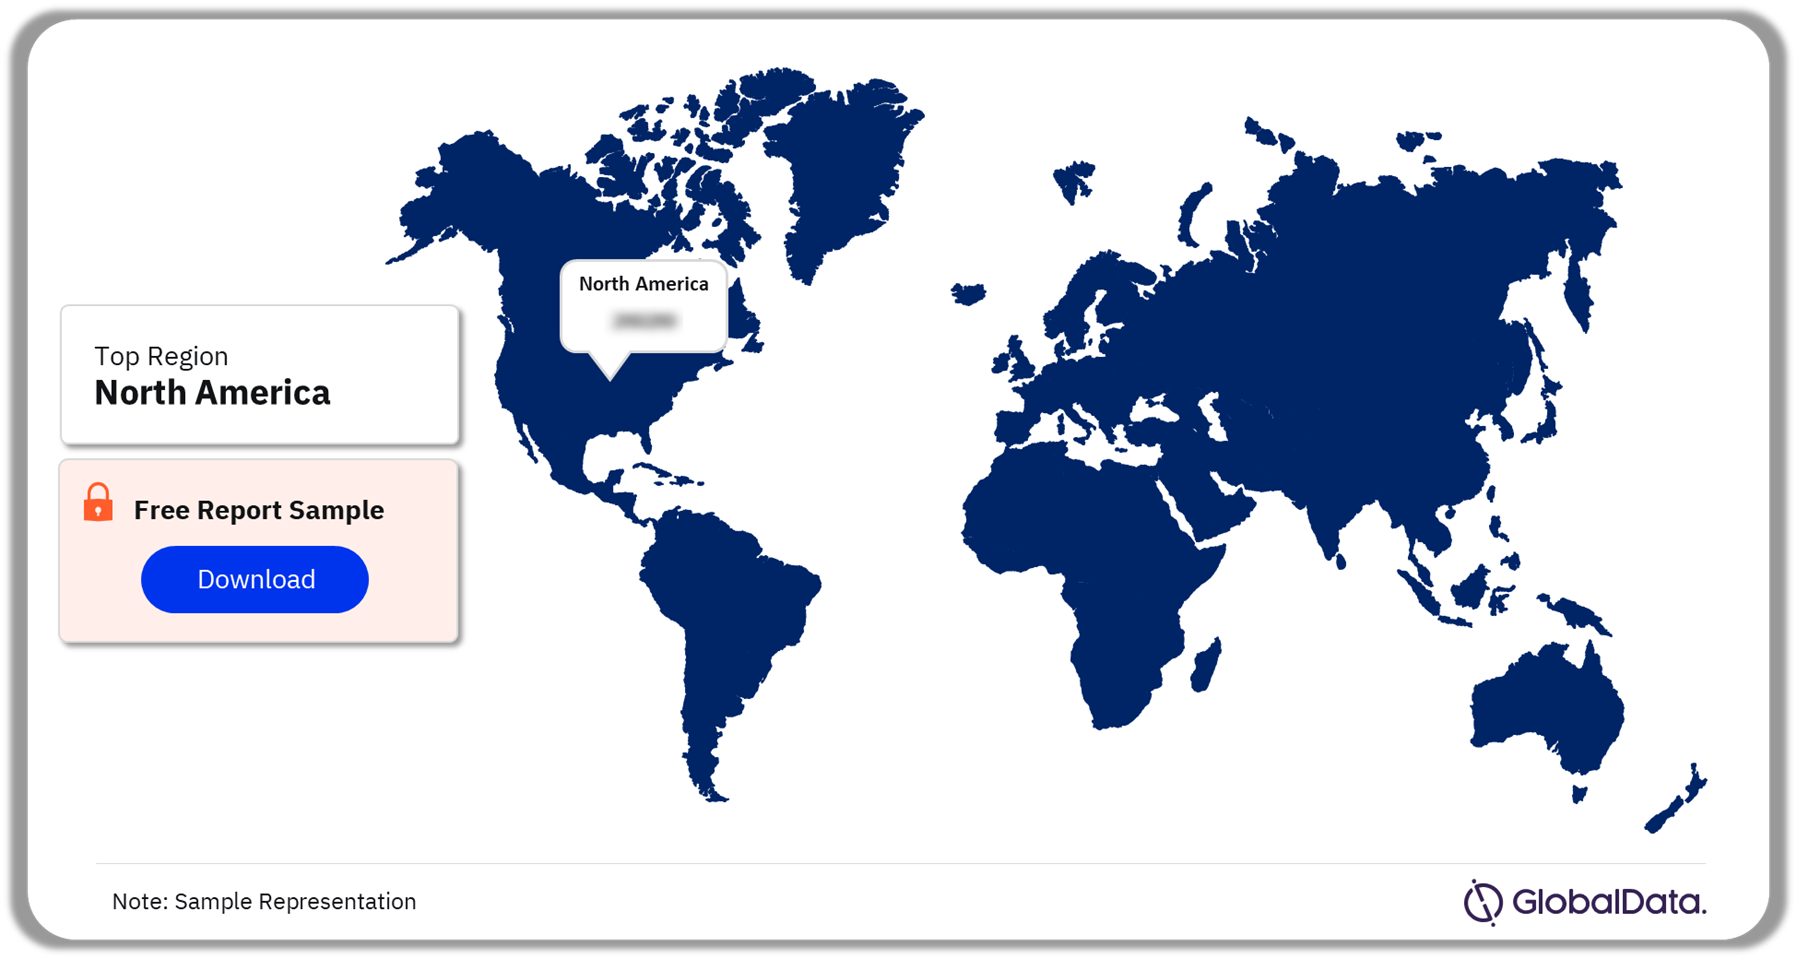
Edge Computing Regional Insights
North America is leading the market in 2023 and will increase at a compound annual growth rate over the forecast period (2022-2027). The deployment of 5G networks in North America is a significant driver for edge computing growth. Telecom companies such as Verizon, AT&T, and T-Mobile are actively expanding their 5G coverage, enabling faster data processing at the edge. Major contributors to this industry include the US and Canada, with the US dominating the market in terms of value.
Asia-Pacific region holds the second position in the edge computing market in terms of revenue share in 2023. The region is projected to witness rapid growth at a CAGR of 27.5% over the forecast period from 2022 to 2027. This technology is becoming the primary platform for deploying applications in the Asia-Pacific, profoundly impacting business development in the region and reshaping its market landscape. Asia-Pacific’s multi-cloud platform development may be attributed to the skilled computer engineering workforce. Additionally, the use of IoT, artificial intelligence, and the adoption of 5G is fostering the development of multi-clouding platforms in the region.
Edge Computing Market Share, By Region, 2023 (%)
Buy the Full Report for More Segment-Specific Revenues and Shares, Download a Free Sample
The edge computing market in China has witnessed substantial growth and transformation in recent years. China’s edge computing market continues to experience strong growth. This is driven by several factors, including: Increasing digital transformation initiatives Widespread adoption of emerging technologies Government support for technological advancements. The extensive deployment of 5G networks in China has been identified as the critical facilitator for edge computing. For instance, Huawei’s CloudEdge offers edge computing capabilities for smart factories, optimizing production processes and enhancing efficiency.
Edge Computing Vendor Insights
The global edge computing market is dynamic and competitive within the technology industry. It comprises a wide range of products and services. These offerings aim to provide a flexible and scalable approach to delivering edge services over the internet.
IT infrastructure vendors such as Dell Technologies, HPE, Lenovo, Cisco, Inspur Information, and IBM are focusing on edge computing opportunities in data centers, offering solutions such as dedicated edge servers, HCI appliances, micro data centers, and edge management software.
Telecom infrastructure vendors such as Ericsson and Huawei are developing solutions to assist CSPs in leveraging edge computing architectures, especially with the transition to 5G, aiming to support specific edge computing business models. Hyperscale Edge providers such as AWS, Microsoft Azure, and Google Edge are targeting edge computing with offerings like CDNs, edge analytics, and data processing solutions, as well as local edge computing resources like AWS Local Zones and Azure Edge Zones.
Leading Companies in the Global Edge Computing Market
- Microsoft
- IBM
- HPE
- Dell
- Cisco Systems Inc
- com Inc
- Lenovo Group Ltd
- Inspur Software Co Ltd
- Intel Corp
- Huawei Technologies Co. Ltd
- NVIDIA Corp
Other Global Edge Computing Market Vendors Mentioned
Alibaba Group Holding Ltd, Oracle Corp, Accenture Plc, T-Mobile Us Inc, Verizon Communications Inc, and AT&T Inc
Edge Computing Market Segments
Global Edge Computing IT Infrastructure Outlook (Revenue, $ Million 2019-2027)
- Hardware
- Software
- Services
Global Edge Computing Hardware Segment Outlook (Revenue, $ Million 2019-2027)
- Device Edge
- Edge Data Centers
- Edge Gateway Hardware
- Enterprise Edge Hardware
- Telco Edge Solutions
Global Edge Computing Software Segment (Revenue, $ Million 2019-2027)
- Edge Aggregation & Orchestration
- Edge Software (Others)
- Edge Software/Platforms
Global Edge Computing Services Segment (Revenue, $ Million 2019-2027)
- Edge Integration Services
- IoT Edge/Edge Gateways Connectivity
- Managed Edge Services
Global Edge Computing Vertical Outlook (Revenue, $ Million 2019-2027)
- BFSI
- Manufacturing
- Information Technology
- Retail
- Government
- Others
Global Edge Computing Employee Size Band Outlook (Revenue, $ Million 2019-2027)
- Micro (Less than 50)
- Small (51-250)
- Medium (251-1,000)
- Large (1,001-4,999)
- Very Large (5,000+)
Global Edge Computing Regional Outlook (Revenue, $ Million, 2019-2027)
- North America
- US
- Canada
- Mexico
- Asia Pacific
- China
- Japan
- India
- Australia
- South Korea
- Rest of Asia Pacific
- Western Europe
- Germany
- France
- Italy
- Spain
- UK
- Rest of Western Europe
- Central & Eastern Europe
- Russia
- Turkey
- Rest of C&E Europe
- Middle East & Africa
- UAE
- Saudi Arabia
- South Africa
- Egypt
- Kuwait
- Rest of Middle East & Africa
- South & Central America
- Brazil
- Argentina
- Colombia
- Chile
- Rest of South & Central America
Scope
• This report provides overview and service addressable market for global Edge Computing market
• It identifies the key drivers and challenges impacting growth of the Edge Computing market over the next 12 to 24 months.
• It includes global market forecasts for the Edge Computing market and analysis of latest M&A deals, and Porter’s analysis.
• It covers detailed segmentation by product/service type, by IT Infrastructure, by Vertical, by Employee Size band, and regional segmentation
Key Highlights
Edge Computing market was valued at $14.1 billion in 2023 and is expected to grow at a compound annual growth rate (CAGR) of 23.4% over the forecast period. Edge computing has become a crucial architecture due to its ability to support distributed computing, placing compute and storage resources closer to the data source. This model builds on established concepts like remote offices, branch offices, data center colocation, and cloud computing, offering an efficient and effective approach to various computing tasks. The edge computing market is propelled by multiple factors, notably the expansion of 5G network, increasing adoption of Internet of Things (IoT), network modernization, and data sovereignty.
Reasons to Buy
• This market intelligence report offers a thorough, forward-looking analysis of the global Edge Computing market by product type, regional segments, and key opportunities in a concise format to help executives build proactive and profitable growth strategies.
• Accompanying GlobalData’s Forecast products, the report examines the drivers, challenges, trend analysis in the Edge Computing market.
• Detailed segmentation by IT Infrastructure- (Hardware, Software Services), by Vertical (BFSI, Manufacturing, Information Technology, Retail, Government, Others), by Employee Size Band (Micro (Less than 50), Small (51-250), Medium (251-1,000), Large (1,001-4,999), Very Large (5,000+)
• The report includes 200+ charts and tables providing in-depth analysis of the market size, forecast, and supporting factors which are tailor-made for an executive-level audience, with enhanced presentation quality.
• The report provides an easily digestible market assessment for decision-makers built around in-depth information gathered from local market players, which enables executives to quickly get up to speed with the current and emerging trends in Edge Computing markets.
• The competitive section of the report helps in identifying the flagbearers, experimenters, contenders, and specialists based on their growth and innovation performance in the Edge Computing industry which will help stakeholders analyze competition penetration.
• The broad perspective of the report, coupled with comprehensive, actionable detail, will help Edge Computing vendors and other companies succeed in the growing Edge Computing market globally.
Key Players
MicrosoftIBM
HPE
Dell
Cisco Systems Inc
Amazon.com Inc
Lenovo Group Ltd
Inspur Software Co Ltd
Intel Corp
Huawei Technologies Co. Ltd
NVIDIA Corp
Table of Contents
Table
Figures
Frequently asked questions
-
What was the global edge computing market size in 2023?
The global edge computing market size was valued at $14.1 billion in 2023.
-
What is the edge computing market growth rate?
The global edge computing market is expected to grow at a CAGR of 23.4% over the forecast period (2022-2027).
-
What is the key edge computing market driver?
5G and edge computing are highly synergistic. While 5G inherently provides better speeds, higher throughput, and lower latency than previous cellular generations, businesses can better leverage these performance gains when edge processing is added. In addition, use cases that require ultra-low latency (such as augmented reality (AR) and virtual reality (VR)-facilitated training and equipment maintenance, real-time drone fleet management, and autonomous control of robots, surgical equipment, and vehicles) require edge processing both on the customer premise and at distributed micro data centers at the edge of the mobile network. For instance, in Feb 2023, T-Mobile and AWS joined forces to merge T-Mobile’s 5G Advanced Network Solutions lineup with AWS Edge-based services and pre-integrated applications. This collaboration allows customers to easily explore, tailor, and deploy 5G edge compute solutions.
-
What are the key edge computing market segments?
IT Infrastructure segment – Hardware (Device Edge, Edge Data Centers, Edge Gateway Hardware, Enterprise Edge Hardware, Telco Edge Solutions), Software (Edge Aggregation & Orchestration, Edge Software (Others), Edge Software/Platforms), Services (Edge Integration Services, IoT Edge/Edge Gateways Connectivity, Managed Edge Services)
Vertical segment – BFSI, Manufacturing, Information Technology, Retail, Government, Others
Employee Size Band – Micro (Less than 50), Small (51-250), Medium (251-1,000), Large (1,001-4,999), Very Large (5,000+)
Regional segment – North America, Western Europe, Central & Eastern Europe, Asia-Pacific, South & Central America, and Middle East & Africa
-
Which are the leading edge computing companies globally?
The leading edge computing companies are Microsoft Corp, IBM, HPE, Dell, Cisco Systems Inc, Amazon.com Inc, Lenovo Group Ltd, Inspur Software Co Ltd, Intel Corp, Huawei Technologies Co. Ltd, NVIDIA Corp,
-
Is there a third level of segmentation in the report?
GlobalData’s focus is on providing reliable and accurate data that is supported by robust research methodology. Our reports undergo rigorous quality checks and are based on primary and secondary research sources, ensuring that the numbers and insights provided are trustworthy. However, despite the best efforts to gather comprehensive data, there could be instances where the available data is limited, making it challenging to provide third-level segmentation. In such cases, GlobalData may choose to provide high-level insights and general trends rather than forcing segmentation that may not be backed by sufficient data. This approach ensures that the report’s overall quality and credibility are maintained.
Get in touch to find out about multi-purchase discounts
reportstore@globaldata.com
Tel +44 20 7947 2745
Every customer’s requirement is unique. With over 220,000 construction projects tracked, we can create a tailored dataset for you based on the types of projects you are looking for. Please get in touch with your specific requirements and we can send you a quote.
Sample Report
We are confident about Edge Computing Market Size, Trends and Analysis by IT Infrastructure, Vertical, Employee Size Band, Region and Segment Forecast to 2027 report's unique quality. However, we want you to make the most beneficial decision for your business, so we offer free sample pages to help you:
- Assess the relevance of the report
- Evaluate the quality of the report
- Justify the cost
Download your copy of the sample report and make an informed decision about whether the full report will provide you with the insights and information you need.


Related reports
View more Edge Computing Equipment reports

