Energy Storage System (ESS) Market Size, Share, Trend Analysis and Forecast by Technology (Electromechanical, Electrochemical, and Thermal Storage), End-Use and Region to 2026

Powered by

Access in-depth insight and stay ahead of the market

Accessing the in-depth insights from the ‘Energy Storage System’ report helps to:

  • Evaluate demand estimates and forecasts across key sectors/sub-sectors covered for key regions and countries around the globe.
  • Carry out comprehensive coverage of the entire value chain and its ecosystem.
  • Get an in-depth view of supporting regulatory trends promoting the adoption of ESS.
  • Find potential growth opportunities in terms of volume (MW) and revenue ($Million).
  • Foresee shift in the energy landscape and align business strategies to capitalize on them.
  • Fetch detailed insights on technological development while highlighting the rising prominence of battery energy storage system.
  • Enlist of energy storage projects, tenders, and contracts.

How is our ‘Energy Storage System’ report different from other reports in the market?

  • The report investigates the global energy storage system sector in terms of demand based on technology, end-use, and region.
  • The study entails a summarization of key factors or variables responsible for assisting market growth in the near future.
  • Detailed segmentation by technology– Electromechanical, Electrochemical, and Thermal Storage
  • Detailed segmentation by end-use– Grid-Scale, Commercial & Industrial, and Residential
  • With more than 100+ charts and tables, the report is designed with an easy digestible qualitative content.
  • The study presents intelligence around recent mergers & acquisitions and filed patents.
  • The key market participants operating within this market and their respective profiles are laid out with dedicated sections on company overview, financials, products & services, recent developments, and deals.
  • The competitive landscape section encompasses coverage of the key players and their recent developments. In addition, this section of the study also covers case studies around the implementation of energy storage system projects.

We recommend this valuable source of information to:

  • Equipment Manufacturers
  • EPC Vendors
  • Power Generation Companies
  • Transmission & Distribution Players
  • Management Consultants and Investment Banks
  • Private Equity Players

Buy the Full Report to get a Snapshot of the Energy Storage System Market, Download a Free Report Sample

Energy Storage System Market Report Overview

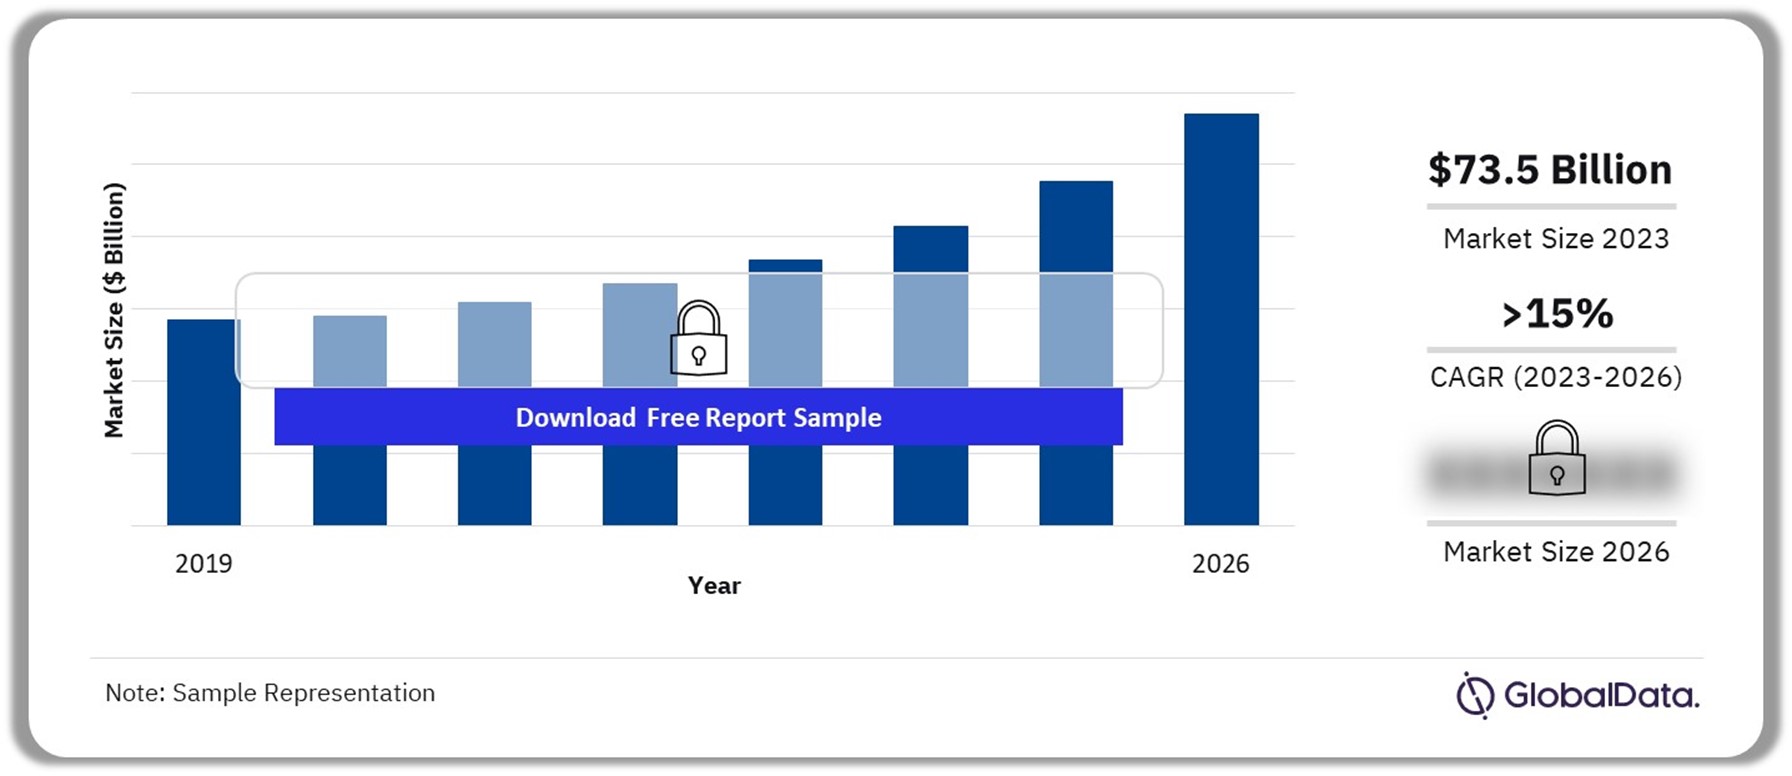
The energy storage system market size revenue was valued at $73.5 billion in 2023 and is expected to grow at a compound annual growth rate (CAGR) of more than 15% over the forecast period. The move toward the adoption of renewable energy sources is projected to pave new pathways for the development of energy storage systems over the forecast period.

Renewable energy, complemented by favorable market conditions and government policies, is being adopted on a large scale. Renewable technologies are at the center of energy sector transformations, with usage carried out along the value chain. The ESS offers the required flexibility to maintain a bridge between generation and load curves, thereby, preventing grid failures. This flexible characteristic offered by the ESS is anticipated to drive market growth over the predicted timeline.

Energy Storage System Market Outlook, 2019-2026 ($Billion)

Energy Storage System Market Outlook, 2019-2026 ($Billion)

Buy the Full Report for Additional Insights on the Energy Storage System Market Forecast

Download a Free Report Sample

The deployment of renewable power generation projects surged in the post-pandemic era supported by incentives from the governments. For instance, as per the report published by the International Renewable Energy Agency (IRENA) in July 2023, the total global renewable energy capacity jumped from approximately 2,824.9 GW in 2020 to 3,381.7 GW in 2022. These new steps towards sustainability directly promoted the adoption of energy storage systems over the mentioned timeline.

Another key event that pushed the deployment dynamics is the Russian invasion of Ukraine, particularly for the European nations. This conflict prompted the European countries to revise their existing energy storage plans and explore new productive ways to reduce dependence from fossil fuels. As per the stats released by the European Commission, the new utility-scale deployment of the storage technology in the region reached 2.8 GW in 2022 with a plan to install over 200 GW by 2030.

Similarly, in the Asia Pacific region, the installation of renewable projects picked up in the post-pandemic era with China, South Korea, and India accounting for the new additions. Among these, China planned to achieve 1,200 GW of renewable energy from solar and wind by 2030. However, the country is expected to complete this target by the end of 2024, thus becoming the largest market of ESS globally in 2023. In addition, China is expected to generate approximately 1,000 GW of solar energy alone by 2026, thereby, opening new prospects for ESS deployment over the forecast period.

Market Size (2023) $73.5 billion
CAGR (2023 to 2026) >15%
Forecast Period 2023-2026
Historic Data 2019-2022
Report Scope & Coverage Industry Overview, Volume and Revenue Forecast, Regional Analysis, Competitive Landscape, Company Profiles, Growth Trends
Technology Segment Electromechanical, Electrochemical, Thermal Storage
End-Use Segment Grid-Scale, Commercial & Utility, Residential
Regions Americas, EMEA, Asia Pacific
Countries US, Rest of Americas, Germany, UK, France, Rest of EMEA, China, India, Japan, South Korea, Australia, Rest of Asia Pacific
Key Companies GE Renewable Energy; LG Energy Solutions; SAMSUNG SDI CO.,LTD.; NGK Insulators Ltd; BYD Co Ltd; Saft; Amber Kinetics, Inc.; Voith GmbH & Co. KGaA; Contemporary Amperex Technology Ltd; and CALMAC
Enquire & Decide Discover the perfect solution for your business needs. Enquire now and let us help you make an informed decision before making a purchase.

Energy Storage System Segmentation by Technology

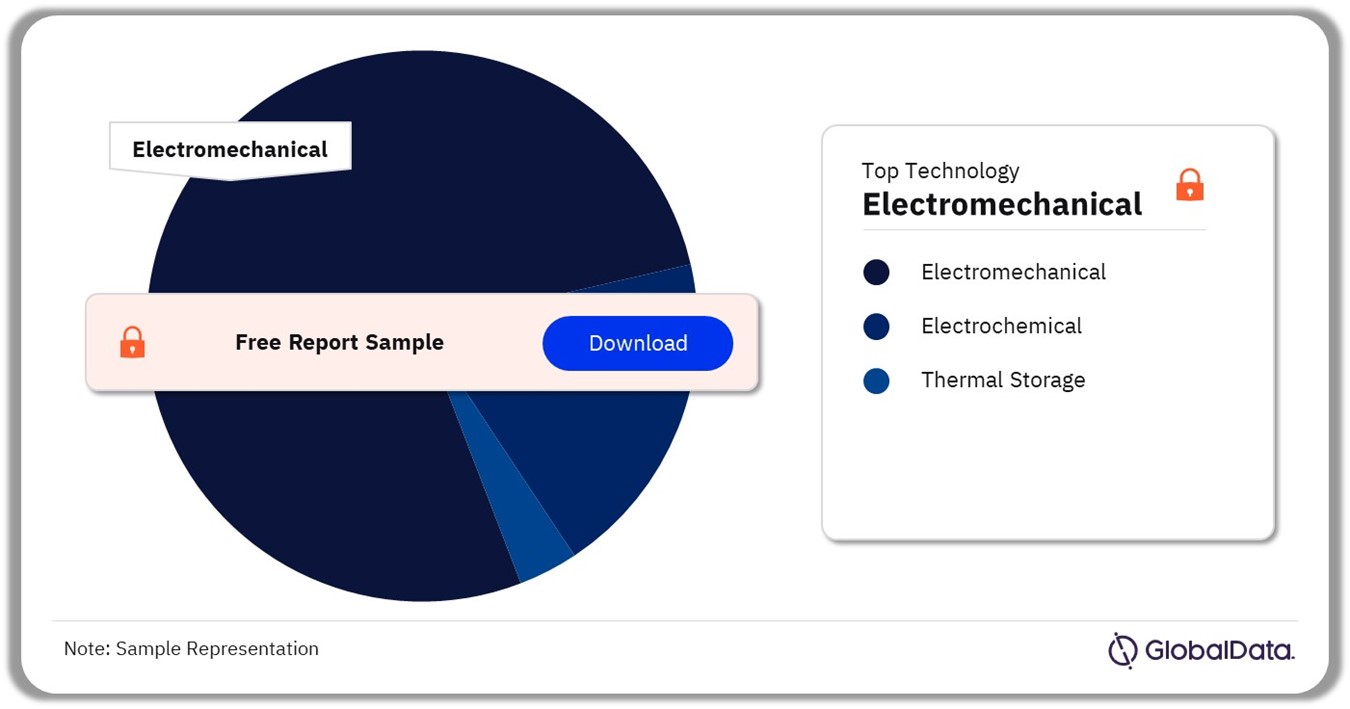
Within segmentation by technology, electromechanical is projected to remain a dominant category over the forecast period. The electromechanical segment covers pumped hydro storage (PHS), flywheel energy storage (FES), and compressed air energy storage (CAES). The prominence of pumped hydro storage is estimated to continue over the predicted timeline owing to the system’s capability to provide a competitive and reliable manner of electricity storage. The PHS ability to control and distribute additional load while providing reduced energy loss and high efficiency makes it the most preferred electromechanical technology as compared to its counterparts.

Despite, the domination of electromechanical technology, the highest market growth will be captured by electrochemical technology over the forecast period. The rising popularity of electrochemical technology or battery energy storage systems (BESS) is estimated to generate new avenues for its deployment. The electrochemical technology is widely preferred in remote areas where there is a limited option to capture solar energy and wind energy. This technology system provides ease of access and further can be easily integrated with generators, solar rooftops, and small wind turbines. Owing to these aforementioned advantages, the electrochemical technology segment is projected to flourish over the predicted timeline.

The deployment dynamics of the electrochemical technology are expected to improve further with the upgradation of battery capacity and reducing cost. The lowering of prices and continued research and development for improving technology standards are expected to boost the commercialization of various BESS technologies and deployment on a large scale. The BESS market will likely grow exponentially in line with renewable expansion and increasing demand for self-consumption and uninterruptible power supply.

Energy Storage System Market Analysis by Technology, 2023 (%)

Energy Storage System Market Analysis by Technology, 2023 (%)

Buy the Full Report for More Information on Energy Storage System Market Technology
Download a Free Report Sample

The third technology category of thermal storage is predicted to remain the slowest-growing segment over the forecast period. The primary reason for this weak pace of growth dynamics is owing to its lower efficiency as compared to its counterparts. Despite this, the technology is favored for deployment along with solar energy projects owing to its lower cost.

Energy Storage System Market Segmentation by End-Use

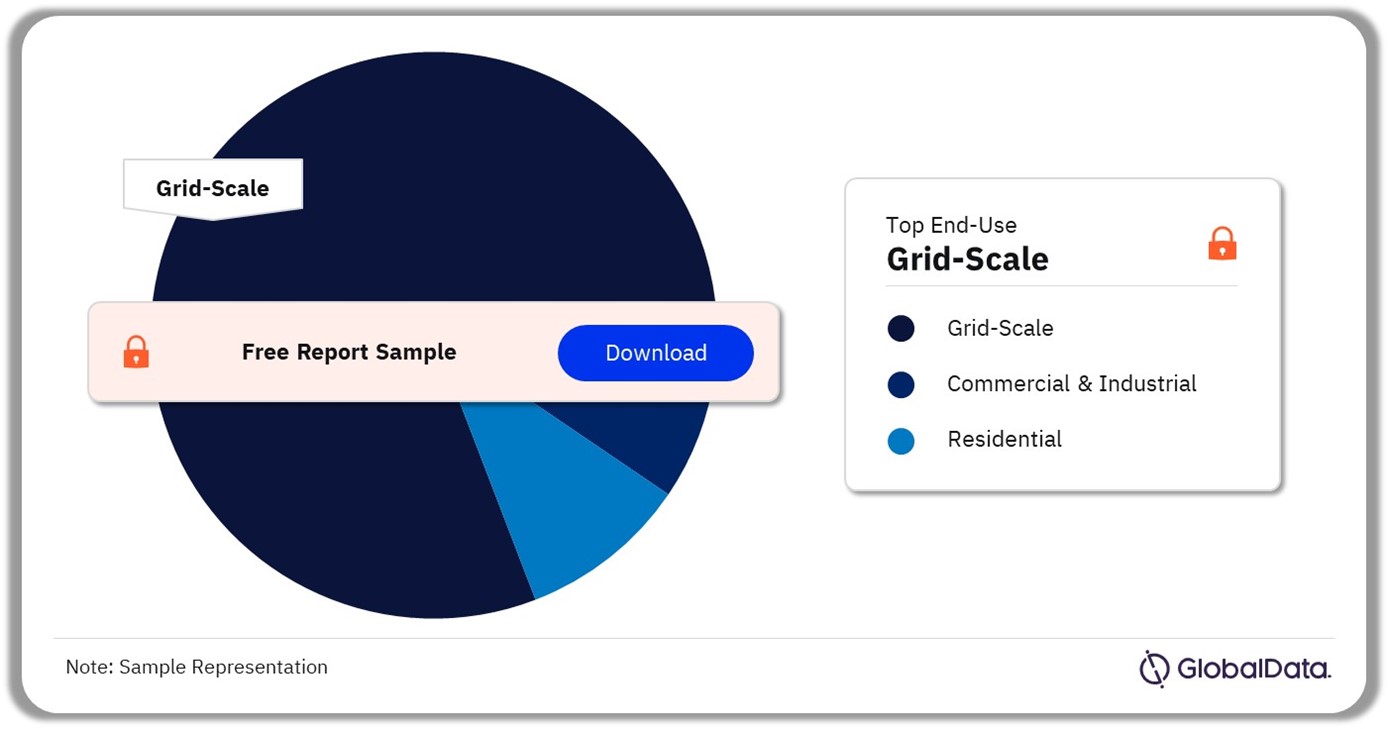
The ESS market segmentation by end-use is estimated to be dominated by the grid-scale segment over the forecast period. The use of ESS on grid-scale is projected to increase steadily owing to the ability of the technology to offer transmission support, provide congestion relief, and defer transmission & distribution upgrades. An important trend to observe in the grid-scale segment is the rising popularity of bigger battery energy storage systems. For instance, in EU27, nearly 33 projects with a size greater than 50 MW came online in 2022. These trends are likely to greatly benefit the market growth of ESS in the grid-scale end-use segment over the forecast period.

The residential end-use segment is projected to witness the highest compounded annual growth rate over the forecast period. The prime factor promoting the growth of this end-use segment is the necessary step towards self-reliance. Moreover, government-based added benefits are projected to positively influence the development of ESS in the residential end-use segment over the near future. For instance, in the US, the federal investment tax credit (ITC) reduces the residential energy storage system cost by USD 3,000 to USD 5,000.

Energy Storage System Market Analysis by End-Use, 2023 (%)

Energy Storage System Market Analysis by End-Use, 2023 (%)

Buy the Full Report for More Information on Energy Storage System Market End-Use
Download a Free Report Sample

The commercial & industrial end-use segment is predicted to witness a compounded annual growth rate (CAGR) of 9.8% over the forecast period. The growth in this segment is to be delivered by the rising consensus among the industrial vendors to cut down their respective carbon emissions and opt for renewable sources of energy. For instance, in April 2023, the US subsidiary of the Swiss-based cement manufacturer Holcim signed the agreement to switch to 100% renewable energy by 2033 for its 13 production sites.

Energy Storage System Market Segmentation by Region

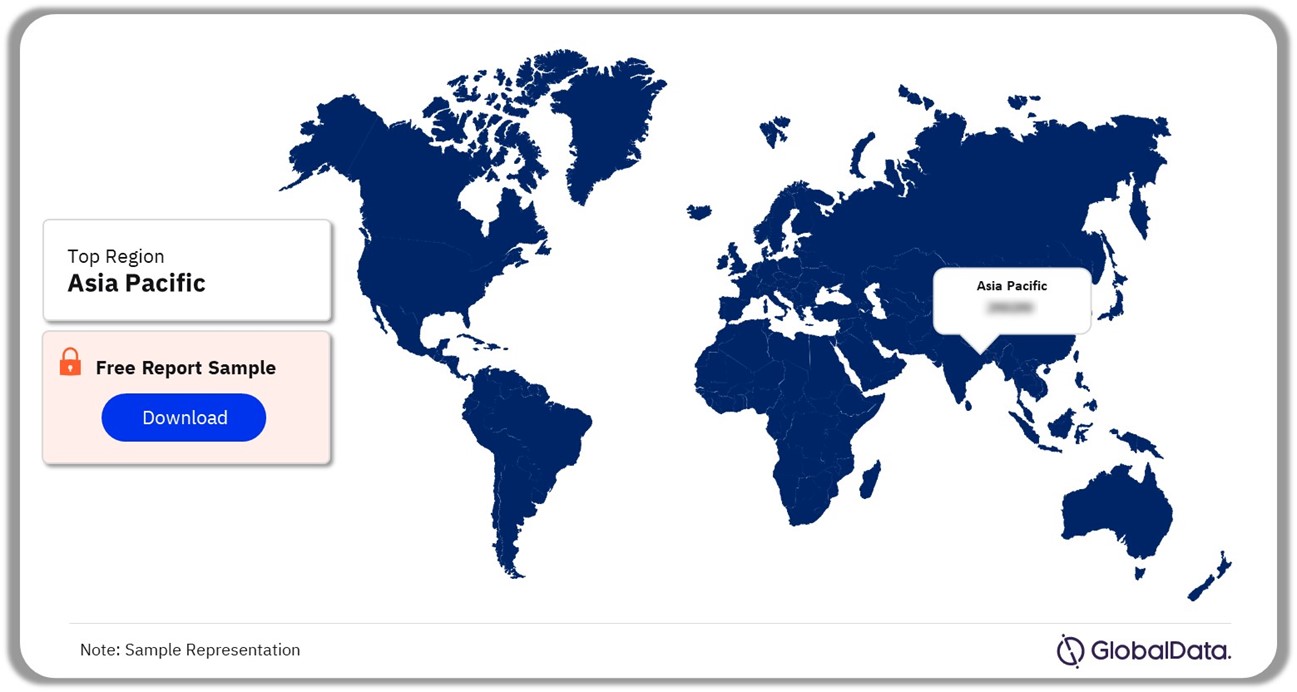
Asia Pacific captured the largest regional share in 2023 and is anticipated to remain the fastest-growing regional market for ESS over the forecast period. The growth in the market is primarily to be driven by China, India, and South Korea over the predicted timeline. Among these, China is anticipated to remain the largest regional market with significant additions made in the last year. For instance, in 2023, the overall renewable energy power capacity additions in China reached 301 GW which is approximately 59% of the global addition last year. Thus, massive renewable energy projects in the country are projected to aid the market development of ESS over the forecast period.

Similarly, the installation of energy storage systems in India has observed tremendous growth over the last few years. The country has planned to deploy approximately 45 energy storage projects over the coming 2 to 3 years. Moreover, the government of India is introducing various subsidies to promote the deployment of solar energy for residential use in the country.

For instance, in February 2024, the government of India announced a generous subsidy plan for the installation of a 3-kW solar rooftop system for residential homes. In addition, this solar rooftop plan also includes 300 units of free electricity for local consumers. Thus, appropriate incentives to boost clean energy deployment are expected to aid the market growth of energy storage systems in India over the predicted timeline.

Energy Storage System Market Share by Region, 2023 (%)

Energy Storage System Market Share by Region, 2023 (%)

Buy the Full Report for Regional Insights into the Energy Storage System Market
Download a Free Report Sample

EMEA is projected to remain the second-largest region with a projected compounded annual growth rate of 12.4% in terms of value over the forecast period. The European countries are making a great effort to decarbonize and move towards a clean energy future. For instance, the UK has got a strong project pipeline of 13 GW by 2030 with front-of-meter installations dominating the domestic market space. All these measures are anticipated to aid the market growth of ESS in the EMEA region over the forecast period.

Americas region registered third place in the global market space of ESS in 2023. The regional growth dynamics are to be supported by the US which accounted for the volumetric regional share of over 47% in 2023.

The introduction of the Inflation Reduction Act (IRA) of 2022 is estimated to remain a primary booster for the domestic ESS market in the US. This act allows the restructuring of the existing energy infrastructure which has ceased to operate under section 1706 and provides financial aid to repurpose these sites. Moreover, this act further supports employment opportunities in the country with an anticipated 1 million jobs in the clean energy and related manufacturing sector. These measures from the US government is expected to positively influence the ESS market growth over the forecast period.

Energy Storage System Market – Competitive Landscape

The competitive landscape of the global ESS market space is partially dominated by the vendors from China, South Korea, the US, Japan, and Europe. The acquisition activities have picked up significantly in the post pandemic era. For instance, in February 2024, Tropical Battery Company acquired the specialized battery manufacturer from the US Rose Batteries for an undisclosed sum. This acquisition will allow Tropical Battery Company to offer customized solutions to its B2B consumer base.

Another key trend to observe is the OEMs’ rising interest in acquiring manufacturers of advanced battery systems. For instance, in November 2023, Komatsu America Corp. a leading manufacturer of construction, mining, industrial, forestry, and heavy equipment announced to acquire 100% stakes of American Battery Solutions for an undisclosed value.

Lastly, there is an upsurge in clean energy project acquisitions. For instance, in October 2022, TagEnergy, a clean energy company, acquired Pitkevy battery storage project in the UK from Intelligent Land Investment Group Plc (ILI Group).

Leading Companies in the Energy Storage System Market

  • GE Renewable Energy
  • LG Energy Solutions
  • SAMSUNG SDI CO.,LTD.
  • NGK Insulators Ltd
  • BYD Co Ltd
  • Saft
  • Amber Kinetics, Inc.
  • Voith GmbH & Co. KGaA
  • Contemporary Amperex Technology Ltd
  • CALMAC

Other Energy Storage System Market Vendors Mentioned

ANDRITZ, Hydrostor Inc., MAN Energy Solutions SE, VYCON, C&D TECHNOLOGIES, INC., Fluence, Narada, Abengoa, Brenmiller Energy Ltd., A123 Systems LLC, Sinexcel, Xtreme Power Inc., NextEra Energy, Inc. , Tesla, sonnenGroup , and Leclanché SA.

Leading ESS Companies

Leading ESS Companies

Buy the Full Report to Know More About Leading Energy Storage System Companies
Download a Free Report Sample

Energy Storage System Market Segments

GlobalData Plc has segmented the energy storage system market report by technology, end-use, and region:

Energy Storage System Market Technology Outlook (Revenue, $Million, 2019-2026)

  • Electromechanical
  • Electrochemical
  • Thermal Storage

Energy Storage System Market End-Use Outlook (Revenue, $Million, 2019-2026)

  • Grid-Scale
  • Commercial & Industrial
  • Residential

Energy Storage System Market Regional Outlook (Revenue, $Million, 2019-2026)

  • Americas
    • US
    • Rest of Americas
  • EMEA
    • Germany
    • France
    • UK
    • Rest of EMEA
  • Asia Pacific
    • China
    • India
    • Japan
    • South Korea
    • Australia
    • Rest of Asia Pacific

Key Players

GE Renewable Energy
LG Energy Solutions
SAMSUNG SDI CO.,LTD.
NGK Insulators Ltd
BYD Co Ltd
Saft
Amber Kinetics, Inc.
Voith GmbH & Co. KGaA
Contemporary Amperex Technology Ltd
CALMAC

Table of Contents

  • Chapter 1 Executive Summary

    • 1.1. Energy Storage System Market Snapshot

  • Chapter 2 Research Scope & Segmentation
  • Chapter 3 Industry Outlook & Trend Analysis

  • 3.1. Macroeconomic Indicators
  • 3.2. Energy Storage Systems – Industry Value Chain

    • 3.2.1. List of Equipment Manufacturers
    • 3.2.2. List of Engineering, Procurement, and Construction Players
    • 3.2.3. List of Power Generating Vendors
    • 3.2.4. List of Transmission & Distribution Companies

  • 3.3. Technological Trends

    • 3.3.1. Mechanical Storage

      • 3.3.1.1. Pumped Hydro Storage (PHS)
      • 3.3.1.2. Flywheel Energy Storage (FES)
      • 3.3.1.3. CAES

    • 3.3.2. Electrochemical Storage

      • 3.3.2.1. Battery Chemistry
      • 3.3.2.2. Battery Types
      • 3.3.2.3. Battery Technologies

    • 3.3.3. Thermal Energy Storage
    • 3.3.4. Electrical Energy Storage

      • 3.3.4.1. SMES
      • 3.3.4.2. Supercapacitors

  • 3.4. Regulatory Trends
  • 3.5. Energy Storage System – Market Variables & Impact Analysis

    • 3.5.1. Market Driver Analysis
    • 3.5.2. Market Restraint Analysis

  • 3.6. Energy Storage System – PORTER’s Analysis
  • 3.7. Environmental Impact Analysis
  • 3.8. Major Developments of Energy Storage System Market
  • 3.9. Energy Storage System – Mergers & Acquisitions (M&A)
  • 3.10. Energy Storage System – Patent Analysis
  • Chapter 4 Energy Storage System Revenue Opportunity

  • 4.1. Global Market Snapshot, 2019 – 2026
  • 4.2. Global Energy Storage System Market – By Technology, 2019 – 2026
  • 4.3. Global Energy Storage System Market – By End Use, 2019 – 2026
  • Chapter 5 Energy Storage System- Regional Outlook

  • 5.1. Energy Storage System Market – Regional Deep Dive
  • 5.2. Americas Energy Storage System Market Overview

    • 5.2.1. Americas Energy Storage System Market By Technology, 2019 – 2026
    • 5.2.2. Americas Energy Storage System Market By End-Use, 2019 – 2026
    • 5.2.3. US

      • 5.2.3.1. US Energy Storage System Market By Technology, 2019 – 2026
      • 5.2.3.2. US Energy Storage System Market By End-Use, 2019 – 2026

    • 5.2.4. Rest of Americas

      • 5.2.4.1. Canada Energy Storage System Market By Technology, 2019 – 2026
      • 5.2.4.2. Canada Energy Storage System Market By End-Use, 2019 – 2026

  • 5.3. EMEA Energy Storage System Market Snapshot

    • 5.3.1. EMEA Energy Storage System Market By Technology, 2019 – 2026
    • 5.3.2. EMEA Energy Storage System Market By End-Use, 2019 – 2026
    • 5.3.3. Germany

      • 5.3.3.1. Germany Energy Storage System Market By Technology, 2019 – 2026
      • 5.3.3.2. Germany Energy Storage System Market By End-Use, 2019 – 2026

    • 5.3.4. UK

      • 5.3.4.1. UK Energy Storage System Market By Technology, 2019 – 2026
      • 5.3.4.2. UK Energy Storage System Market By End-Use, 2019 – 2026

    • 5.3.5. France

      • 5.3.5.1. France Energy Storage System Market By Technology, 2019 – 2026
      • 5.3.5.2. France Energy Storage System Market By End-Use, 2019 – 2026

    • 5.3.6. Rest of EMEA

      • 5.3.6.1. Rest of EMEA Energy Storage System Market By Technology, 2019 – 2026
      • 5.3.6.2. Rest of EMEA Energy Storage System Market By End-Use, 2019 – 2026

  • 5.4. Asia Pacific Energy Storage System Market Snapshot

    • 5.4.1. Asia Pacific Energy Storage System Market By Technology, 2019 – 2026
    • 5.4.2. Asia Pacific Energy Storage System Market By End-Use, 2019 – 2026
    • 5.4.3. China

      • 5.4.3.1. China Energy Storage System Market By Technology, 2019 – 2026
      • 5.4.3.2. China Energy Storage System Market By End-Use, 2019 – 2026

    • 5.4.4. India

      • 5.4.4.1. India Energy Storage System Market By Technology, 2019 – 2026
      • 5.4.4.2. India Energy Storage System Market By End-Use, 2019 – 2026

    • 5.4.5. Japan

      • 5.4.5.1. Japan Energy Storage System Market By Technology, 2019 – 2026
      • 5.4.5.2. Japan Energy Storage System Market By End-Use, 2019 – 2026

    • 5.4.6. South Korea

      • 5.4.6.1. South Korea Energy Storage System Market By Technology, 2019 – 2026
      • 5.4.6.2. South Korea Energy Storage System Market By End-Use, 2019 – 2026

    • 5.4.7. Australia

      • 5.4.7.1. Australia Energy Storage System Market By Technology, 2019 – 2026
      • 5.4.7.2. Australia Energy Storage System Market By End-Use, 2019 – 2026

    • 5.4.8. Rest of Asia Pacific

      • 5.4.8.1. Rest of Asia Pacific Energy Storage System Market By Technology, 2019 – 2026
      • 5.4.8.2. Rest of Asia Pacific Energy Storage System Market By End-Use, 2019 – 2026

  • Chapter 6 Energy Storage System- Competitive Landscape

  • 6.1. Key Players & Recent Developments & Their Impact on the Industry
  • 6.2. List of Energy Storage Tenders & Contracts
  • 6.3. List of Energy Storage Projects
  • 6.4. Case Studies

    • 6.4.1. Angas A-Caes Project, Angas Zinc Mine, Australia
    • 6.4.2. Siemens Gamesa Demonstrator Plant, Germany
    • 6.4.3. Highview Power Cryobattery, UK
    • 6.4.4. Project Centurion, Runcorn, UK
    • 6.4.5. Ravenswood Generating Station Battery Storage

  • Chapter 7 Energy Storage System – Company Profiles

  • 7.1. GE Renewable Energy
  • 7.2. LG Energy Solutions
  • 7.3. SAMSUNG SDI CO.,LTD.
  • 7.4. NGK Insulators Ltd
  • 7.5. BYD Co Ltd
  • 7.6. Saft
  • 7.7. Amber Kinetics, Inc.
  • 7.8. Voith GmbH & Co. KGaA
  • 7.9. Contemporary Amperex Technology Ltd
  • 7.10. CALMAC
  • Chapter 8 Research Methodology

  • 8.1. Research Methodology Steps

    • 8.1.1. Market Study
    • 8.1.2. Research
    • 8.1.3. Analysis
    • 8.1.4. Quality Control

  • Chapter 9 About GlobalData

Table

  • Table 1 Key Trends Overview
  • Table 2 Global Energy Storage System Market By Technology, 2019 – 2026 ($Million)
  • Table 3 Global Energy Storage System Market By Technology, 2019 – 2026 (MW)
  • Table 4 Global Energy Storage System Market By End-Use, 2019 – 2026 ($Million)
  • Table 5 Global Energy Storage System Market By End-Use, 2019 – 2026 (MW)
  • Table 6 Americas Energy Storage System Market By Technology, 2019 – 2026 ($Million)
  • Table 7 Americas Energy Storage System Market By Technology, 2019 – 2026 (MW)
  • Table 8 Americas Energy Storage System Market By End-Use, 2019 – 2026 ($Million)
  • Table 9 Americas Energy Storage System Market By End-Use, 2019 – 2026 (MW)
  • Table 10 U.S. Energy Storage System Market By Technology, 2019 – 2026 ($Million)
  • Table 11 U.S. Energy Storage System Market By Technology, 2019 – 2026 (MW)
  • Table 12 U.S. Energy Storage System Market By End-Use, 2019 – 2026 ($Million)
  • Table 13 U.S. Energy Storage System Market By End-Use, 2019 – 2026 (MW)
  • Table 14 Rest of Americas Energy Storage System Market By Technology, 2019 – 2026 ($Million)
  • Table 15 Rest of Americas Energy Storage System Market By Technology, 2019 – 2026 (MW)
  • Table 16 Rest of Americas Energy Storage System Market By End-Use, 2019 – 2026 ($Million)
  • Table 17 Rest of Americas Energy Storage System Market By End-Use, 2019 – 2026 (MW)
  • Table 18 EMEA Energy Storage System Market By Technology, 2019 – 2026 ($Million)
  • Table 19 EMEA Energy Storage System Market By Technology, 2019 – 2026 (MW)
  • Table 20 EMEA Energy Storage System Market By End-Use, 2019 – 2026 ($Million)
  • Table 21 EMEA Energy Storage System Market By End-Use, 2019 – 2026 (MW)
  • Table 22 Germany Energy Storage System Market By Technology, 2019 – 2026 ($Million)
  • Table 23 Germany Energy Storage System Market By Technology, 2019 – 2026 (MW)
  • Table 24 Germany Energy Storage System Market By End-Use, 2019 – 2026 ($Million)
  • Table 25 Germany Energy Storage System Market By End-Use, 2019 – 2026 (MW)
  • Table 26 UK Energy Storage System Market By Technology, 2019 – 2026 ($Million)
  • Table 27 UK Energy Storage System Market By Technology, 2019 – 2026 (MW)
  • Table 28 UK Energy Storage System Market By End-Use, 2019 – 2026 ($Million)
  • Table 29 UK Energy Storage System Market By End-Use, 2019 – 2026 (MW)
  • Table 30 France Energy Storage System Market By Technology, 2019 – 2026 ($Million)
  • Table 31 France Energy Storage System Market By Technology, 2019 – 2026 (MW)
  • Table 32 France Energy Storage System Market By End-Use, 2019 – 2026 ($Million)
  • Table 33 France Energy Storage System Market By End-Use, 2019 – 2026 (MW)
  • Table 34 Rest of EMEA Energy Storage System Market By Technology, 2019 – 2026 ($Million)
  • Table 35 Rest of EMEA Energy Storage System Market By Technology, 2019 – 2026 (MW)
  • Table 36 Rest of EMEA Energy Storage System Market By End-Use, 2019 – 2026 ($Million)
  • Table 37 Rest of EMEA Energy Storage System Market By End-Use, 2019 – 2026 (MW)
  • Table 38 Asia Pacific Energy Storage System Market By Technology, 2019 – 2026 ($Million)
  • Table 39 Asia Pacific Energy Storage System Market By Technology, 2019 – 2026 (MW)
  • Table 40 Asia Pacific Energy Storage System Market By End-Use, 2019 – 2026 ($Million)
  • Table 41 Asia Pacific Energy Storage System Market By End-Use, 2019 – 2026 (MW)
  • Table 42 China Energy Storage System Market By Technology, 2019 – 2026 ($Million)
  • Table 43 China Energy Storage System Market By Technology, 2019 – 2026 (MW)
  • Table 44 China Energy Storage System Market By End-Use, 2019 – 2026 ($Million)
  • Table 45 China Energy Storage System Market By End-Use, 2019 – 2026 (MW)
  • Table 46 India Energy Storage System Market By Technology, 2019 – 2026 ($Million)
  • Table 47 India Energy Storage System Market By Technology, 2019 – 2026 (MW)
  • Table 48 India Energy Storage System Market By End-Use, 2019 – 2026 ($Million)
  • Table 49 India Energy Storage System Market By End-Use, 2019 – 2026 (MW)
  • Table 50 Japan Energy Storage System Market By Technology, 2019 – 2026 ($Million)
  • Table 51 Japan Energy Storage System Market By Technology, 2019 – 2026 (MW)
  • Table 52 Japan Energy Storage System Market By End-Use, 2019 – 2026 ($Million)
  • Table 53 Japan Energy Storage System Market By End-Use, 2019 – 2026 (MW)
  • Table 54 South Korea Energy Storage System Market By Technology, 2019 – 2026 ($Million)
  • Table 55 South Korea Energy Storage System Market By Technology, 2019 – 2026 (MW)
  • Table 56 South Korea Energy Storage System Market By End-Use, 2019 – 2026 ($Million)
  • Table 57 South Korea Energy Storage System Market By End-Use, 2019 – 2026 (MW)
  • Table 58 Australia Energy Storage System Market By Technology, 2019 – 2026 ($Million)
  • Table 59 Australia Energy Storage System Market By Technology, 2019 – 2026 (MW)
  • Table 60 Australia Energy Storage System Market By End-Use, 2019 – 2026 ($Million)
  • Table 61 Australia Energy Storage System Market By End-Use, 2019 – 2026 (MW)
  • Table 62 Rest of Asia Pacific Energy Storage System Market By Technology, 2019 – 2026 ($Million)
  • Table 63 Rest of Asia Pacific Energy Storage System Market By Technology, 2019 – 2026 (MW)
  • Table 64 Rest of Asia Pacific Energy Storage System Market By End-Use, 2019 – 2026 ($Million)
  • Table 65 Rest of Asia Pacific Energy Storage System Market By End-Use, 2019 – 2026 (MW)

Figures

  • Fig 1 Market snapshot
  • Fig 2 Energy storage system (ESS) market segmentation
  • Fig 3 Industry value chain
  • Fig 4 Type of Energy Storage Systems
  • Fig 5 Mechanical and Thermal Value Chain
  • Fig 6 Electrochemical Battery Value Chain
  • Fig 7 Hydrogen Storage Value Chain
  • Fig 8 Type of Energy Storage Technologies
  • Fig 9 Energy Storage Systems Market – Key Drivers Impact Analysis
  • Fig 10 Energy Storage Systems Market – Key Restraint Impact Analysis
  • Fig 11 Energy Storage Systems Market – PORTER’s Analysis
  • Fig 12 Energy Storage Systems (EES)– Patent Activity Dashboard
  • Fig 13 Global Energy Storage System Market –Revenue Opportunity Forecast, 2019-2026 ($Million)
  • Fig 14 Global Energy Storage System Market By Technology, 2019-2026 ($Million)
  • Fig 15 Global Energy Storage System Market By End-Use, 2019-2026 ($Million)
  • Fig 16 Energy Storage System, Maturity of Different Storage Technologies
  • Fig 17 Energy Storage System Applications
  • Fig 18 Energy Storage System (EES)– Market Overview
  • Fig 19 Americas Energy Storage System (ESS) Market Snapshot
  • Fig 20 Americas Energy Storage System (ESS) By Technology Type Share – 2023 & 2026 (%)
  • Fig 21 Americas Energy Storage System (ESS) By End-Use Type Share – 2023 & 2026 (%)
  • Fig 22 U.S. Energy Storage System (ESS) By Technology Type Share – 2023 & 2026 (%)
  • Fig 23 U.S. Energy Storage System (ESS) By End-Use Type Share – 2023 & 2026 (%)
  • Fig 24 Rest of Americas Energy Storage System (ESS) By Technology Type Share – 2023 & 2026 (%)
  • Fig 25 Rest of Americas Energy Storage System (ESS) By End-Use Type Share – 2023 & 2026 (%)
  • Fig 26 EMEA Energy Storage System (ESS) Market Snapshot
  • Fig 27 EMEA Energy Storage System (ESS) by technology type share – 2023 & 2026 (%)
  • Fig 28 EMEA Energy Storage System (ESS) By End-Use Type Share – 2023 & 2026 (%)
  • Fig 29 Germany Energy Storage System (ESS) By Technology Type Share – 2023 & 2026 (%)
  • Fig 30 Germany Energy Storage System (ESS) By End-Use Type Share – 2023 & 2026 (%)
  • Fig 31 UK Energy Storage System (ESS) By Technology Type Share – 2023 & 2026 (%)
  • Fig 32 UK Energy Storage System (ESS) By End-Use Type Share – 2023 & 2026 (%)
  • Fig 33 France Energy Storage System (ESS) By Technology Type Share – 2023 & 2026 (%)
  • Fig 34 France Energy Storage System (ESS) By End-Use Type Share – 2023 & 2026 (%)
  • Fig 35 Rest of EMEA Energy Storage System (ESS) By Technology Type Share – 2023 & 2026 (%)
  • Fig 36 Rest of EMEA Energy Storage System (ESS) By End-Use Type Share – 2023 & 2026 (%)
  • Fig 37 Asia Pacific Energy Storage System (ESS) Market Snapshot
  • Fig 38 Asia Pacific Energy Storage System (ESS) By Technology Type Share – 2023 & 2026 (%)
  • Fig 39 Asia Pacific Energy Storage System (ESS) By End-Use Type Share – 2023 & 2026 (%)
  • Fig 40 China Energy Storage System (ESS) By Technology Type Share – 2023 & 2026 (%)
  • Fig 41 China Energy Storage System (ESS) By End-Use Type Share – 2023 & 2026 (%)
  • Fig 42 India Energy Storage System (ESS) By Technology Type Share – 2023 & 2026 (%)
  • Fig 43 India Energy Storage System (ESS) By End-Use Type Share – 2023 & 2026 (%)
  • Fig 44 Japan Energy Storage System (ESS) By Technology Type Share – 2023 & 2026 (%)
  • Fig 45 Japan Energy Storage System (ESS) By End-Use Type Share – 2023 & 2026 (%)
  • Fig 46 South Korea Energy Storage System (ESS) By Technology Type Share – 2023 & 2026 (%)
  • Fig 47 South Korea Energy Storage System (ESS) By End-Use Type Share – 2023 & 2026 (%)
  • Fig 48 Australia Energy Storage System (ESS) By Technology Type Share – 2023 & 2026 (%)
  • Fig 49 Australia Energy Storage System (ESS) By End-Use Type Share – 2023 & 2026 (%)
  • Fig 50 Rest of Asia Pacific Energy Storage System (ESS) By Technology Type Share – 2023 & 2026 (%)
  • Fig 51 Rest of Asia Pacific Energy Storage System (ESS) By End-Use Type Share – 2023 & 2026 (%)
  • Fig 52 Company Snapshot: GE Renewable Energy
  • Fig 53 Company Snapshot: LG Energy Solutions
  • Fig 54 Company Snapshot: SAMSUNG SDI CO.,LTD.
  • Fig 55 Company Snapshot: NGK Insulators Ltd
  • Fig 56 Company Snapshot: BYD Co Ltd
  • Fig 57 Company Snapshot: Saft
  • Fig 58 Company Snapshot: Amber Kinetics, Inc.
  • Fig 59 Company Snapshot: Voith GmbH & Co. KGaA
  • Fig 60 Company Snapshot: Contemporary Amperex Technology Ltd
  • Fig 61 Company Snapshot: CALMAC
  • Fig 62 Data Analysis Model
  • Fig 63 Consumer Survey Process

Frequently asked questions

Currency USD
$3,950

Can be used by individual purchaser only

$7,950

Can be shared globally by unlimited users within the purchasing corporation e.g. all employees of a single company


Undecided about purchasing this report?

Enquire Before Buying Request a Free Sample

Get in touch to find out about multi-purchase discounts

reportstore@globaldata.com
Tel +44 20 7947 2745

Every customer’s requirement is unique. With over 220,000 construction projects tracked, we can create a tailored dataset for you based on the types of projects you are looking for. Please get in touch with your specific requirements and we can send you a quote.

Sample Report

We are confident about Energy Storage System (ESS) Market Size, Share, Trend Analysis and Forecast by Technology (Electromechanical, Electrochemical, and Thermal Storage), End-Use and Region to 2026 report's unique quality. However, we want you to make the most beneficial decision for your business, so we offer free sample pages to help you:

  • Assess the relevance of the report
  • Evaluate the quality of the report
  • Justify the cost

Download your copy of the sample report and make an informed decision about whether the full report will provide you with the insights and information you need.

Below is a sample report to understand what you are buying

See what our customers are saying

“The GlobalData platform is our go-to tool for intelligence services. GlobalData provides an easy way to access comprehensive intelligence data around multiple sectors, which essentially makes it a one-for-all intelligence platform, for tendering and approaching customers.

GlobalData is very customer orientated, with a high degree of personalised services, which benefits everyday use. The highly detailed project intelligence and forecast reports can be utilised across multiple departments and workflow scopes, from operational to strategic level, and often support strategic decisions. GlobalData Analytics and visualisation solutions has contributed positively when preparing management presentations and strategic papers.”

Business Intelligence & Marketing Manager, SAL Heavy Lift

“COVID-19 has caused significant interference to our business and the COVID-19 intelligence from GlobalData has helped us reach better decisions around strategy. These two highlights have helped enormously to understand the projections into the future concerning our business units, we also utilise the project database to source new projects for Liebherr-Werk to use as an additional source to pitch for new business.”

Market Analyst & Management, Liebherr-Werk

Your daily news has saved me a lot of time and keeps me up-to-date with what is happening in the market, I like that you almost always have a link to the source origin. We also use your market data in our Strategic Business Process to support our business decisions. By having everything in one place on the Intelligence Center it has saved me a lot of time versus looking on different sources, the alert function also helps with this.

Head of Key Accounts, Saab AB

Having used several other market research companies, I find that GlobalData manages to provide that ‘difficult-to-get’ market data that others can’t, as well as very diverse and complete consumer surveys.

Marketing Intelligence Manager, Portugal Foods

Our experience with GlobalData has been very good, from the platform itself to the people. I find that the analysts and the account team have a high level of customer focus and responsiveness and therefore I can always rely on. The platform is more holistic than other providers. It is convenient and almost like a one stop shop. The pricing suite is highly competitive and value for our organisation.

I like reports that inform new segments such as the analysis on generation Z, millennials, the impact of COVID 19 to our banking customers and their new channel habits. Secondly the specialist insight on affluent sector significantly increases our understanding about this group of customers. The combination of those give us depth and breadth of the evolving market.

I’m in the business of answering and helping people make decisions so with the intelligence center I can do that, effectively and efficiently. I can share quickly key insights that answer and satisfy our country stakeholders by giving them many quality studies and primary research about competitive landscape beyond the outlook of our bank. It helps me be seen as an advisory partner and that makes a big difference. A big benefit of our subscription is that no one holds the whole data and because it allows so many people, so many different parts of our organisation have access, it enables all teams to have the same level of knowledge and decision support.

Head of Customer Insight and Research, Standard Chartered

“I know that I can always rely on Globaldata’s work when I’m searching for the right consumer and market insights. I use Globaldata insights to understand the changing market & consumer landscape and help create better taste & wellbeing solutions for our customers in food, beverage and healthcare industries.

Globaldata has the right data and the reports are of very high quality compared to your competitors. Globaldata not only has overall market sizes & consumer insights on food & beverages but also provides insights at the ingredient & flavour level. That is key for B2B companies like Givaudan. This way we understand our customers’ business and also gain insight to our unique industry”

Head of Consumer Sensory Insights, Givaudan

GlobalData provides a great range of information and reports on various sectors that is highly relevant, timely, easy to access and utilise.  The reports and data dashboards help engagement with clients; they provide valuable industry and market insights that can enrich client conversations and can help in the shaping of value propositions. Moreover, using GlobalData products has helped increase my knowledge of the finance sector, the players within it, and the general threats and opportunities.

I find the consumer surveys that are carried out to be extremely beneficial and not something I have seen anywhere else. They provided an insightful view of why and which consumers take (or don’t) particular financial products. This can help shape conversations with clients to ensure they make the right strategic decisions for their business.

One of the challenges I have found is that data in the payments space is often piecemeal. With GD all of the data I need is in one place, but it also comes with additional market reports that provide useful extra context and information. Having the ability to set-up alerts on relevant movements in the industry, be it competitors or customers, and have them emailed directly to me, ensures I get early sight of industry activity and don’t have to search for news.

Senior Account Manager, TSYS
Go even deeper with GlobalData Intelligence Center

Every Company Report we produce is powered by the GlobalData Intelligence Center.

Subscribing to our intelligence platform means you can monitor developments at Energy Storage System (ESS) Market Size, Share, Trend Analysis and Forecast by Technology (Electromechanical, Electrochemical, and Thermal Storage), End-Use and Region to 2026 in real time.

  • Access a live Energy Storage System (ESS) Market Size, Share, Trend Analysis and Forecast by Technology (Electromechanical, Electrochemical, and Thermal Storage), End-Use and Region to 2026 dashboard for 12 months, with up-to-the-minute insights.
  • Fuel your decision making with real-time deal coverage and media activity.
  • Turn insights on financials, deals, products and pipelines into powerful agents of commercial advantage.