Enterprise IoT Market Trends and Analysis by Region, Product, Enterprise, Vertical, Connectivity and Segment Forecast to 2027

Powered by

Access in-depth insight and stay ahead of the market

Accessing the in-depth insights from the ‘Enterprise IoT report can help:

  • Gain a valuable understanding of the current and future state of the market, allowing businesses to make informed decisions about market entry, product development, and investments
  • Identify competitors’ capabilities to stay ahead in the market
  • Identify segments and get an understanding of various stakeholders across different stages of the entire value chain
  • Anticipate changes in demand and adjust the business development strategies
  • Identify potential regions and countries for growth opportunities

How is our ‘Enterprise IoT’ report different from other reports in the market?

  • The report presents in-depth market sizing and forecast at a segment level for more than 15 countries including historical and forecast analysis for the period 2019-2027 for market assessment.
  • Detailed segmentation by:
    • Product – IoT Hardware, IoT Software, IoT Services
    • Vertical – Government, Utilities, Manufacturing, Transport and Logistics, Energy, Insurance, Construction, Retail, Healthcare, Others
    • Enterprise size – Micro, Small, Medium, Large, Very large
    • Application – Industrial Internet (Condition Monitoring, Telematics, Asset Tracking, People & Animal Tracking, Environmental Monitoring, Advanced Automation, Healthcare) and Smart Cities (Smart Metering, Smart City Platforms, Smart Buildings, Smart Signage, and Smart Payment Systems).
    • Region – North America, Europe, Asia-Pacific, South & Central America, and Middle East & Africa
  • The report covers key market drivers and challenges impacting the enterprise IoT market.
  • The report includes a detailed Porter’s Analysis.
  • The report also covers a Mergers & Acquisitions (M&A) activity dashboard.
  • The competitive landscape includes competitive positioning of key companies and company share analysis in the enterprise IoT market that will help the stakeholders in the ongoing process of identifying, researching, and evaluating competitors, to gain insight to form their business strategies.
  • Competitive profiling and benchmarking of key companies in the market to provide a deeper understanding of industry competition.
  • The report can be a valuable tool for stakeholders to improve their operations, increase customer satisfaction, and maximize profitability by analyzing the latest enterprise IoT trends, tracking market growth and demand, and evaluating the existing competition in the market.

We recommend this valuable source of information to:

  • Companies offering enterprise IoT services/solutions
  • Consulting & Professional Services Firms
  • Venture Capital/Equity Firms

Get a Snapshot of the Enterprise IoT Market, Download a Free Report Sample

Enterprise IoT Market Overview

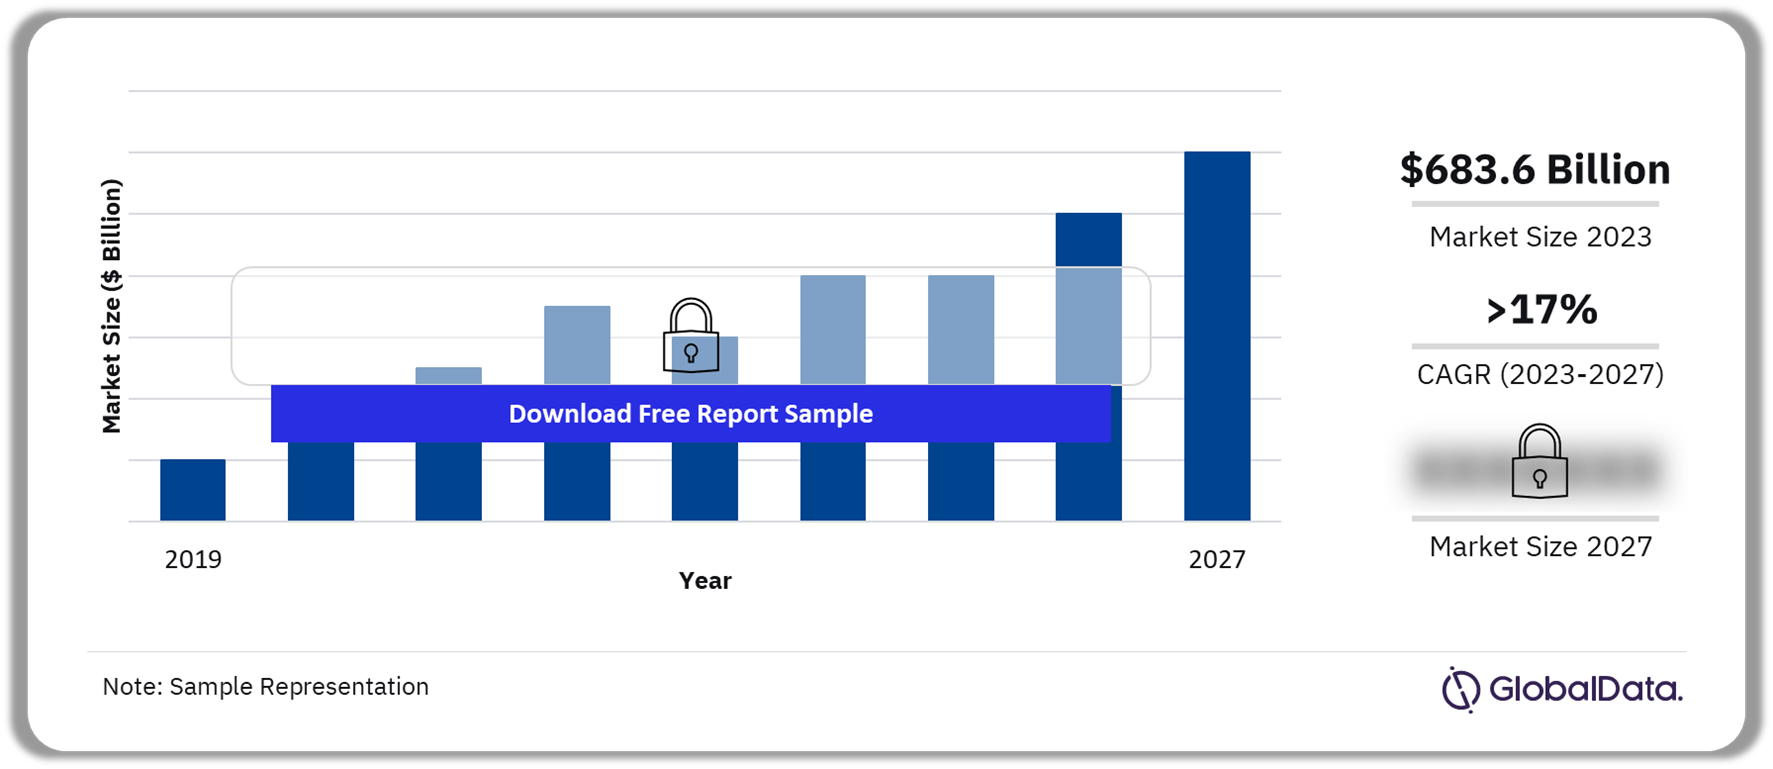
The enterprise Internet of Things (IoT) market size revenue was valued at $683.6 billion in 2023 and will grow at a compound annual growth rate (CAGR) of more than 17% over the forecast period. The integration of Enterprise IoT is poised for significant advancement with the rise of Artificial Intelligence of Things (AIoT), propelled by innovations like ChatGPT. Further, the expanding utilization of smart city technologies, and the evolution of connectivity solutions such as LoRaWAN, Sigfox, and Zigbee are expected to propel growth over the forecast period.

IoT serves as a key facilitator for digital transformation initiatives. When integrated with emerging technologies, like AI, 5G, and cloud computing, it enhances operational efficiency, lowers costs, redefines decision-making, and elevates the customer experience. IoT technology employs interconnected devices to oversee, regulate, and supervise diverse business operations, automating numerous manual tasks and predicting maintenance requirements in advance, thereby boosting productivity.

Enterprise Internet of Things Market Outlook, 2019 – 2027 ($Billion)

Enterprise Internet of Things Market Outlook, 2019 – 2027 ($Billion)

Buy the Full Report for Additional Insights on the Enterprise IoT Market Forecast, https://www.globaldata.com/store/talk-to-us/?report=3336076

The sensors within IoT devices generate a lot of data. Analysis of this data can lead to the development of optimized business strategies and improved business processes, enabling managers to make better informed operational decisions. Additionally, user-specific data generated through smart devices can help businesses understand customers’ expectations and behavior better. Analysis of this data can enable sales and marketing teams to target advertising, fine-tune pricing policy, and improve customer services.

COVID-19 has highlighted the crucial role of IoT in our lives. Numerous conventional applications, such as smart city initiatives, were paused as businesses grappled with the economic slowdown brought about by the pandemic. Governments redirected budgets in response to the health crisis, leading to a reprioritization of projects. By contrast, several IoT use cases saw growing adoption during the pandemic, such as using connected thermal cameras to detect potential COVID-19 infections and sensors for monitoring office occupancy levels. These new applications have positively impacted the growth of the IoT market.

Although the market is gaining traction, many companies, particularly small and medium-sized enterprises (SMEs), still lack an understanding of IoT, and actual adoption rates remain low. Hence, increasing awareness should be the top priority for IoT solution providers, achieved through clear messaging, case studies, and proof points showcasing IoT as a competitive advantage. Additionally, wider promotion of IoT products is essential to reach potential adopters.

Another area of concern is enterprise IoT security. The widespread adoption of IoT hinges on establishing a global standard for IoT security. The surge in connected devices has heightened cyberattack vulnerabilities, yet current IoT ecosystems lack sufficient security regulation. IoT security encompasses threats across devices, apps, networks, and data, with a primary focus on endpoint security to safeguard all connected devices.

Market Size (2023) $683.6 billion
CAGR (2023 – 2027) >17%
Forecast Period 2023-2027
Historic Data 2019-2022
Report Scope & Coverage Revenue Forecast, Competitive Index, Company Landscape, Growth Trends
Product Segment IoT Hardware, IoT Software, IoT Services
Enterprise Size Segment Micro (Less than 50), Small (51-250), Medium (251-1000), Large (1001-4999), and Very Large (5000+)
Vertical Segment Government, Utilities, Manufacturing, Transport and Logistics, Energy, Insurance, Construction, Retail, and Healthcare, among others.
Application Industrial Internet (Condition Monitoring, Telematics, Asset Tracking, People & Animal Tracking, Environmental Monitoring, Advanced Automation, Healthcare) and Smart Cities (Smart Metering, Smart City Platforms, Smart Buildings, Smart Signage, and Smart Payment Systems)
Connectivity Cellular, LoRa, LTE-M, NB-IoT, Satellite, Short Range, Sigfox, and Wireline
Geography North America, Europe, Asia Pacific, South & Central America, Middle East & Africa
Key Companies Microsoft, Alphabet, IBM, Samsung, Intel, Qualcomm, Siemens, Amazon, Huawei, and Cisco
Enquire & Decide Discover the perfect solution for your business needs. Enquire now and let us help you make an informed decision before making a purchase.

Enterprise IoT Market Segmentation by Product Types

Enterprise IoT solution is implemented through three product types, IoT hardware, IoT software, and IoT services. The IoT hardware segment demand is projected to capture more than 35% of the market by 2027. The IoT hardware market will witness a CAGR of more than 15% over the forecast period.

Enterprise Internet of Things Market Share by Product Types, 2023 (%)

Enterprise Internet of Things Market Share by Product Types, 2023 (%)

Buy the Full Report for More Information on Product Types in the Enterprise IoT Market

Download a Free Report Sample

IoT software includes software, applications, and platforms that facilitate the management and functioning of key areas of the connected ecosystem like networking (through platforms, embedded systems, and middleware), data collection, device integration, analysis of data sent/received, etc. One of the major application areas of IoT software is the digital twin. A digital twin is a software representation of physical assets and processes that allows an organization to carry out ‘what if’ simulations. These simulations can spot and avert problems proactively, help prevent downtime, and speed up the development of new products. The advent of digital twin technology will drive the IoT software market.

Enterprise IoT Market Segmentation by Enterprise Size

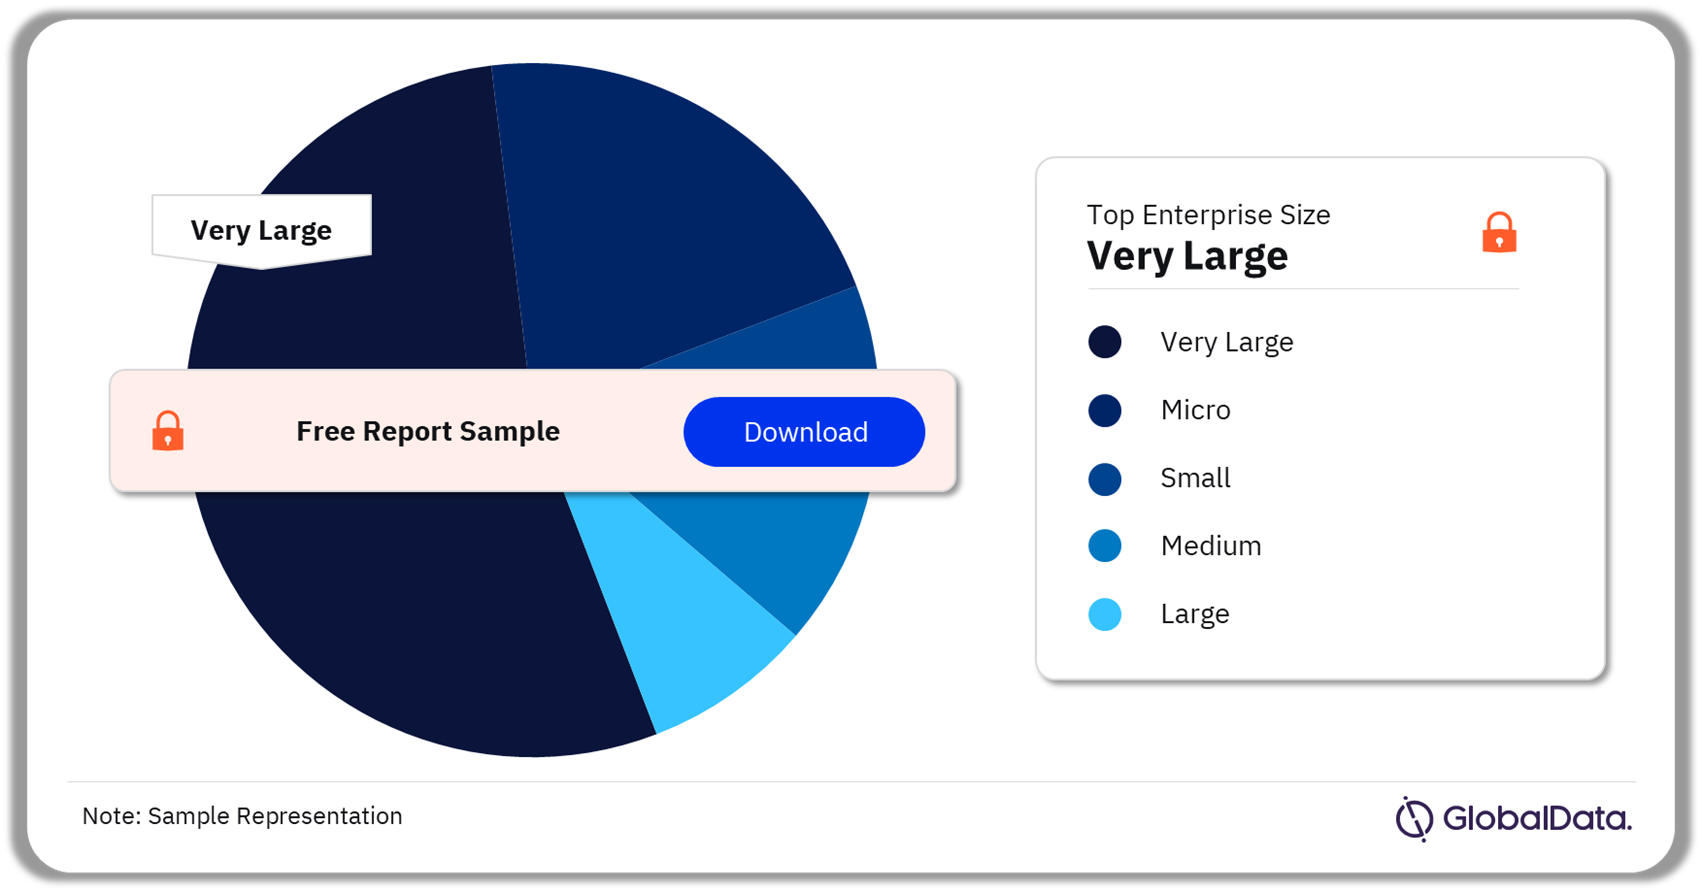
Based on enterprise size, the enterprise IoT market is segmented into micro, small, medium, large, and very large. In 2023, the very large enterprises market captured a sizeable market share exceeding 35%, and the segment is anticipated to witness strong growth, recording a CAGR surpassing 15% over the forecast period.

Enterprise Internet of Things Market Share by Enterprise Size, 2023 (%)

Enterprise Internet of Things Market Share by Enterprise Size, 2023 (%)

Buy the Full Report for More Information on the Enterprise IoT Market Enterprise Sizes

Download a Free Report Sample

Digital transformation throughout enterprises, the execution of industry 4.0 standards, and conventional industries looking for sustainable operational practices will drive the adoption of enterprise IoT. Additionally, concurrent technological developments such as the introduction of 5G networks and the adoption of advanced analytics and AI, allow for fast processing of the data collected at various enterprise IoT nodes and subsequent action on the same. Several manufacturers are utilizing enterprise IoT manufacturing use cases to reduce costs, better facility service, improve worker safety, etc.

Enterprise IoT Market Segmentation by Vertical

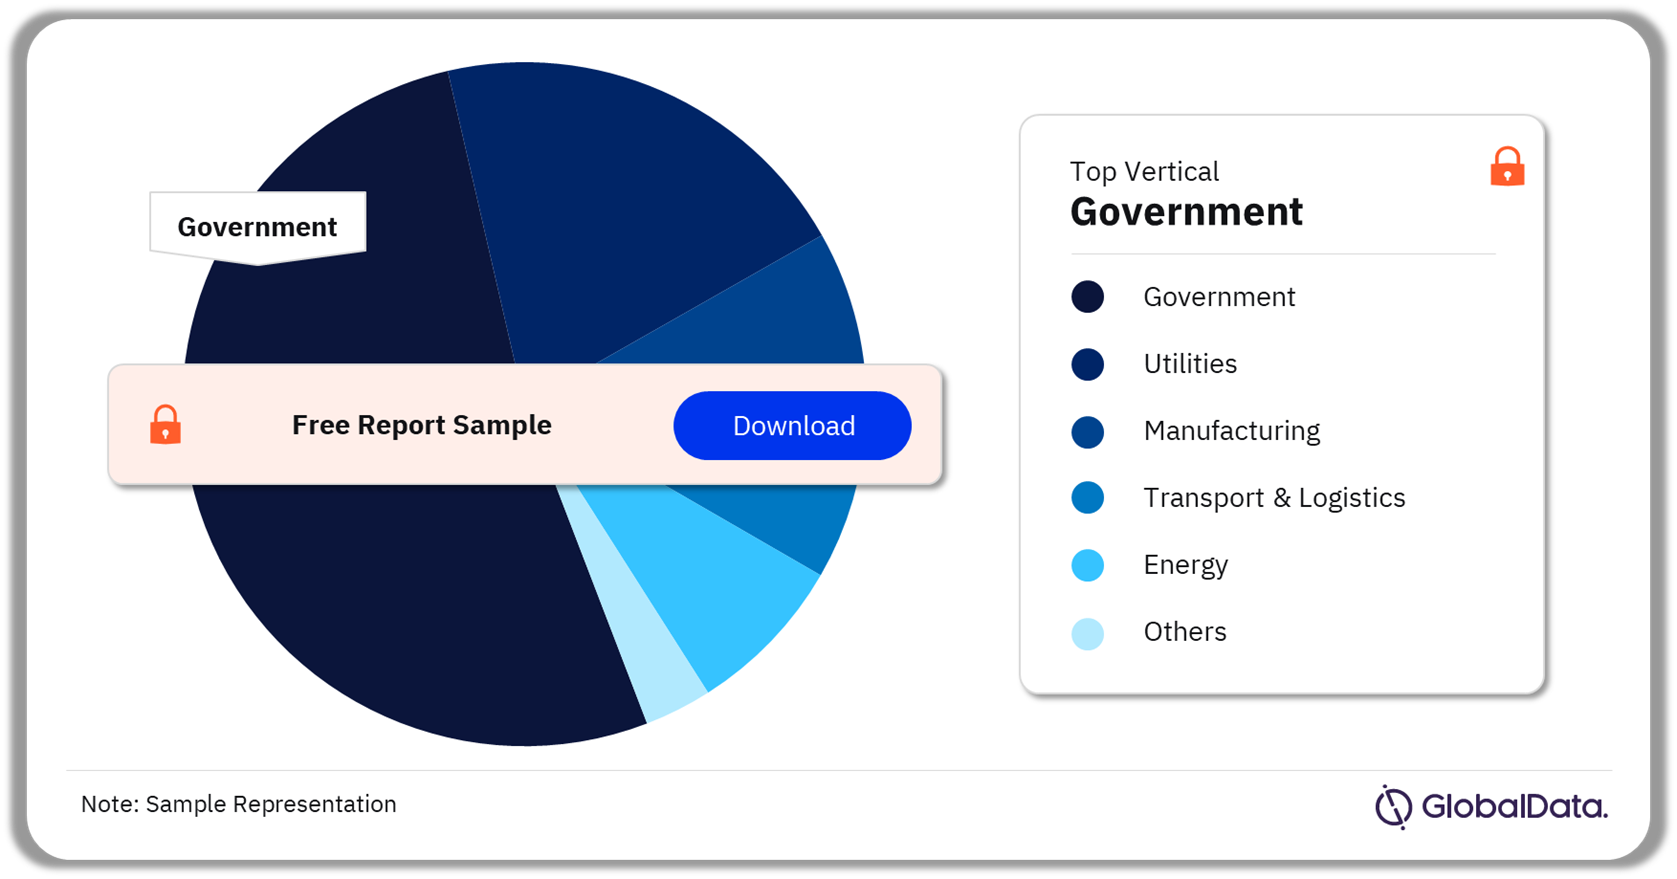
The enterprise IoT vertical segment includes government, utilities, manufacturing, transport and logistics, energy, insurance, construction, retail, and healthcare, among others. As of 2023, the market in the government category was the largest, accounting for over 10% of the overall enterprise IoT market size. The government segment includes central, federal, regional, state, and local (county or municipality) governments and other government establishments such as advisory commissions, etc. Increasing investments in smart cities by governments across the globe will drive the market in the government segment.

Enterprise Internet of Things Market Share by Vertical, 2023 (%)

Enterprise Internet of Things Market Share by Vertical, 2023 (%)

Buy the Full Report for More Information on the Enterprise IoT Market Verticals

Download a Free Report Sample

Verticals such as utilities, manufacturing, energy, transport and logistics, and retail held a share of over 25% of the global market size in 2023. While the conventional use of IoT in smart cities and traffic management is witnessing a boost in adoption, the development of new applications of IoT in connected and autonomous vehicles, smart packaging, and patient monitoring is also growing.

Enterprise IoT Market Segmentation by Application

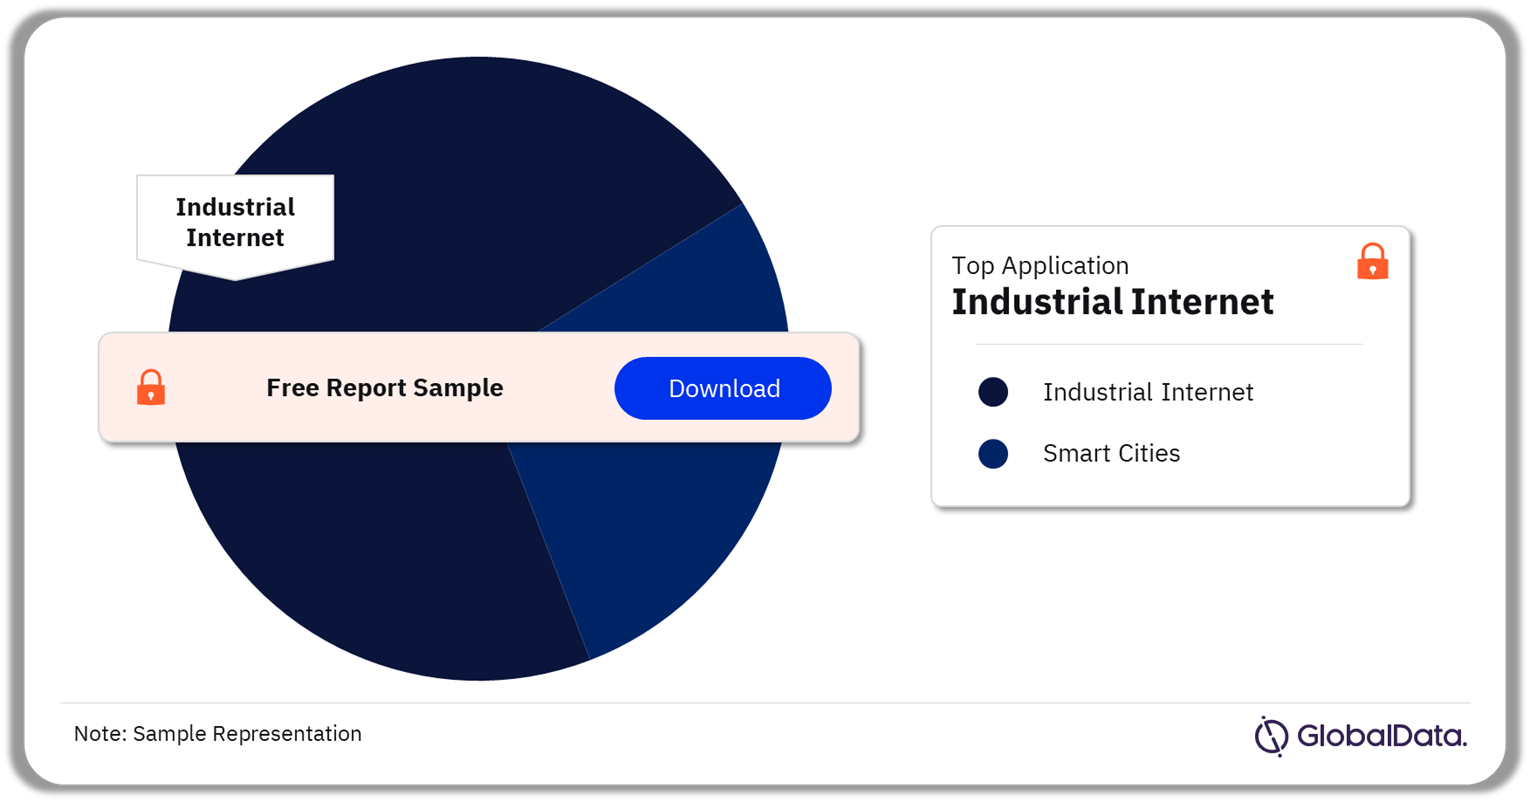
Industrial internet and smart cities are the two major segments by application of the enterprise IoT market. In 2023, the Industrial Internet segment captured a sizeable market share exceeding 50% and is anticipated to witness strong growth over the forecast period.

IT services have become an integral part of the Industrial Internet value chain. The necessity to integrate both IT and operational technology (OT) requires the expertise of external consulting services companies, particularly in the growing application of predictive maintenance. A dynamic market exists for smart city design and integration services, which intricately links applications for smart buildings, transportation, infrastructure, and power grids.

Enterprise Internet of Things Market Share by Application, 2023 (%)

Enterprise Internet of Things Market Share by Application, 2023 (%)

Buy the Full Report for More Information on the Enterprise IoT Market Applications

Download a Free Report Sample

Further, by leveraging smart city data through efficient analysis, cities can automate their infrastructure to enhance the well-being and safety of their residents. AI, for instance, holds the potential to revolutionize energy allocation, optimize the performance of water pipelines, sewage systems, and utilities, as well as predict and minimize maintenance needs.

Enterprise IoT Market Segmentation by Connectivity

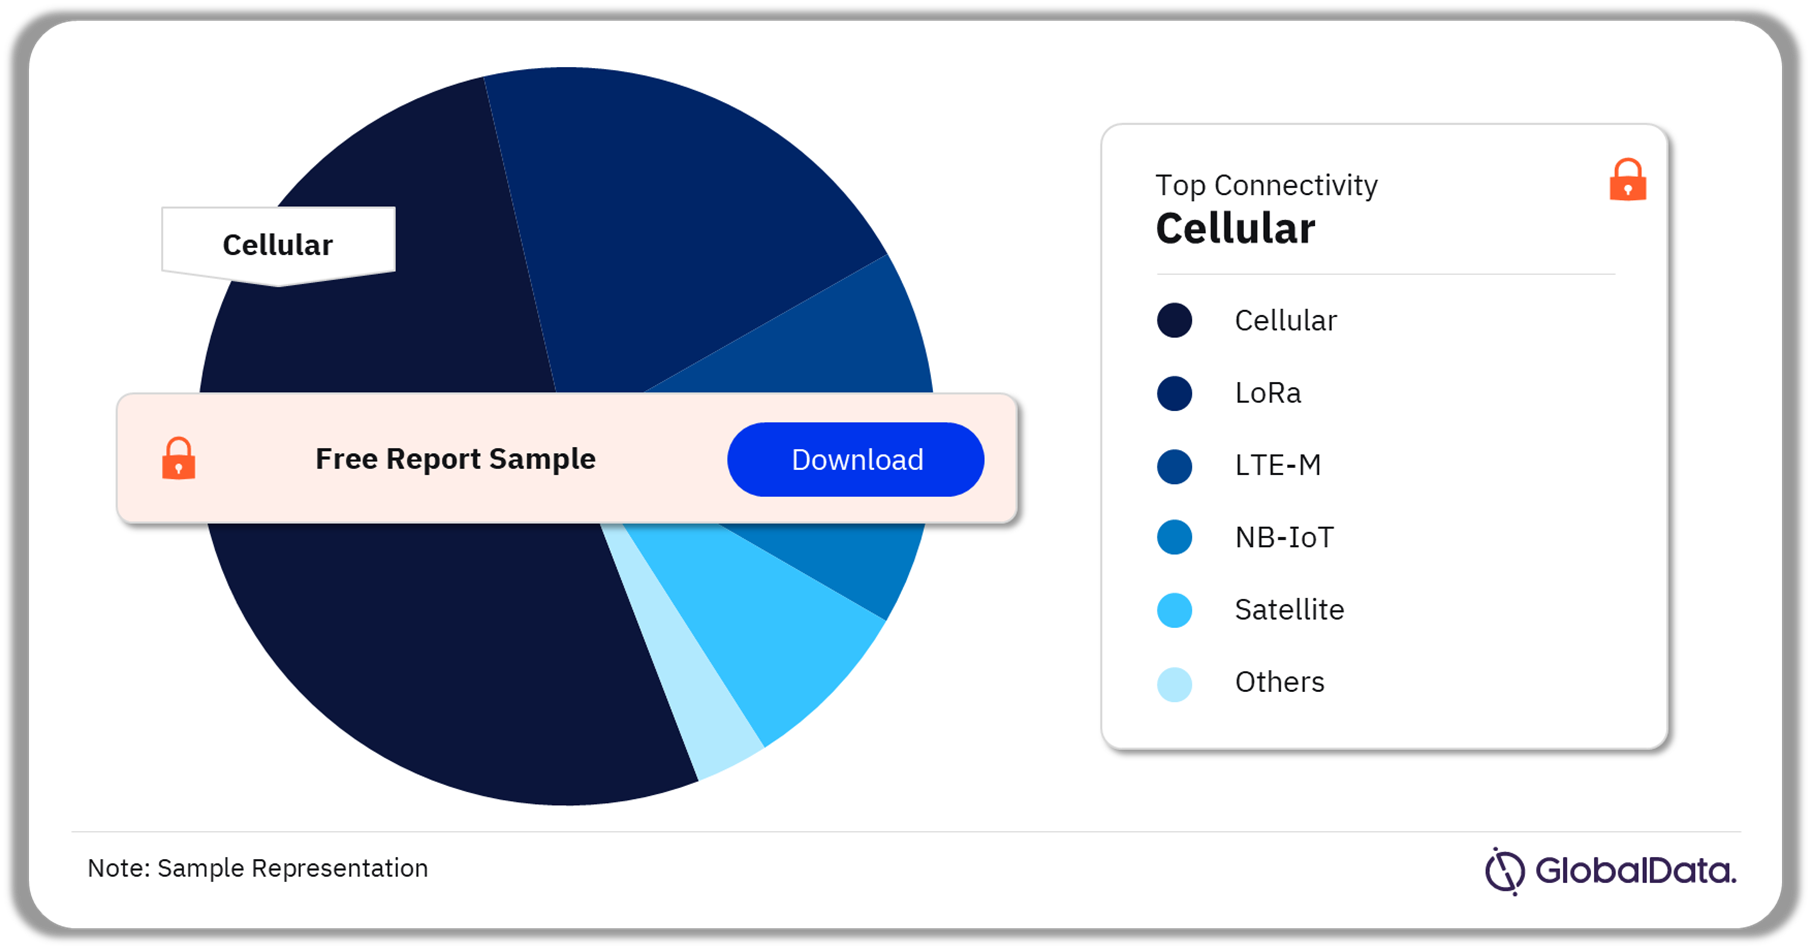
In 2023, the cellular was the largest segment in the enterprise IoT market, growing at 15% CAGR over the next few years. The expansion of cellular enterprise IoT is propelled by advancements in cellular technology, exemplified by the rollout of 5G networks. These networks provide heightened bandwidth, reduced latency, and enhanced device density capabilities. Furthermore, the growing adoption of IoT applications across diverse sectors including manufacturing, transportation, healthcare, and agriculture drives the need for cellular connectivity solutions.

Enterprise Internet of Things Market Share, by Connectivity, 2023 (%)

Enterprise Internet of Things Market Share, by Connectivity, 2023 (%)

Buy the Full Report for More Information on the Enterprise IoT Market Connectivity

Download a Free Report Sample

Mobile IoT network standards such as long-term evolution for machines (LTE-M) and narrowband IoT (NB-IoT) will play an important role in the progress of enterprise IoT applications. Various network protocols such as Bluetooth low energy (BLE), Wi-Fi, long-range wide area network (LoRaWAN), Sigfox, and Zigbee have been developed to support the infrastructure for IoT sensors with modest bandwidth requirements and low power consumption.

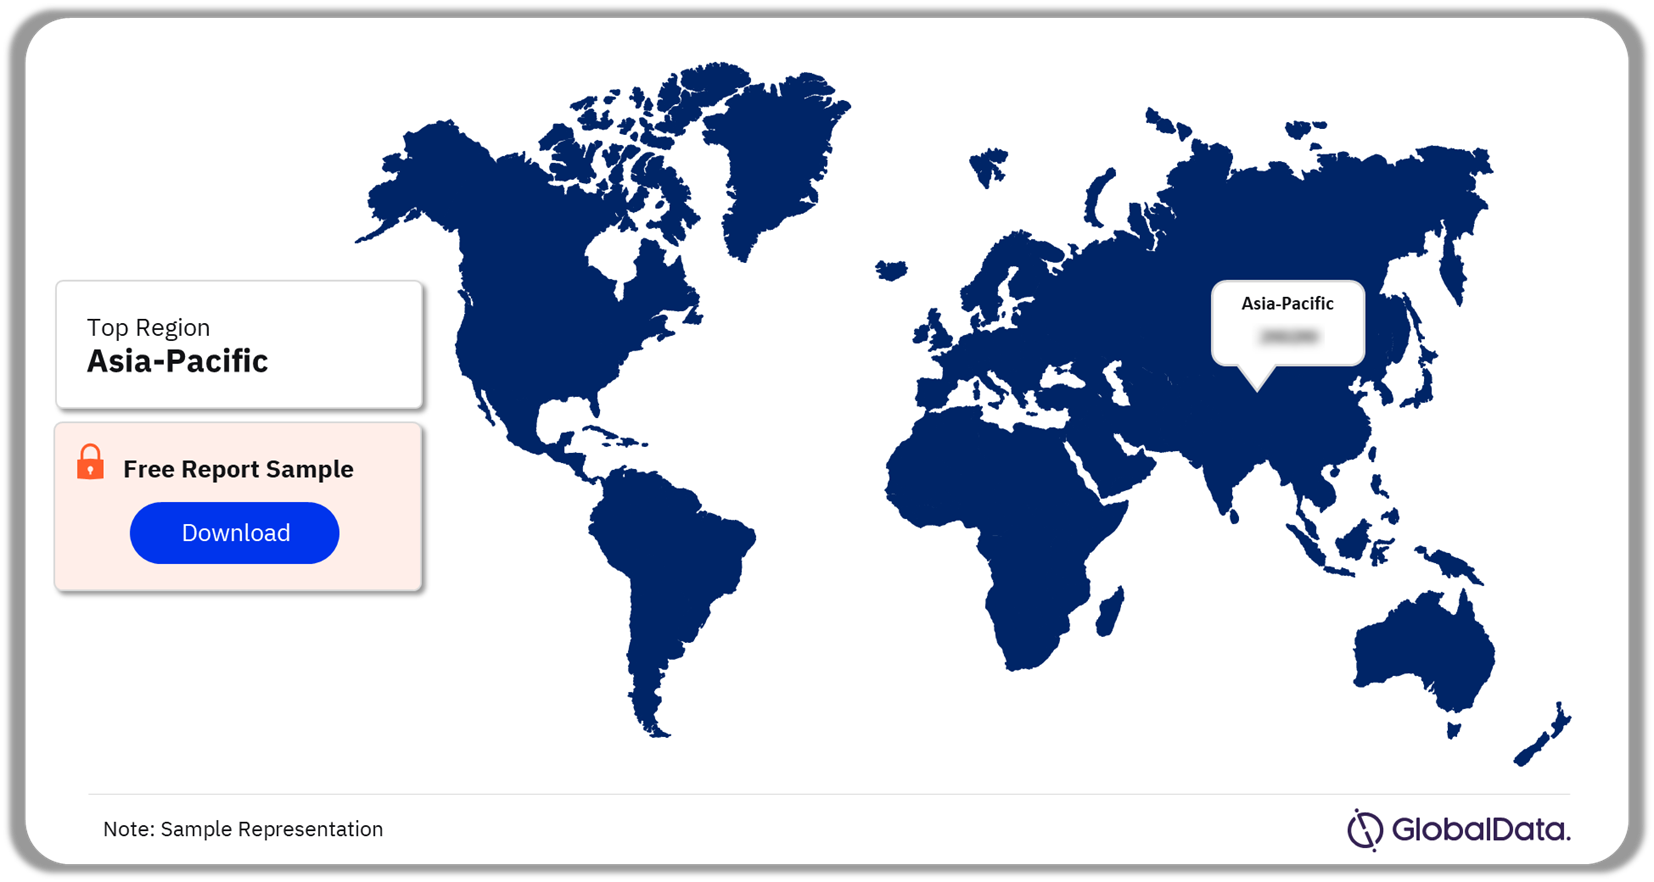
Enterprise IoT Market Analysis by Region

Asia Pacific’s enterprise IoT market value was the highest in 2023. In 2023, the US and China collectively led the regional demand, accounting for over 40% of the enterprise IoT market. The growing penetration of mobile 5G services along with increasing demand for smart cities will drive the regional enterprise IoT markets.

Enterprise Internet of Things Market Share by Region, 2023 (%)

Enterprise Internet of Things Market Share by Region, 2023 (%)

 Buy the Full Report for More Regional Insights into the Enterprise IoT Market

Download a Free Report Sample

The surge in IoT is propelled by several simultaneous advancements. Enterprises’ demand for process enhancements primarily drives the adoption of IoT-monitored conditional monitoring. Additionally, businesses are integrating IoT devices and technologies to enhance sustainability and diminish their ecological impact, following regulatory mandates. The deployment of 5G networks is anticipated to further bolster IoT adoption by providing faster connectivity for improved real-time monitoring. Moreover, the advent of IoT facilitates the rapid processing of extensive data collected at IoT nodes with minimum latency.

Enterprise IoT Market – Competitive Landscape

The overall competitive environment in the enterprise IoT sector is highly fragmented. Many venture capital firms are making substantial investments in innovative startups with cutting-edge capabilities. The consolidation of the enterprise IoT ecosystem through mergers and acquisitions appears to be a beneficial trend in simplifying the overly complex market. However, continued concerns from customers about purchasing and managing distinct components from various vendors potentially act as a threat to sufficient return on investments for key stakeholders.

In January 2024, Vodafone and Microsoft revealed a decade-long collaboration valued at $1.5 billion. The partnership aims to introduce generative AI (Gen AI), digital solutions, enterprise services, and cloud offerings to more than 300 businesses and public sector entities spanning Europe and Africa.

The key companies leading the enterprise IoT market include Microsoft Corp, Alphabet Inc., International Business Machines Corp, Samsung Electronics Co. Ltd., Intel Corp, Qualcomm Inc., Siemens AG, Amazon.com Inc., Huawei Investment & Holding Co Ltd, and Cisco Systems Inc., among others.

Leading Companies in the Enterprise IoT Market

  • Microsoft Corp
  • Alphabet Inc
  • Samsung Electronics Co Ltd
  • Intel Corp
  • Qualcomm Inc
  • Siemens AG
  • International Business Machines Corp
  • com Inc
  • Cisco Systems Inc
  • Huawei Investment & Holding Co Ltd

Other Enterprise IoT Market Vendors Mentioned

Schneider Electric SE, Nokia Corp, PTC Inc, SAP SE, NXP Semiconductors NV, STMicroelectronics NV, Accenture Plc, ABB Ltd, NVIDIA Corp, Honeywell International Inc, Dell Technologies Inc, Alibaba Group Holding Ltd, Dassault Systemes SE, and Telefonaktiebolaget LM Ericsson.

Buy the Full Report to Know More About Leading Enterprise IoT Companies Download a Free Report Sample

Enterprise IoT Market Segments

GlobalData Plc has segmented the Enterprise IoT market report by product, vertical, enterprise size, application, connectivity, and region:

Enterprise IoT Market Application Outlook (Revenue, $ Million, 2019-2027)

  • Industrial Internet
    • Condition Monitoring
    • Telematics
    • Asset Tracking
    • People & Animal Tracking
    • Environmental Monitoring
    • Advanced Automation
    • Healthcare
  • Smart Cities
    • Smart Metering
    • Smart City Platforms
    • Smart Buildings
    • Smart Signage
    • Smart Payment Systems

Enterprise IoT Market Product Outlook (Revenue, $ Million, 2019-2027)

  • IoT Hardware
  • IoT Software
  • IoT Services

Enterprise IoT Market Vertical Outlook (Revenue, $ Million, 2019-2027)

  • Government
  • Utilities
  • Manufacturing
  • Transport and Logistics
  • Energy
  • Insurance
  • Construction
  • Retail
  • Healthcare
  • Others

Enterprise IoT Market Enterprise Size Outlook (Revenue, $ Million, 2019-2027)

  • Micro (Less than 50)
  • Small (51-250)
  • Medium (251-1000)
  • Large (1001-4999)
  • Very Large (5000+)

Enterprise IoT Market Application Outlook (Revenue, $ Million, 2019-2027)

  • Condition Monitoring
  • Telematics
  • Asset Tracking
  • People & Animal Tracking
  • Environmental Monitoring
  • Advanced Automation
  • Healthcare
  • Smart Metering
  • Smart City Platforms
  • Smart Buildings
  • Smart Signage
  • Smart Payment Systems

Enterprise IoT Market Connectivity Outlook (Revenue, $ Million, 2019-2027)

  • Cellular
  • LoRa
  • LTE-M
  • NB-IoT
  • Satellite
  • Short Range
  • Sigfox
  • Wireline

Enterprise IoT Market Regional Outlook (Revenue, $ Million, 2019-2027)

  • North America
  • US
  • Canada
  • Mexico
  • Europe 
  • Germany
  • UK
  • Italy
  • France
  • Spain
  • The Netherlands
  • Rest of Europe
  • Asia Pacific 
  • China
  • Japan
  • India
  • Australia
  • Singapore
  • South Korea
  • Rest of Asia Pacific
  • South & Central America
  • Brazil
  • Argentina
  • Rest of South & Central America
  • Middle East & Africa
  • United Arab Emirates (UAE)
  • Kingdom of Saudi Arabia (KSA)
  • South Africa
  • Rest of the Middle East & Africa

Scope

This report provides overview and service addressable market for enterprise IoT.

It identifies the key trends impacting growth of the market over the next 12 to 24 months.

It includes global market forecasts for the Enterprise IoT industry and analysis of patents, company filings, and hiring trends.

It contains details of M&A and VF deals in the Enterprise IoT space.

The detailed value chain consists of five main aspects: IoT device layer, IoT connectivity layer, IoT data layer, IoT services layer, and IoT app layer

Key Highlights

The global enterprise Internet of Things (IoT) market size was valued at $683.6 billion in 2023 and is expected to grow at a compound annual growth rate (CAGR) of 17.3% during 2023-2027. The adoption of enterprise IoT will be supported by the emergence of Artificial Intelligence of Things (AIoT), mainly driven by advancements such as ChatGPT, increasing adoption of smart cities, and advancements in connectivity technologies like LoRaWAN, Sigfox, and Zigbee.

Reasons to Buy

This market intelligence report offers a thorough, forward-looking analysis of the global enterprise IoT market, product type, vertical, application, connectivity, region, key vendor outlook, and key opportunities in a concise format to help executives build proactive and profitable growth strategies.

Accompanying GlobalData’s Forecast products, the report examines the assumptions and drivers behind ongoing and upcoming trends in enterprise IoT market.

With more than 20 charts and tables, the report is designed for an executive-level audience, boasting presentation quality.

The report provides an easily digestible market assessment for decision-makers built around in-depth information gathered from local market players, which enables executives to quickly get up to speed with the current and emerging trends in Enterprise IoT market.

The broad perspective of the report coupled with comprehensive, actionable detail will help enterprise IoT companies, investors, and other stakeholders succeed in the growing enterprise IoT market globally.

Table of Contents

  • Chapter 01 Executive Summary

    • 1.1 Enterprise IoT Market Snapshot

  • Chapter 02 Research Scope & Segmentation

    • 2.1 Technology briefing

      • 2.1.1 Smart cities
      • 2.1.2 Industrial Internet

  • Chapter 03 Internet of Things Industry Trend Analysis

    • 3.1 Internet of Things – Industry Value Chain

      • 3.1.1 IoT Physical layer

        • 3.1.1.1 Connected Things
        • 3.1.1.2 Cameras and Lens Modules
        • 3.1.1.3 Sensors and microcontrollers
        • 3.1.1.4 Microprocessors

      • 3.1.2 IoT Connectivity Layer

        • 3.1.2.1 Edge infrastructure
        • 3.1.2.2 Cloud infrastructure
        • 3.1.2.3 Networking equipment
        • 3.1.2.4 Telecom networks

      • 3.1.3 IoT Data Layer

        • 3.1.3.2 Data governance and security
        • 3.1.3.3 Business intelligence
        • 3.1.3.4 Data analysis
        • 3.1.3.5 Data storage
        • 3.1.3.6 Data processing
        • 3.1.3.7 Data aggregation
        • 3.1.3.8 Data integration

      • 3.1.4 IoT App layer

        • 3.1.4.1 Apps
        • 3.1.4.2 App Enablement Platforms

      • 3.1.5 IoT Services Layer

        • 3.1.5.1 Integration services
        • 3.1.5.2 Consulting services

    • 3.2 Standards for IoT
    • 3.3 Business Benefits of Enterprise IoT
    • 3.4 Use Cases of Enterprise IoT

      • 3.4.1 Use Cases for Industrial Internet

        • 3.4.1.1 Agriculture
        • 3.4.1.2 Construction and engineering
        • 3.4.1.3 Energy and Utilities
        • 3.4.1.4 Manufacturing
        • 3.4.1.5 Mining
        • 3.4.1.6 Insurance

      • 3.4.2 Use Cases of Smart Cities

        • 3.4.2.1 Columbus, US
        • 3.4.2.2 Boston, US
        • 3.4.2.3 London, UK
        • 3.4.2.4 Seoul, South Korea
        • 3.4.2.5 Shanghai, China
        • 3.4.2.6 Wellington, New Zealand

    • 3.5 Enterprise IoT Market Structure – PORTER’s Analysis
    • 3.6 Enterprise IoT – Market Variables & Impact Analysis

      • 3.6.1 Market Driver Analysis

        • 3.6.1.1 The emergence of Artificial Intelligence of Things (AIoT)
        • 3.6.1.2 Advancements in Connectivity Technologies
        • 3.6.1.3 Increasing population and urbanization driving the proliferation of smart cities
        • 3.6.1.4 Rising Adoption of Edge Computing

      • 3.6.2 Market Challenges/Impediments

        • 3.6.2.1 Concerns regarding the use of AI in IoT products
        • 3.6.2.2 Insufficient technological awareness & shortage of skilled workforce
        • 3.6.2.3 Design & integration challenges
        • 3.6.2.4 Concerns regarding data privacy

    • 3.7 Enterprise IoT – Mergers & Acquisitions (M&A)

      • 3.7.1 M&A Activity Dashboard

    • 3.8 Enterprise IoT – Patent Analysis

      • 3.8.1 Patent Analytics Dashboard

    • 3.9 Enterprise IoT – Job Analysis

      • 3.9.1 Job Analytics Dashboard

    • 3.10 Enterprise IoT – Venture Financing Analysis

      • 3.10.1 Venture Financing Dashboard

    • 3.11 Social Media Analysis

      • 3.11.1 Social Media Analytics Dashboard

  • Chapter 04 Enterprise IoT Revenue Opportunity

    • 4.1 Market Revenue Snapshot
    • 4.2 Enterprise IoT Market by Product Type, 2019-2027 ($M)
    • 4.3 Enterprise IoT Market by Enterprise Size, 2019-2027 ($M)
    • 4.4 Enterprise IoT Market by Vertical, 2019-2027 ($M)
    • 4.5 Enterprise IoT Market by Application, 2019-2027 ($M)
    • 4.6 Enterprise IoT Market by Connectivity, 2019-2027 ($M)
    • 4.7 Enterprise IoT Market by Region, 2019-2027 ($M)

  • Chapter 05 Enterprise IoT Market By Product Type

    • 5.1 IoT Hardware
    • 5.2 IoT Software
    • 5.3 IoT Services

  • Chapter 06 Enterprise IoT Market By Vertical

    • 6.1 Government
    • 6.2 Utilities
    • 6.3 Manufacturing
    • 6.4 Transport and Logistics
    • 6.5 Energy
    • 6.6 Retail
    • 6.7 Insurance
    • 6.8 Construction
    • 6.9 Healthcare
    • 6.10 Others

  • Chapter 07 Enterprise IoT Market By Application

    • 7.1 Enterprise IoT Market Size & Forecast In Industrial Internet, 2019-2027 ($M)

      • 7.1.1 Condition Monitoring
      • 7.1.2 Telematics
      • 7.1.3 Asset Tracking
      • 7.1.4 People & Animal Tracking
      • 7.1.5 Environmental Monitoring
      • 7.1.6 Advanced Automation
      • 7.1.7 Healthcare

    • 7.2 Enterprise IoT Market Size & Forecast In Smart Cities, 2019-2027 ($M)

      • 7.2.1 Smart Metering
      • 7.2.2 Smart City Platforms
      • 7.2.3 Smart Buildings
      • 7.2.4 Smart Signage
      • 7.2.5 Smart Payment Systems

  • Chapter 08 Enterprise IoT Regional Outlook

    • 8.1 Enterprise IoT Market By Region
    • 8.2 Enterprise IoT – Regional Deep Dive
    • 8.3 North America Enterprise IoT Market Snapshot

      • 8.3.1 North America Enterprise IoT Market By Product, 2019 – 2027 ($M)
      • 8.3.2 North America Enterprise IoT Market By Vertical, 2019 – 2027 ($M)
      • 8.3.3 North America Enterprise IoT Market By Enterprise Size, 2019 – 2027 ($M)
      • 8.3.4 US Enterprise IoT Market

        • 8.3.4.1 US Enterprise IoT Market By Product, 2019 – 2027 ($M)
        • 8.3.4.2 US Enterprise IoT Market By Vertical, 2019 – 2027 ($M)
        • 8.3.4.3 US Enterprise IoT Market By Enterprise Size, 2019 – 2027 ($M)

      • 8.3.5 Canada Enterprise IoT Market

        • 8.3.5.1 Canada Enterprise IoT Market by Product, 2019 – 2027 ($M)
        • 8.3.5.2 Canada Enterprise IoT Market By Vertical, 2019 – 2027 ($M)
        • 8.3.5.3 Canada Enterprise IoT Market By Enterprise Size, 2019 – 2027 ($M)

      • 8.3.6 Mexico enterprise IoT market

        • 8.3.6.1 Mexico Enterprise IoT Market By Product, 2019 – 2027 ($M)
        • 8.3.6.2 Mexico Enterprise IoT Market By Vertical, 2019 – 2027 ($M)
        • 8.3.6.3 Mexico Enterprise IoT Market By Enterprise Size, 2019 – 2027 ($M)

    • 8.4 Europe Enterprise IoT Market Snapshot

      • 8.4.1 Europe Enterprise IoT Market By Product, 2019 – 2027 ($M)
      • 8.4.2 Europe Enterprise IoT Market By Vertical, 2019 – 2027 ($M)
      • 8.4.3 Europe Enterprise IoT Market By Enterprise Size, 2019 – 2027 ($M)
      • 8.4.4 Germany Enterprise IoT Market

        • 8.4.4.1 Germany Enterprise IoT Market By Product, 2019 – 2027 ($M)
        • 8.4.4.2 Germany Enterprise IoT Market By Vertical, 2019 – 2027 ($M)
        • 8.4.4.3 Germany Enterprise IoT Market By Enterprise Size, 2019 – 2027 ($M)

      • 8.4.5 UK Enterprise IoT Market

        • 8.4.5.1 UK Enterprise IoT Market By Product, 2019 – 2027 ($M)
        • 8.4.5.2 UK Enterprise IoT Market By Vertical, 2019 – 2027 ($M)
        • 8.4.5.3 UK Enterprise IoT Market By Enterprise Size, 2019 – 2027 ($M)

      • 8.4.6 France Enterprise IoT Market

        • 8.4.6.1 France Enterprise IoT Market By Product, 2019 – 2027 ($M)
        • 8.4.6.2 France Enterprise IoT Market By Vertical, 2019 – 2027 ($M)
        • 8.4.6.3 France Enterprise IoT Market By Enterprise Size, 2019 – 2027 ($M)

      • 8.4.7 Italy Enterprise IoT Market

        • 8.4.7.1 Italy Enterprise IoT Market By Product, 2019 – 2027 ($M)
        • 8.4.7.2 Italy Enterprise IoT Market By Vertical, 2019 – 2027 ($M)
        • 8.4.7.3 Italy Enterprise IoT Market By Enterprise Size, 2019 – 2027 ($M)

      • 8.4.8 Spain Enterprise IoT Market

        • 8.4.8.1 Spain Enterprise IoT Market By Product, 2019 – 2027 ($M)
        • 8.4.8.2 Spain Enterprise IoT Market By Vertical, 2019 – 2027 ($M)
        • 8.4.8.3 Spain Enterprise IoT Market By Enterprise Size, 2019 – 2027 ($M)

      • 8.4.9 Netherlands Enterprise IoT Market

        • 8.4.9.1 Netherlands Enterprise IoT Market BY Product, 2019 – 2027 ($M)
        • 8.4.9.2 Netherlands Enterprise IoT Market By Vertical, 2019 – 2027 ($M)
        • 8.4.9.3 Netherlands Enterprise IoT Market By Enterprise Size, 2019 – 2027 ($M)

      • 8.4.10 Rest of Europe Enterprise IoT Market

        • 8.4.10.1 Rest of Europe Enterprise IoT Market By Product, 2019 – 2027 ($M)
        • 8.4.10.2 Rest of Europe Enterprise IoT Market By Vertical, 2019 – 2027 ($M)
        • 8.4.10.3 Rest Of Europe Enterprise IoT Market By Enterprise Size, 2019 – 2027 ($M)

    • 8.5 South & Central America Enterprise IoT Market Snapshot

      • 8.5.1 South & Central America Enterprise IoT Market By Product, 2019 – 2027 ($M)
      • 8.5.2 South & Central America Enterprise IoT Market By Vertical, 2019 – 2027 ($M)
      • 8.5.3 South & Central America Enterprise IoT Market By Enterprise Size, 2019 – 2027 ($M)
      • 8.5.4 Brazil Enterprise IoT Market

        • 8.5.4.1 Brazil Enterprise IoT Market By Product, 2019 – 2027 ($M)
        • 8.5.4.2 Brazil Enterprise IoT Market By Vertical, 2019 – 2027 ($M)
        • 8.5.4.3 Brazil Enterprise IoT Market By Enterprise Size, 2019 – 2027 ($M)

      • 8.5.5 Argentina Enterprise IoT Market

        • 8.5.5.1 Argentina Enterprise IoT Market By Product, 2019 – 2027 ($M)
        • 8.5.5.2 Argentina Enterprise IoT Market By Vertical, 2019 – 2027 ($M)
        • 8.5.5.3 Argentina Enterprise IoT Market By Enterprise Size, 2019 – 2027 ($M)

      • 8.5.6 Rest of South & Central America Enterprise IoT Market

        • 8.5.6.1 Rest of South & Central America enterprise IoT market by Product, 2019 – 2027 ($M)
        • 8.5.6.2 Rest of south & central America Enterprise IoT market by Vertical, 2019 – 2027 ($M)
        • 8.5.6.3 Rest of South and Central America Enterprise IoT Market By Enterprise Size, 2019 – 2027 ($M)

    • 8.6 APAC Enterprise IoT Market Snapshot

      • 8.6.1 APAC Enterprise IoT Market By Product, 2019 – 2027 ($M)
      • 8.6.2 APAC Enterprise IoT Market By Vertical, 2019 – 2027 ($M)
      • 8.6.3 APAC Enterprise IoT Market By Enterprise Size, 2019 – 2027 ($M)
      • 8.6.4 China Enterprise IoT Market

        • 8.6.4.1 China Enterprise IoT Market By Product, 2019 – 2027 ($M)
        • 8.6.4.2 China Enterprise IoT Market By Vertical, 2019 – 2027 ($M)
        • 8.6.4.3 China Enterprise IoT Market By Enterprise Size, 2019 – 2027 ($M)

      • 8.6.5 Japan Enterprise IoT Market

        • 8.6.5.1 Japan Enterprise IoT Market By Product, 2019 – 2027 ($M)
        • 8.6.5.2 Japan Enterprise IoT Market By Vertical, 2019 – 2027 ($M)
        • 8.6.5.3 Japan Enterprise IoT Market By Enterprise Size, 2019 – 2027 ($M)

      • 8.6.6 Australia Enterprise IoT Market

        • 8.6.6.1 Australia Enterprise IoT Market By Product, 2019 – 2027 ($M)
        • 8.6.6.2 Australia Enterprise IoT Market By Vertical, 2019 – 2027 ($M)
        • 8.6.6.3 Australia Enterprise IoT Market By Enterprise Size, 2019 – 2027 ($M)

      • 8.6.7 India Enterprise IoT Market

        • 8.6.7.1 India Enterprise IoT Market By Product, 2019 – 2027 ($M)
        • 8.6.7.2 India Enterprise IoT Market By Vertical, 2019 – 2027 ($M)
        • 8.6.7.3 India Enterprise IoT Market By Enterprise Size, 2019 – 2027 ($M)

      • 8.6.8 Singapore Enterprise IoT Market

        • 8.6.8.1 Singapore Enterprise IoT Market By Product, 2019 – 2027 ($M)
        • 8.6.8.2 Singapore Enterprise IoT Market By Vertical, 2019 – 2027 ($M)
        • 8.6.8.3 Singapore Enterprise IoT Market By Enterprise Size, 2019 – 2027 ($M)

      • 8.6.9 South Korea Enterprise IoT Market

        • 8.6.9.1 South Korea Enterprise IoT Market By Product, 2019 – 2027 ($M)
        • 8.6.9.2 South Korea Enterprise IoT Market By Vertical, 2019 – 2027 ($M)
        • 8.6.9.3 South Korea Enterprise IoT Market By Enterprise Size, 2019 – 2027 ($M)

      • 8.6.10 Rest of APAC Enterprise IoT Market

        • 8.6.10.1 Rest of APAC Enterprise IoT Market By Product, 2019 – 2027 ($M)
        • 8.6.10.2 Rest of APAC Enterprise IoT Market By Vertical, 2019 – 2027 ($M)
        • 8.6.10.3 Rest of APAC Enterprise IoT Market By Enterprise Size, 2019 – 2027 ($M)

    • 8.7 Middle East & Africa Enterprise IoT Market Snapshot

      • 8.7.1 Middle East & Africa Enterprise IoT Market By Product, 2019 – 2027 ($M)
      • 8.7.2 Middle East & Africa Enterprise IoT Market By Vertical, 2019 – 2027 ($M)
      • 8.7.3 Middle East & Africa Enterprise IoT Market By Enterprise Size, 2019 – 2027 ($M)
      • 8.7.4 United Arab Emirates Enterprise IoT Market

        • 8.7.4.1 United Arab Emirates Enterprise IoT Market By Product, 2019 – 2027 ($M)
        • 8.7.4.2 United Arab Emirates Enterprise IoT Market By Vertical, 2019 – 2027 ($M)
        • 8.7.4.3 United Arab Emirates Enterprise IoT Market By Enterprise Size, 2019 – 2027 ($M)

      • 8.7.5 Saudi Arabia Enterprise IoT Market

        • 8.7.5.1 Saudi Arabia Enterprise IoT Market By Product, 2019 – 2027 ($M)
        • 8.7.5.2 Saudi Arabia Enterprise IoT Market By Vertical, 2019 – 2027 ($M)
        • 8.7.5.3 Saudi Arabia Enterprise IoT Market By Enterprise Size, 2019 – 2027 ($M)

      • 8.7.6 South Africa Enterprise IoT Market

        • 8.7.6.1 South Africa Enterprise IoT Market By Product, 2019 – 2027 ($M)
        • 8.7.6.2 South Africa Enterprise IoT Market By Vertical, 2019 – 2027 ($M)
        • 8.7.6.3 South Africa Enterprise IoT Market By Enterprise Size, 2019 – 2027 ($M)

      • 8.7.7 Rest of MEA Enterprise IoT Market

        • 8.7.7.1 Rest of MEA Enterprise IoT Market By Product, 2019 – 2027 ($M)
        • 8.7.7.2 Rest of MEA Enterprise IoT Market By Vertical, 2019 – 2027 ($M)
        • 8.7.7.3 Rest of MEA Enterprise IoT Market By Enterprise Size, 2019 – 2027 ($M)

  • Chapter 09 Enterprise IoT Competitive Landscape

    • 9.1 Enterprise IoT Competitive Index
    • 9.2 Enterprise IoT Key Company Profiles

      • 9.2.1 Microsoft Corp.

        • 9.2.1.1 Company overview and financial performance
        • 9.2.1.2 Recent developments and innovations

      • 9.2.2 Alphabet Inc.

        • 9.2.2.1 Company overview and financial performance
        • 9.2.2.2 Recent developments and innovations

      • 9.2.3 Samsung Electronics Co Ltd

        • 9.2.3.1 Company overview and financial performance
        • 9.2.3.2 Recent developments and innovations

      • 9.2.4 Intel Corp

        • 9.2.4.1 Company overview and financial performance
        • 9.2.4.2 Recent developments and innovations

      • 9.2.5 Qualcomm Inc

        • 9.2.5.1 Company overview and financial performance
        • 9.2.5.2 Recent developments and innovations

      • 9.2.6 Siemens AG

        • 9.2.6.1 Company overview and financial performance
        • 9.2.6.2 Recent developments and innovations

      • 9.2.7 International Business Machines Corp

        • 9.2.7.1 Company overview and financial performance
        • 9.2.7.2 Recent developments and innovations

      • 9.2.8 Amazon.com Inc

        • 9.2.8.1 Company overview and financial performance
        • 9.2.8.2 Recent developments and innovations

      • 9.2.9 Cisco Systems Inc

        • 9.2.9.1 Company overview and financial performance
        • 9.2.9.2 Recent developments and innovations

      • 9.2.10 Huawei Investment & Holding Co Ltd

        • 9.2.10.1 Company overview and financial performance
        • 9.2.10.2 Recent developments and innovations

    • 9.3 Other Major Participants in the Enterprise IoT Market Include the following –

      • 9.3.1 Schneider Electric SE
      • 9.3.2 Nokia Corp
      • 9.3.3 PTC Inc
      • 9.3.4 SAP SE
      • 9.3.5 NXP Semiconductors NV
      • 9.3.6 STMicroelectronics NV
      • 9.3.7 Accenture Plc
      • 9.3.8 ABB Ltd
      • 9.3.9 NVIDIA Corp
      • 9.3.10 Honeywell International Inc
      • 9.3.11 Dell Technologies Inc
      • 9.3.12 Alibaba Group Holding Ltd
      • 9.3.13 Dassault Systemes SE
      • 9.3.14 Telefonaktiebolaget LM Ericsson

  • Chapter 10 Methodology and Scope

    • 10.1 Information Procurement
    • 10.2 Enterprise IoT Analysis
    • 10.3 Market Opportunity Forecast – Research Methodology & Formulation
    • 10.4 Competitive Index – Research Methodology & Formulation
    • 10.5 Additional Resources

      • 10.5.1 Market Definitions

Table

Table 1 Key Trends Overview

Table 2 Enterprise IoT Market By Product Type, 2019 – 2027 ($M)

Table 3 Enterprise IoT Market By Enterprise Size, 2019 – 2027 ($M)

Table 4 Enterprise IoT Market By Vertical, 2019 – 2027 ($M)

Table 5 Enterprise IoT Market By Application, 2019 – 2027 ($M)

Table 6 Enterprise IoT Services Market By Connectivity, 2019 – 2027 ($M)

Table 7 Enterprise IoT Market By Region, 2019 – 2027 ($M)

Table 8 Enterprise IoT Market By Industrial Internet Application, 2019 – 2027 ($M)

Table 9 Enterprise IoT Market By Smart Cities Application, 2019 – 2027 ($M)

Table 10 Enterprise IoT Market By Region, 2019 – 2027 ($M)

Table 11 North America Enterprise IoT Market By Product, 2019 – 2027 ($M)

Table 12 North America Enterprise IoT Market By Vertical, 2019 – 2027 ($M)

Table 13 North America Enterprise IoT Market By Enterprise Size, 2019 – 2027 ($M)

Table 14 US Enterprise IoT Market By Product, 2019 – 2027 ($M)

Table 15 US Enterprise IoT Market By Vertical, 2019 – 2027 ($M)

Table 16 US Enterprise IoT Market By Enterprise Size, 2019 – 2027 ($M)

Table 17 Canada Enterprise IoT Market By Product, 2019 – 2027 ($M)

Table 18 Canada Enterprise IoT Market By Vertical, 2019 – 2027 ($M)

Table 19 Canada Enterprise IoT Market By Enterprise Size, 2019 – 2027 ($M)

Table 20 Mexico Enterprise IoT Market By Product, 2019 – 2027 ($M)

Table 21 Mexico Enterprise IoT Market By Vertical, 2019 – 2027 ($M)

Table 22 Mexico Enterprise IoT Market By Enterprise Size, 2019 – 2027 ($M)

Table 23 Europe Enterprise IoT Market By Product, 2019 – 2027 ($M)

Table 24 Europe Enterprise IoT Market By Vertical, 2019 – 2027 ($M)

Table 25 Europe Enterprise IoT Market By Enterprise Size, 2019 – 2027 ($M)

Table 26 Germany Enterprise IoT Market By Product, 2019 – 2027 ($M)

Table 27 Germany Enterprise IoT Market By Vertical, 2019 – 2027 ($M)

Table 28 Germany Enterprise IoT Market By Enterprise Size, 2019 – 2027 ($M)

Table 29 UK Enterprise IoT Market By Product, 2019 – 2027 ($M)

Table 30 UK Enterprise IoT Market By Vertical, 2019 – 2027 ($M)

Table 31 UK Enterprise IoT Market By Enterprise Size, 2019 – 2027 ($M)

Table 32 France Enterprise IoT Market By Product, 2019 – 2027 ($M)

Table 33 France Enterprise IoT Market By Vertical, 2019 – 2027 ($M)

Table 34 France Enterprise IoT Market By Enterprise Size, 2019 – 2027 ($M)

Table 35 Italy Enterprise IoT Market By Product, 2019 – 2027 ($M)

Table 36 Italy Enterprise IoT Market By Vertical, 2019 – 2027 ($M)

Table 37 Italy Enterprise IoT Market By Enterprise Size, 2019 – 2027 ($M)

Table 38 Spain Enterprise IoT Market By Product, 2019 – 2027 ($M)

Table 39 Spain Enterprise IoT Market By Vertical, 2019 – 2027 ($M)

Table 40 Spain Enterprise IoT Market By Enterprise Size, 2019 – 2027 ($M)

Table 41 Netherlands Enterprise IoT Market By Product, 2019 – 2027 ($M)

Table 42 Netherlands Enterprise IoT Market By Vertical, 2019 – 2027 ($M)

Table 43 Netherlands Enterprise IoT Market By Enterprise Size, 2019 – 2027 ($M)

Table 44 Rest of Europe Enterprise IoT Market By Product, 2019 – 2027 ($M)

Table 45 Rest of Europe Enterprise IoT Market By Vertical, 2019 – 2027 ($M)

Table 46 Rest of Europe Enterprise IoT Market By Enterprise Size, 2019 – 2027 ($M)

Table 47 South & Central America Enterprise IoT Market By Product, 2019 – 2027 ($M)

Table 48 South & Central America Enterprise IoT Market By Vertical, 2019 – 2027 ($M)

Table 49 South & Central America Enterprise IoT Market By Enterprise Size, 2019 – 2027 ($M)

Table 50 Brazil Enterprise IoT Market By Product, 2019 – 2027 ($M)

Table 51 Brazil Enterprise IoT Market By Vertical, 2019 – 2027 ($M)

Table 52 Brazil Enterprise IoT Market By Enterprise Size, 2019 – 2027 ($M)

Table 53 Argentina Enterprise IoT Market By Product, 2019 – 2027 ($M)

Table 54 Argentina Enterprise IoT Market By Vertical, 2019 – 2027 ($M)

Table 55 Argentina Enterprise IoT Market By Enterprise Size, 2019 – 2027 ($M)

Table 56 Rest of South & Central America Enterprise IoT Market By Product, 2019 – 2027 ($M)

Table 57 Rest of South and Central America Enterprise IoT Market By Vertical, 2019 – 2027 ($M)

Table 58 Rest of South and Central America Enterprise IoT Market By Enterprise Size, 2019 – 2027 ($M)

Table 59 APAC Enterprise IoT Market By Product, 2019 – 2027 ($M)

Table 60 APAC Enterprise IoT Market By Vertical, 2019 – 2027 ($M)

Table 61 APAC Enterprise IoT Market By Enterprise Size, 2019 – 2027 ($M)

Table 62 China Enterprise IoT Market By Product, 2019 – 2027 ($M)

Table 63 China Enterprise IoT Market By Vertical, 2019 – 2027 ($M)

Table 64 China Enterprise IoT Market By Enterprise Size, 2019 – 2027 ($M)

Table 65 Japan Enterprise IoT Market By Product, 2019 – 2027 ($M)

Table 66 Japan Enterprise IoT Market By Vertical, 2019 – 2027 ($M)

Table 67 Japan Enterprise IoT Market By Enterprise Size, 2019 – 2027 ($M)

Table 68 Australia Enterprise IoT Market By Product, 2019 – 2027 ($M)

Table 69 Australia Enterprise IoT Market By Vertical, 2019 – 2027 ($M)

Table 70 Australia Enterprise IoT Market By Enterprise Size, 2019 – 2027 ($M)

Table 71 India Enterprise IoT Market By Product, 2019 – 2027 ($M)

Table 72 India Enterprise IoT Market By Vertical, 2019 – 2027 ($M)

Table 73 India Enterprise IoT Market By Enterprise Size, 2019 – 2027 ($M)

Table 74 Singapore Enterprise IoT Market By Product, 2019 – 2027 ($M)

Table 75 Singapore Enterprise IoT Market By Vertical, 2019 – 2027 ($M)

Table 76 Singapore Enterprise IoT Market By Enterprise Size, 2019 – 2027 ($M)

Table 77 South Korea Enterprise IoT Market By Product, 2019 – 2027 ($M)

Table 78 South Korea Enterprise IoT Market By Vertical, 2019 – 2027 ($M)

Table 79 South Korea Enterprise IoT Market By Enterprise Size, 2019 – 2027 ($M)

Table 80 Rest of APAC Enterprise IoT Market By Product, 2019 – 2027 ($M)

Table 81 Rest of APAC Enterprise IoT Market By Vertical, 2019 – 2027 ($M)

Table 82 Rest of APAC Enterprise IoT Market By Enterprise Size, 2019 – 2027 ($M)

Table 83 Middle East & Africa Enterprise IoT Market By Product, 2019 – 2027 ($M)

Table 84 Middle East & Africa Enterprise IoT Market By Vertical, 2019 – 2027 ($M)

Table 85 Middle East & Africa Enterprise IoT Market By Enterprise Size, 2019 – 2027 ($M)

Table 86 United Arab Emirates Enterprise IoT Market By Product, 2019 – 2027 ($M)

Table 87 United Arab Emirates Enterprise IoT Market By Vertical, 2019 – 2027 ($M)

Table 88 United Arab Emirates Enterprise IoT Market By Enterprise Size, 2019 – 2027 ($M)

Table 89 Saudi Arabia Enterprise IoT Market By Product, 2019 – 2027 ($M)

Table 90 Saudi Arabia Enterprise IoT Market By Vertical, 2019 – 2027 ($M)

Table 91 Saudi Arabia Enterprise IoT Market By Enterprise Size, 2019 – 2027 ($M)

Table 92 South Africa Enterprise IoT Market By Product, 2019 – 2027 ($M)

Table 93 South Africa Enterprise IoT Market By Vertical, 2019 – 2027 ($M)

Table 94 South Africa Enterprise IoT Market By Enterprise Size, 2019 – 2027 ($M)

Table 95 Rest of MEA Enterprise IoT Market By Product, 2019 – 2027 ($M)

Table 96 Rest of MEA Enterprise IoT Market By Vertical, 2019 – 2027 ($M)

Table 97 Rest of MEA Enterprise IoT Market By Enterprise Size, 2019 – 2027 ($M)

Table 98 Other major participants in the Enterprise IoT Market

Figures

Fig.1 Market Snapshot

Fig.2 Enterprise IoT Sector Overview

Fig.3 Enterprise IoT Market Scope & Segmentation

Fig.4 Enterprise IoT Market Segmentation

Fig.5 Industry value chain analysis

Fig.6 Standards for IoT

Fig.7 Enterprise IoT PORTER’s Five Force Analysis

Fig.8 Enterprise IoT – M&A Activity Dashboard

Fig.9 Enterprise IoT – Patent Activity Dashboard

Fig.10 Enterprise IoT – Job Analytics Dashboard

Fig.11 Enterprise IoT – Venture Financing Dashboard

Fig.12 IoT – Social Media Analytics Dashboard

Fig.13 Enterprise IoT Market – Revenue Opportunity Forecast, 2019-2027 ($M)

Fig 14 Enterprise IoT Market By Product Type, 2019-2027 ($M)

Fig 15 Enterprise IoT Market By Enterprise Size, 2019-2027 ($M)

Fig.16 Enterprise IoT Market By Application, 2019-2027 ($M)

Fig.17 Enterprise IoT Market By Region, 2019-2027 ($M)

Fig 18 Enterprise IoT Market By Product Type, 2023 & 2027 (%share)

Fig 19 Enterprise IoT Market By Vertical, 2023 & 2027 (%share)

Fig.20 Enterprise IoT Market By Application, 2023 & 2027 (%share)

Fig 21 Enterprise IoT Market By Industrial Internet Application, 2023 & 2027 (%share)

Fig 22 Enterprise IoT Market By Smart Cities Application, 2019-2027 (%share)

Fig.23 Enterprise IoT Market By Region, 2023 & 2027 ($M)

Fig.24 Enterprise IoT – Regional Market Overview

Fig.25 North America Enterprise IoT Market Snapshot

Fig.26 North America Enterprise IoT By Product Share – 2023 & 2027 (%)

Fig 27 North America Enterprise IoT Market By Vertical Share – 2023 & 2027 (%)

Fig 28 North America Enterprise IoT Market By Enterprise Size – 2023 & 2027 ($M)

Fig 29 US Enterprise IoT Market By Product Share – 2023 & 2027 (%)

Fig 30 US Enterprise IoT Market By Vertical Share – 2023 & 2027 (%)

Fig.31 US Enterprise IoT Market By Enterprise Size – 2023 & 2027 ($M)

Fig.32 Canada Enterprise IoT Hardware Market By Product – 2023 & 2027 (%)

Fig 33 Canada Enterprise IoT Market By Vertical Share – 2023 & 2027 (%)

Fig.34 Canada Enterprise IoT Market By Enterprise Size – 2023 & 2027 ($M)

Fig 35 Mexico Enterprise IoT Market By Product Share – 2023 & 2027 (%)

Fig.36 Mexico Enterprise IoT Vertical Share – 2023 & 2027 (%)

Fig 37 Mexico Enterprise IoT Market By Enterprise Size – 2023 & 2027 ($M)

Fig.38 Europe Enterprise IoT Market Snapshot

Fig 39 Europe Enterprise IoT Market By Product Share – 2023 & 2027 (%)

Fig.40 Europe Enterprise IoT Vertical Share – 2023 & 2027 (%)

Fig.41 Europe Enterprise IoT Market By Enterprise Size – 2023 & 2027 ($M)

Fig 42 Germany Enterprise IoT Market By Product Share – 2023 & 2027 (%)

Fig.43 Germany Enterprise IoT Vertical Share – 2023 & 2027 (%)

Fig.44 Germany Enterprise IoT Market By Enterprise Size – 2023 & 2027 ($M)

Fig.45 UK Enterprise IoT Market By Product Share – 2023 & 2027 (%)

Fig.46 UK Enterprise IoT Vertical Share – 2023 & 2027 (%)

Fig.47 UK Enterprise IoT Market By Enterprise Size – 2023 & 2027 ($M)

Fig.48 France Enterprise IoT Market By Product Share – 2023 & 2027 (%)

Fig.49 France Enterprise IoT Vertical Share – 2023 & 2027 (%)

Fig.50 France Enterprise IoT Market By Enterprise Size – 2023 & 2027 ($M)

Fig 51 Italy Enterprise IoT Market By Product Share – 2023 & 2027 (%)

Fig.52 Italy Enterprise IoT Vertical Share – 2023 & 2027 (%)

Fig.53 Italy Enterprise IoT Market By Enterprise Size – 2023 & 2027 ($M)

Fig.54 Spain Enterprise IoT Market By Product Share – 2023 & 2027 (%)

Fig.55 Spain Enterprise IoT Vertical Share – 2023 & 2027 (%)

Fig.56 Spain Enterprise IoT Market By Enterprise Size – 2023 & 2027 ($M)

Fig.57 Netherlands Enterprise IoT Market By Product Share – 2023 & 2027 (%)

Fig.58 Netherlands Enterprise IoT Vertical Share – 2023 & 2027 (%)

Fig.59 Netherlands Enterprise IoT Market By Enterprise Size – 2023 & 2027 ($M)

Fig.60 Rest of Europe Enterprise IoT Product Share – 2023 & 2027 (%)

Fig.61 Rest of Europe Enterprise IoT Vertical Share – 2023 & 2027 (%)

Fig.62 Rest Of Europe Enterprise IoT Market By Enterprise Size – 2023 & 2027 ($M)

Fig.63 South & Central America Enterprise IoT Market Snapshot

Fig.64 South & Central America Enterprise IoT Market By Product Share – 2023 & 2027 (%)

Fig.65 South & Central America Enterprise IoT Vertical Share – 2023 & 2027 (%)

Fig.66 South & Central America Enterprise IoT Market By Enterprise Size – 2023 & 2027 ($M)

Fig 67 Brazil Enterprise IoT Market By Product Share – 2023 & 2027 (%)

Fig.68 Brazil Enterprise IoT Vertical Share – 2023 & 2027 (%)

Fig.69 Brazil Enterprise IoT Market By Enterprise Size – 2023 & 2027 ($M)

Fig 70 Argentina Enterprise IoT Market By Product Share – 2023 & 2027 (%)

Fig.71 Argentina Enterprise IoT Vertical Share – 2023 & 2027 (%)

Fig.72 Argentina Enterprise IoT Market By Enterprise Size – 2023 & 2027 ($M)

Fig.73 Rest of South and Central America Enterprise IoT Market By Product Share – 2023 & 2027 (%)

Fig.74 Rest of South and Central America Enterprise IoT Vertical Share – 2023 & 2027 (%)

Fig 75 Rest of South and Central America Enterprise IoT Market By Enterprise Size – 2023 & 2027 ($M)

Fig.76 APAC Enterprise IoT Market Snapshot

Fig.77 APAC Enterprise IoT Market By Product Share – 2023 & 2027 (%)

Fig.78 APAC Enterprise IoT Vertical Share – 2023 & 2027 (%)

Fig.79 APAC Enterprise IoT Market By Enterprise Size – 2023 & 2027 ($M)

Fig 80 China Enterprise IoT Market By Product Share – 2023 & 2027 (%)

Fig.81 China Enterprise IoT Vertical Share – 2023 & 2027 (%)

Fig 82 China Enterprise IoT Market By Enterprise Size – 2023 & 2027 ($M)

Fig 83 Japan Enterprise IoT Market By Product Share – 2023 & 2027 (%)

Fig.84 Japan Enterprise IoT Vertical Share – 2023 & 2027 (%)

Fig.85 Japan Enterprise IoT Market By Enterprise Size – 2023 & 2027 ($M)

Fig.86 Australia Enterprise IoT Market By Product Share – 2023 & 2027 (%)

Fig.87 Australia Enterprise IoT Vertical Share – 2023 & 2027 (%)

Fig.88 Australia Enterprise IoT Market By Enterprise Size – 2023 & 2027 ($M)

Fig 89 India Enterprise IoT Market By Product Share – 2023 & 2027 (%)

Fig.90 India Enterprise IoT Vertical Share – 2023 & 2027 (%)

Fig.91 India Enterprise IoT Market By Enterprise Size – 2023 & 2027 ($M)

Fig 92 Singapore Enterprise IoT Market By Product Share – 2023 & 2027 (%)

Fig.93 Singapore Enterprise IoT Vertical Share – 2023 & 2027 (%)

Fig.94 Singapore Enterprise IoT Market By Enterprise Size – 2023 & 2027 ($M)

Fig 95 South Korea Enterprise IoT Market By Product Share – 2023 & 2027 (%)

Fig.96 South Korea Enterprise IoT Vertical Share – 2023 & 2027 (%)

Fig 97 South Korea Enterprise IoT Market By Enterprise Size – 2023 & 2027 ($M)

Fig.98 Rest of APAC Enterprise IoT Market By Product Share – 2023 & 2027 (%)

Fig.99 Rest of APAC Enterprise IoT Vertical Share – 2023 & 2027 (%)

Fig.100 Rest of APAC Enterprise IoT Market By Enterprise Size – 2023 & 2027 ($M)

Fig.101 Middle East & Africa Enterprise IoT Market Snapshot

Fig.102 Middle East & Africa Enterprise IoT Market By Product Share – 2023 & 2027 (%)

Fig.103 Middle East & Africa Enterprise IoT Vertical Share – 2023 & 2027 (%)

Fig.104 Middle East & Africa Enterprise IoT Market By Enterprise Size – 2023 & 2027 ($M)

Fig.105 United Arab Emirates Enterprise IoT Market By Product Share – 2023 & 2027 (%)

Fig 106 the United Arab Emirates Enterprise IoT Vertical Share – 2023 & 2027 (%)

Fig.107 United Arab Emirates Enterprise IoT Market By Enterprise Size – 2023 & 2027 ($M)

Fig 108 Saudi Arabia Enterprise IoT Market By Product Share – 2023 & 2027 (%)

Fig.109 Saudi Arabia Enterprise IoT Vertical Share – 2023 & 2027 (%)

Fig.110 Saudi Arabia Enterprise IoT Market By Enterprise Size – 2023 & 2027 ($M)

Fig.111 South Africa Enterprise IoT Market By Product Share – 2023 & 2027 (%)

Fig.112 South Africa Enterprise IoT Vertical Share – 2023 & 2027 (%)

Fig.113 South Africa Enterprise IoT Market By Enterprise Size – 2023 & 2027 ($M)

Fig.114 Rest of MEA Enterprise IoT Market By Product Share – 2023 & 2027 (%)

Fig.115 Rest of MEA Enterprise IoT Vertical Share – 2023 & 2027 (%)

Fig.116 Rest of MEA Enterprise IoT Market By Enterprise Size – 2023 & 2027 ($M)

Fig.117 Enterprise IoT – Growth-Innovation Matrix

Fig.118 Data Analysis Model

Frequently asked questions

Currency USD
$3,950

Can be used by individual purchaser only

$7,950

Can be shared globally by unlimited users within the purchasing corporation e.g. all employees of a single company


Undecided about purchasing this report?

Enquire Before Buying Request a Free Sample

Get in touch to find out about multi-purchase discounts

reportstore@globaldata.com
Tel +44 20 7947 2745

Every customer’s requirement is unique. With over 220,000 construction projects tracked, we can create a tailored dataset for you based on the types of projects you are looking for. Please get in touch with your specific requirements and we can send you a quote.

Sample Report

We are confident about Enterprise IoT Market Trends and Analysis by Region, Product, Enterprise, Vertical, Connectivity and Segment Forecast to 2027 report's unique quality. However, we want you to make the most beneficial decision for your business, so we offer free sample pages to help you:

  • Assess the relevance of the report
  • Evaluate the quality of the report
  • Justify the cost

Download your copy of the sample report and make an informed decision about whether the full report will provide you with the insights and information you need.

Below is a sample report to understand what you are buying

See what our customers are saying

“The GlobalData platform is our go-to tool for intelligence services. GlobalData provides an easy way to access comprehensive intelligence data around multiple sectors, which essentially makes it a one-for-all intelligence platform, for tendering and approaching customers.

GlobalData is very customer orientated, with a high degree of personalised services, which benefits everyday use. The highly detailed project intelligence and forecast reports can be utilised across multiple departments and workflow scopes, from operational to strategic level, and often support strategic decisions. GlobalData Analytics and visualisation solutions has contributed positively when preparing management presentations and strategic papers.”

Business Intelligence & Marketing Manager, SAL Heavy Lift

“COVID-19 has caused significant interference to our business and the COVID-19 intelligence from GlobalData has helped us reach better decisions around strategy. These two highlights have helped enormously to understand the projections into the future concerning our business units, we also utilise the project database to source new projects for Liebherr-Werk to use as an additional source to pitch for new business.”

Market Analyst & Management, Liebherr-Werk

Your daily news has saved me a lot of time and keeps me up-to-date with what is happening in the market, I like that you almost always have a link to the source origin. We also use your market data in our Strategic Business Process to support our business decisions. By having everything in one place on the Intelligence Center it has saved me a lot of time versus looking on different sources, the alert function also helps with this.

Head of Key Accounts, Saab AB

Having used several other market research companies, I find that GlobalData manages to provide that ‘difficult-to-get’ market data that others can’t, as well as very diverse and complete consumer surveys.

Marketing Intelligence Manager, Portugal Foods

Our experience with GlobalData has been very good, from the platform itself to the people. I find that the analysts and the account team have a high level of customer focus and responsiveness and therefore I can always rely on. The platform is more holistic than other providers. It is convenient and almost like a one stop shop. The pricing suite is highly competitive and value for our organisation.

I like reports that inform new segments such as the analysis on generation Z, millennials, the impact of COVID 19 to our banking customers and their new channel habits. Secondly the specialist insight on affluent sector significantly increases our understanding about this group of customers. The combination of those give us depth and breadth of the evolving market.

I’m in the business of answering and helping people make decisions so with the intelligence center I can do that, effectively and efficiently. I can share quickly key insights that answer and satisfy our country stakeholders by giving them many quality studies and primary research about competitive landscape beyond the outlook of our bank. It helps me be seen as an advisory partner and that makes a big difference. A big benefit of our subscription is that no one holds the whole data and because it allows so many people, so many different parts of our organisation have access, it enables all teams to have the same level of knowledge and decision support.

Head of Customer Insight and Research, Standard Chartered

“I know that I can always rely on Globaldata’s work when I’m searching for the right consumer and market insights. I use Globaldata insights to understand the changing market & consumer landscape and help create better taste & wellbeing solutions for our customers in food, beverage and healthcare industries.

Globaldata has the right data and the reports are of very high quality compared to your competitors. Globaldata not only has overall market sizes & consumer insights on food & beverages but also provides insights at the ingredient & flavour level. That is key for B2B companies like Givaudan. This way we understand our customers’ business and also gain insight to our unique industry”

Head of Consumer Sensory Insights, Givaudan

GlobalData provides a great range of information and reports on various sectors that is highly relevant, timely, easy to access and utilise.  The reports and data dashboards help engagement with clients; they provide valuable industry and market insights that can enrich client conversations and can help in the shaping of value propositions. Moreover, using GlobalData products has helped increase my knowledge of the finance sector, the players within it, and the general threats and opportunities.

I find the consumer surveys that are carried out to be extremely beneficial and not something I have seen anywhere else. They provided an insightful view of why and which consumers take (or don’t) particular financial products. This can help shape conversations with clients to ensure they make the right strategic decisions for their business.

One of the challenges I have found is that data in the payments space is often piecemeal. With GD all of the data I need is in one place, but it also comes with additional market reports that provide useful extra context and information. Having the ability to set-up alerts on relevant movements in the industry, be it competitors or customers, and have them emailed directly to me, ensures I get early sight of industry activity and don’t have to search for news.

Senior Account Manager, TSYS
Go even deeper with GlobalData Intelligence Center

Every Company Report we produce is powered by the GlobalData Intelligence Center.

Subscribing to our intelligence platform means you can monitor developments at Enterprise IoT Market Trends and Analysis by Region, Product, Enterprise, Vertical, Connectivity and Segment Forecast to 2027 in real time.

  • Access a live Enterprise IoT Market Trends and Analysis by Region, Product, Enterprise, Vertical, Connectivity and Segment Forecast to 2027 dashboard for 12 months, with up-to-the-minute insights.
  • Fuel your decision making with real-time deal coverage and media activity.
  • Turn insights on financials, deals, products and pipelines into powerful agents of commercial advantage.