Electric Vehicles Market Analysis by Region, Propulsion Type, End-user Type and Forecast to 2030

Powered by

Access in-depth insight and stay ahead of the market

Explore in-depth market insights from the following data in our Electric Vehicles Market’ report including:

  • Electric vehicles market overview at the global and country level covering eleven key countries in depth.
  • Key growth drivers and challenges at the global level.
  • Market size by volume and value – globally and country-wise.
  • Electric vehicle and charging infrastructure policy analysis in each of the key countries.
  • Electric vehicle market segmentation globally and in each of the key countries.
  • Key players and market share in each of the key countries.

How is our ‘EV Market’ report different from other reports in the market?

  • Facilitate decision-making by providing trend analysis in the electric vehicles market.
  • Develop business strategies by understanding the drivers and challenges of the market.
  • Position yourself to gain the maximum advantage of the industry’s growth potential.
  • Maximize potential in the growth of the electric vehicles market.
  • Identify key partners, geographies, and business-development avenues.
  • Respond to business structure, strategy, and prospects.

We recommend this valuable source of information to anyone involved in:

  • Electric Vehicle Manufacturers/ EV Assembling Vendors
  • Battery Manufacturers
  • Automotive Companies and Start-ups
  • Semiconductors
  • Commodity Miners & Traders
  • EV Charging Infrastructure Providers
  • Auto Component Providers
  • Consulting Companies
  • Legal & Financial Advisors
  • Private Equity & VC Firms
  • Regulatory bodies

To get a snapshot of the EV market report, download a free report sample

Electric Vehicles (EV) Market Overview

The global market size of battery electric vehicles was $267.1 billion in 2022. The electric vehicles sector has registered exponential growth during the last decade due to the depleting fossil fuel reserves and growing awareness about the effects of global warming.

The EV market research report gives you an in-depth insight into the electric vehicles market and the impact it will have on the automotive industry. It further entails a deep-dive analysis of the industry covering eleven key countries. The report identifies the key market trends that will shape the EV market over the coming years and gives an insight into the market players and the competitive landscape within the EV theme.

Market Size (2022) $267.1 billion
Key Regions ·       Asia Pacific

·       Europe

·       Americas

·       Rest of the World

Key Body Type (Passenger) ·       Conventional

·       MAV

·       Sporty

·       SUV

·       Van

·       Others

Key Category (Passenger) ·       Non-Premium

·       Premium

·       Economy

·       Low-Cost

·       Super-Premium

·       Others

Key Source (Passenger) ·       Domestic Source

·       Imports

Leading Players ·       Tesla Motors

·       BYD Auto

·       SAIC Group

·       Volkswagen Group

·       Hyundai Group

Enquire & Decide Discover the perfect solution for your business needs. Enquire now and let us help you make an informed decision before making a purchase.

EV Market Segmentation by Region

The regional classifications considered in the EV market are Asia Pacific, Europe, the Americas, and the Rest of the World. Asia Pacific led the market for electric vehicles in terms of annual sales globally in 2022, followed by Europe and the Americas. The growing number of publicly accessible charging points, the increasing price of gasoline, and the focus on environmentally viable transportation alternatives are some of the prime factors contributing to the adoption of electric vehicles in the Asia Pacific.

EV Market Analysis by Region, 2022 (%)

EV Market Analysis by Region, 2022 (%)

For more regional insights into the EV market, download a free report sample

Passenger EV Market Segmentation by Body Type

The key body types in the passenger EV market are conventional, MAV, sporty, SUV, van, and others. In 2022, the conventional type of body led the market for passenger electric vehicles, followed by SUV. However, this is anticipated to change in future with SUV as the major shareholder in the passenger electric vehicles by 2035.

Passenger EV Market Analysis by Body Type, 2022 (%)

Passenger EV Market Analysis by Body Type, 2022 (%)

Buy The Full Report for More Insights Into The Passenger EV Market Segments By Body Type, Download A Free Report Sample

Passenger EV Market Categories

The key categories of the passenger EV market are non-premium, premium, economy, low-cost, super-premium, and others. In 2022, the non-premium category generated the highest revenue for passenger electric vehicles, followed by premium and economy.

However, in the non-premium category led the market in commercial EV, followed by the economy category.

Passenger EV Market Analysis by Categories, 2022 (%)

Passenger EV Market Analysis by Categories, 2022 (%)

Buy The Full Report for More Insights Into The Passenger EV Market Categories, Download A Free Report Sample

Passenger EV Market Segmentation by Source

The key sources of the passenger EV market are domestic sources and imports. In 2022, domestic source accounted for more than 80% of the passenger electric vehicles market share and is expected to continue its dominance during the forecast period. The commercial EV market also reflects the same sentiment as the passenger car category.

Passenger EV Market Analysis by Source, 2022 (%)

Passenger EV Market Analysis by Source, 2022 (%)

Buy The Full Report For More Insights Into The Passenger EV Market Source, Download A Free Report Sample

EV Market - Competitive Landscape

Major companies in the global EV market include Tesla Motors, BYD Auto, SAIC Group, Volkswagen Group, and Hyundai Group among others. In 2022, Tesla Motors led the market for electric vehicles globally, followed by BYD Auto and SAIC Group.

Tesla Motors is collaborating with other companies and establishing joint ventures to strengthen its position in the electric vehicles industry by expanding its supercharger network to non-Tesla EVs. Tesla has also collaborated with companies such as Ford and General Motors to expand its electric vehicle exposure in different countries.

EV Market Analysis by Companies, 2022 (%)

EV Market Analysis by Companies, 2022 (%)

Buy The Full Report for More Company Insights Into The EV Market, Download A Free Report Sample

Segments Covered in the Report

EV Market Regional Outlook (2022-2035)

  • Asia Pacific
  • Europe
  • Americas
  • Rest of the World

Passenger EV Market Body Type Outlook (2022-2035)

  • Conventional
  • MAV
  • Sporty
  • SUV
  • Van
  • Others

Passenger EV Market Category Outlook (2022-2035)

  • Non-Premium
  • Premium
  • Economy
  • Low-Cost
  • Super-Premium
  • Others

Passenger EV Market Source Outlook (2022-2035)

  • Domestic Source
  • Imports

Key Players

Tesla inc.
BYD Company Ltd.
SAIC Motor
Volkswagen Group
Zhejiang Geely Holding Group Co. Ltd.
The Hyundai Motor Group
Guangzhou Automobile Group Co. Ltd.
Stellantis N.V
Chery Automobile Co Ltd.
Changan Automobile Company

Table of Contents

1. Executive Summary

1.1 The EV market to face battery shortage

1.2 China to continue to dominate the EV market

1.3 Tesla continues to be the top manufacturer of EVs

1.4 Japan enters the top 10 market for the first time

1.5 US exceeds one million publicly available charging points

2. Introduction

2.1 Electric Vehicles, Technology Definition

2.2 Electric Vehicles, Technology Overview

2.3 Electric Vehicle Components

2.4 Electric Vehicles, Value Chain

3. Electric Vehicles Market, Global

3.1 Electric Vehicles, Global, Overview

3.2 Electric Vehicles, Global, Snapshot

– Electric Vehicles, Global, Incentives, Key Countries

3.3 Electric Vehicles, Global, Annual Sales, 2018-35

– Electric Vehicles, Global, Annual Sales by region

3.4 Electric Vehicles, Global, Market Size, 2018-35

– Electric Vehicles, Global, Market Size by region

3.5 Electric Vehicles, Global, Segmentation by body type

3.6 Electric Vehicles, Global, Segmentation by category

3.7 Electric Vehicles, Global, Segmentation by source

3.8 Electric Vehicles, Global, Market share

3.9 Publicly accessible Charging Points, Global

3.10 Electric Vehicles, Global, Cost and Pricing Analysis

3.11 Electric Vehicles, Batteries, Global, Overview

4. Electric Vehicles, Global, Competitive Environment

4.1 Major participants in the EV value chain

4.2 Electric Vehicles, Global, Company Profiles

– Tesla Inc. (Tesla)

– BYD Company Ltd. (BYD)

– SAIC Group (SAIC Motor)

– Volkswagen Group (Volkswagen AG)

– Zhejiang Geely Holding Group Co., Ltd. (Geely Group)

– The Hyundai Motor Group (Hyundai Group)

– Guangzhou Automobile Group Co., Ltd. (GAC Group)

– Stellantis N.V.

– Chery Automobile Co Ltd (Chery)

– Changan Automobile Company Limited

4.3 Electric Vehicles Market, Global, Major Deals and Key Milestones

– Major Deals

– Major Milestones

4.4 Electric Vehicles Market, Global, Trends

– Market Trends

– Macroeconomic Trends

– Regulatory trends

4.5 Electric Vehicles Market, Global, Market Forces Analysis

– Drivers

– Restraints

– Challenges

5. Electric Vehicles Market, Americas

5.1 Electric Vehicles, Americas, Overview

5.2 Electric Vehicles, Americas, Snapshot

5.3 Electric Vehicles, Americas, Annual Sales, 2018-2035

5.4 Electric Vehicles, Americas, Market Size. 2018-2035

5.5 Electric Vehicles, Americas, Segmentation by size

5.6 Electric Vehicles, Americas, Segmentation by category

5.7 Electric Vehicles, Americas, Segmentation by source

5.8 Electric Vehicles, Americas, Market share

5.9 Publicly accessible Charging Projects, Americas

5.10 Electric Vehicles, Americas, Cost and Pricing Analysis

6. Electric Vehicles Market, Asia-Pacific

6.1 Electric Vehicles, Asia-Pacific, Overview

6.2 Electric Vehicles, Asia-Pacific, Snapshot

6.3 Electric Vehicles, Asia-Pacific, Annual Sales, 2018–35

6.4 Electric Vehicles, Asia-Pacific, Market Size, 2018–35

6.5 Electric Vehicles, Asia-Pacific, Segmentation by Size

6.6 Electric Vehicles, Asia-Pacific, Segmentation by Category

6.7 Electric Vehicles, Asia-Pacific, Segmentation by Source

6.8 Electric Vehicles, Asia-Pacific, Market Share

6.9 Publicly Accessible Charging Projects, Asia-Pacific

6.10 Electric Vehicles, Asia-Pacific, Cost and Pricing Analysis

7. Electric Vehicles Market, Europe

7.1 Electric Vehicles, Europe, Overview

7.2 Electric Vehicles, Europe, Snapshot

7.3 Electric Vehicles, Europe, Annual Sales, 2018-2035

7.4 Electric Vehicles, Europe, Market Size, 2018-2035

7.5 Electric Vehicles, Europe, Segmentation by size

7.6 Electric Vehicles, Europe, Segmentation by category

7.7 Electric Vehicles, Europe, Segmentation by source

7.8 Electric Vehicles, Europe, Market share

7.9 Publicly accessible Charging Projects, Europe

7.10 Electric Vehicles, Europe, Cost and Pricing Analysis

8. Electric Vehicles Market, the US

8.1 Electric Vehicles, the US, Overview

8.2 Electric Vehicles Market, the US, Policies and Incentives Environment

– USA Electrify Forward Act

– Electric Cars Act

– Electric Vehicle Targets

– Regulations for Greenhouse Gas Emissions

– Qualified Plug-in Electric Drive Motor Vehicle Credit

– Electric Vehicle Incentives in Major States

8.3 Electric Vehicles, the US, Snapshot

8.4 Electric Vehicles, the US, Annual Sales, 2018–35

8.5 Electric Vehicles, the US, Market Size, 2018–35

8.6 Electric Vehicles, the US, Segmentation by Size

8.7 Electric Vehicles, the US, Segmentation by Category

8.8 Electric Vehicles, the US, Segmentation by Source

8.9 Electric Vehicles, the US, Market Share

8.10 Electric Vehicles, the US, Imports and Exports

8.11 Publicly Accessible Charging Points, the US

8.12 Publicly Accessible Charging Projects, the US

8.13 Electric Vehicles, the US, Cost and Pricing Analysis

8.14 Electric Vehicles Market, the US, Drivers and Restraints

– Electric Vehicles Market, the US, Key Drivers

– Electric Vehicles Market, the US, Major Restraints and Challenges

9. Electric Vehicles Market, Canada

9.1 Electric Vehicles, Canada, Overview

9.2 Electric Vehicles Market, Canada, Policies, and Incentives Environment

– Zero Emission Vehicle Policies and Incentives in Canada

– Electric Vehicle Targets

9.3 Electric Vehicles, Canada, Snapshot

9.4 Electric Vehicles, Canada, Annual Sales, 2018-35

9.5 Electric Vehicles, Canada, Market Size, 2018-35

9.6 Electric Vehicles, Canada, Segmentation by size

9.7 Electric Vehicles, Canada, Segmentation by category

9.8 Electric Vehicles, Canada, Segmentation by source

9.9 Electric Vehicles, Canada, Market share

9.10 Electric Vehicles, Canada, Imports & Exports

9.11 Publicly accessible Charging Points, Canada

9.12 Publicly accessible Charging Projects, Canada

9.13 Electric Vehicles, Canada, Cost and Pricing Analysis

9.14 Electric Vehicles Market, Canada, Drivers and Restraints

– Electric Vehicles Market, Canada, Major Drivers

– Electric Vehicles Market, Canada, Major Restraints and Challenges

10. Electric Vehicles Market, China

10.1 Electric Vehicles, China, Overview

10.2 Electric Vehicles Market, China, Policies and Incentives Environment

– New Energy Vehicle Policy in China

– Electric Vehicle Targets

10.3 Electric Vehicles, China, Snapshot

10.4 Electric Vehicles, China, Annual Sales, 2018–35

10.5 Electric Vehicles, China, Market Size, 2018–35

10.6 Electric Vehicles, China, Segmentation by Size

10.7 Electric Vehicles, China, Segmentation by Category

10.8 Electric Vehicles, China, Segmentation by Source

10.9 Electric Vehicles, China, Market Share

10.10 Electric Vehicles, China, Imports and Exports

10.11 Publicly Accessible Charging Points, China

10.12 Publicly Accessible Charging Projects, China

10.13 Electric Vehicles, China, Cost and Pricing Analysis

10.14 Electric Vehicles Market, China, Drivers and Restraints

– Electric Vehicles Market, China, Major Drivers

– Electric Vehicles Market, China, Major Restraints and Challenges

11. Electric Vehicles Market, India

11.1 Electric Vehicles, India, Overview

11.2 Electric Vehicles Market, India, Policies, and Incentives Environment

– Faster Adoption and Manufacturing of Hybrid and Electric Vehicles (FAME) – Phase I

– Faster Adoption and Manufacturing of Hybrid and Electric Vehicles (FAME) – Phase II

– Electric Vehicle Targets

– Electric Vehicle Incentives in Major States/Union Territories

11.3 Electric Vehicles, India, Snapshot

11.4 Electric Vehicles, India, Annual Sales, 2018-35

11.5 Electric Vehicles, India, Market Size, 2018-35

11.6 Electric Vehicles, India, Segmentation by size

11.7 Electric Vehicles, India, Segmentation by category

11.8 Electric Vehicles, India, Segmentation by source

11.9 Electric Vehicles, India, Market share

11.10 Electric Vehicles, India, Imports & Exports

11.11 Publicly accessible Charging Points, India

11.12 Publicly accessible Charging Projects, India

11.13 Electric Vehicles, India, Cost and Pricing Analysis

11.14 Electric Vehicles Market, India, Drivers and Restraints

– Electric Vehicles Market, India, Major Drivers

– Electric Vehicles Market, India, Major Restraints and Challenges

12. Electric Vehicles Market, Japan

12.1 Electric Vehicles, Japan, Overview

12.2 Electric Vehicles Market, Japan, Policies and Incentives Environment

– Electric Vehicle Policies in Japan

– Electric Vehicle Targets

12.3 Electric Vehicles, Japan, Snapshot

12.4 Electric Vehicles, Japan, Annual Sales, 2018–35

12.5 Electric Vehicles, Japan, Market Size, 2018–35

12.6 Electric Vehicles, Japan, Segmentation by Size

12.7 Electric Vehicles, Japan, Segmentation by Category

12.8 Electric Vehicles, Japan, Segmentation by Source

12.9 Electric Vehicles, Japan, Market Share

12.10 Electric Vehicles, Japan, Imports and Exports

12.11 Publicly Accessible Charging Points, Japan

12.12 Publicly Accessible Charging Projects, Japan

12.13 Electric Vehicles, Japan, Cost and Pricing Analysis

12.14 Electric Vehicles Market, Japan, Drivers, and Restraints

– Electric Vehicles Market, Japan, Key Drivers

– Electric Vehicles Market, Japan, Major Restraints and Challenges

13. Electric Vehicles Market, South Korea

13.1 Electric Vehicles, South Korea, Overview

13.2 Electric Vehicles Market, South Korea, Policies, and Incentives Environment

– Electric Vehicle and Charging Infrastructure Policies in South Korea

– Electric Vehicle Targets

13.3 Electric Vehicles, South Korea, Snapshot

13.4 Electric Vehicles, South Korea, Annual Sales, 2018-35

13.5 Electric Vehicles, South Korea, Market Size, 2018-35

13.6 Electric Vehicles, South Korea, Segmentation by size

13.7 Electric Vehicles, South Korea, Segmentation by category

13.8 Electric Vehicles, South Korea, Segmentation by source

13.9 Electric Vehicles, South Korea, Market share

13.10 Electric Vehicles, South Korea, Imports & Exports

13.11 Publicly accessible Charging Points, South Korea

13.12 Publicly accessible Charging Projects, South Korea

13.13 Electric Vehicles, South Korea, Cost and Pricing Analysis

13.14 Electric Vehicles Market, South Korea, Drivers and Restraints

– Electric Vehicles Market, South Korea, Key Drivers

– Electric Vehicles Market, South Korea, Major Restraints and Challenges

14. Electric Vehicles Market, Germany

14.1 Electric Vehicles, Germany, Overview

14.2 Electric Vehicles Market, Germany, Policies and Incentives Environment

– Electric Vehicle and Charging Infrastructure Policies and Incentives in Germany

– Electric Vehicle Targets

14.3 Electric Vehicles, Germany, Snapshot

14.4 Electric Vehicles, Germany, Annual Sales, 2018–35

14.5 Electric Vehicles, Germany, Market Size, 2018–35

14.6 Electric Vehicles, Germany, Segmentation by Size

14.7 Electric Vehicles, Germany, Segmentation by Category

14.8 Electric Vehicles, Germany, Segmentation by Source

14.9 Electric Vehicles, Germany, Market Share

14.10 Electric Vehicles, Germany, Imports and Exports

14.11 Publicly Accessible Charging Points, Germany

14.12 Publicly Accessible Charging Projects, Germany

14.13 Electric Vehicles, Germany, Cost and Pricing Analysis

14.14 Electric Vehicles Market, Germany, Drivers and Restraints

– Electric Vehicles Market, Germany, Major Drivers

– Electric Vehicles Market, Germany, Major Restraints and Challenges

15. Electric Vehicles Market, France

15.1 Electric Vehicles, France, Overview

15.2 Electric Vehicles Market, France, Policies, and Incentives Environment

– Electric Vehicle Policy and Incentives in France

– Electric Vehicle Targets

15.3 Electric Vehicles, France, Snapshot

15.4 Electric Vehicles, France, Annual Sales, 2018-35

15.5 Electric Vehicles, France, Market Size, 2018-35

15.6 Electric Vehicles, France, Segmentation by size

15.7 Electric Vehicles, France, Segmentation by category

15.8 Electric Vehicles, France, Segmentation by source

15.9 Electric Vehicles, France, Market share

15.10 Electric Vehicles, France, Imports & Exports

15.11 Publicly accessible Charging Points, France

15.12 Publicly accessible Charging Projects, France

15.13 Electric Vehicles, France, Cost and Pricing Analysis

15.14 Electric Vehicles Market, France, Drivers and Restraints

– Electric Vehicles Market, France, Major Drivers

– Electric Vehicles Market, France, Major Restraints and Challenges

16. Electric Vehicles Market, the Netherlands

16.1 Electric Vehicles, the Netherlands, Overview

16.2 Electric Vehicles Market, the Netherlands, Policies and Incentives Environment

– Electric Vehicle Subsidy Program in the Netherlands

– Electric Vehicle Targets

16.3 Electric Vehicles, the Netherlands, Snapshot

16.4 Electric Vehicles, the Netherlands, Annual Sales, 2018–35

16.5 Electric Vehicles, the Netherlands, Market Size, 2018–35

16.6 Electric Vehicles, the Netherlands, Segmentation by Size

16.7 Electric Vehicles, the Netherlands, Segmentation by Category

16.8 Electric Vehicles, the Netherlands, Segmentation by Source

16.9 Electric Vehicles, the Netherlands, Market Share

16.10 Electric Vehicles, the Netherlands, Imports and Exports

16.11 Publicly Accessible Charging Points, the Netherlands

16.12 Publicly Accessible Charging Projects, the Netherlands

16.13 Electric Vehicles, the Netherlands, Cost and Pricing Analysis

16.14 Electric Vehicles Market, the Netherlands, Drivers and Restraints

– Electric Vehicles Market, the Netherlands, Major Drivers

– Electric Vehicles Market, the Netherlands, Major Restraints and Challenges

17. Electric Vehicles Market, Norway

17.1 Electric Vehicles, Norway, Overview

17.2 Electric Vehicles Market, Norway, Policies, and Incentives Environment

– Zero Emission Vehicle Incentives and Charging Infrastructure Policies in Norway

– Electric Vehicle Targets

17.3 Electric Vehicles, Norway, Snapshot

17.4 Electric Vehicles, Norway, Annual Sales, 2018-35

17.5 Electric Vehicles, Norway, Market Size, 2018-35

17.6 Electric Vehicles, Norway, Segmentation by size

17.7 Electric Vehicles, Norway, Segmentation by category

17.8 Electric Vehicles, Norway, Segmentation by source

17.9 Electric Vehicles, Norway, Market share

17.10 Electric Vehicles, Norway, Imports & Exports

17.11 Publicly accessible Charging Points, Norway

17.12 Publicly accessible Charging Projects, Norway

17.13 Electric Vehicles, Norway, Cost and Pricing Analysis

17.14 Electric Vehicles Market, Norway, Drivers and Restraints

– Electric Vehicles Market, Norway, Major Drivers

– Electric Vehicles Market, Norway, Major Restraints and Challenges

18. Electric Vehicles Market, the UK

18.1 Electric Vehicles, the UK, Overview

18.2 Electric Vehicles Market, the UK, Policies and Incentives Environment

– Electric Vehicle Policy and Incentives in the UK

– Electric Vehicle Home Charge Scheme and Workplace Chargepoint Grant

– Electric Vehicle Targets

18.3 Electric Vehicles, the UK, Snapshot

18.4 Electric Vehicles, the UK, Annual Sales, 2018–35

18.5 Electric Vehicles, the UK, Market Size, 2018–35

18.6 Electric Vehicles, the UK, Segmentation by Size

18.7 Electric Vehicles, the UK, Segmentation by Category

18.8 Electric Vehicles, the UK, Segmentation by Source

18.9 Electric Vehicles, the UK, Market Share

18.10 Electric Vehicles, the UK, Imports and Exports

18.11 Publicly Accessible Charging Points, the UK

18.12 Publicly Accessible Charging Projects, the UK

18.13 Electric Vehicles, the UK, Cost and Pricing Analysis

18.14 Electric Vehicles Market, the UK, Drivers and Restraints

– Electric Vehicles Market, the UK, Key Drivers

– Electric Vehicles Market, the UK, Major Restraints and Challenges

19. Appendix

19.1 Abbreviations

19.2 Market Definitions

– Battery

– Battery Electric Vehicle

– Commercial Vehicle

– Drivetrain

– Electric Vehicle Supply Equipment (EVSE)

– Hybrid Electric Vehicle (HEV)

– Internal Combustion Engine (ICE)

– Lithium-ion Batteries

– New Energy Vehicle (NEV)

– Passenger Vehicle

– Plug-in Hybrid Electric Vehicle (PHEV)

– Regenerative Braking

19.3 Methodology

– Coverage

– Secondary Research

– Primary Research

– Modelling and Forecasting

About GlobalData

Contact Us

Table

Table 1: Electric Vehicle, Key Countries, Incentives

Table 2: Electric Vehicles Market, Global, Annual Sales (‘000s), 2018–2035

Table 3: Electric Vehicles Market, Global, Annual Sales by Region (‘000s), 2018–2035

Table 4: Electric Vehicles Market, Global, Market Size ($B), 2018–2035

Table 5: Electric Vehicles Market, Global, Market Size by Region ($B), 2018–2035

Table 6: Electric Vehicles Market, Global, Average Selling Price ($), 2018–2035

Table 7: Electric Vehicle, Major Participants in the Electric Vehicle Value Chain

Table 8: Electric Vehicle Market, Global, Company Profile, Tesla Inc. (Tesla)

Table 9: Electric Vehicle Market, Global, Company Profile, BYD Company Ltd. (BYD)

Table 10: Electric Vehicle Market, Global, Company Profile, SAIC Group (SAIC Motor)

Table 11: Electric Vehicle Market, Global, Company Profile, Volkswagen Group

Table 12: Electric Vehicle Market, Global, Company Profile, Zhejiang Geely Holding Group Co., Ltd. (Geely Group)

Table 13: Electric Vehicle Market, Global, Company Profile, The Hyundai Motor Group

Table 14: Electric Vehicle Market, Global, Company Profile, Guangzhou Automobile Group Co., Ltd. (GAC Group)

Table 15: Electric Vehicle Market, Global, Company Profile, Stellantis N.V.

Table 16: Electric Vehicle Market, Global, Company Profile, Chery Automobile Co Ltd (Chery)

Table 17: Electric Vehicle Market, Global, Company Profile, Changan Automobile Company Limited

Table 18: Electric Vehicles, Global, Deals

Table 19: Electric Vehicle Milestones

Table 20: Electric Vehicles Market, Americas, Annual Sales (‘000s), 2018–2035

Table 21: Electric Vehicles Market, Americas, Market Size ($B), 2018–2035

Table 22: Electric Vehicles Market, Americas, Average Selling Price ($), 2018–2035

Table 23: Electric Vehicles Market, Asia-Pacific, Annual Sales (’000s), 2018–35

Table 24: Electric Vehicles Market, Asia-Pacific, Market Size ($B), 2018–35

Table 25: Electric Vehicles Market, Asia-Pacific, Average Selling Price ($), 2018–35

Table 26: Electric Vehicles Market, Europe Annual Sales (‘000s), 2018–2035

Table 27: Electric Vehicles Market, Europe, Market Size ($B), 2018–2035

Table 28: Electric Vehicles Market, Europe, Average Selling Price ($), 2018–2035

Table 29: Electric Vehicles Market, the US Annual Sales (’000s), 2018–35

Table 30: Electric Vehicles Market, the US, Market Size ($B), 2018–35

Table 31: Electric Vehicles Market, the US imports and exports ($M)

Table 32: Electric Vehicles Market, the US, Average Selling Price ($), 2018–35

Table 33: Electric Vehicles Market, Canada Annual Sales (‘000s), 2018–2035

Table 34: Electric Vehicles Market, Canada, Market Size ($B), 2018–2035

Table 35: Electric Vehicles Market, Canada imports & exports ($M)

Table 36: Electric Vehicles Market, Canada, Average Selling Price ($), 2018–2035

Table 37: Electric Vehicles Market, China Annual Sales (’000s), 2018–35

Table 38: Electric Vehicles Market, China, Market Size ($B), 2018–35

Table 39: Electric Vehicles Market, China imports and exports ($M)

Table 40: Electric Vehicles Market, China, Average Selling Price ($), 2018–35

Table 41: Electric Vehicles Market, India Annual Sales (‘000s), 2018–2035

Table 42: Electric Vehicles Market, India, Market Size ($B), 2018–2035

Table 43: Electric Vehicles Market, India imports & exports ($M)

Table 44: Electric Vehicles Market, India, Average Selling Price ($), 2018–2035

Table 45: Electric Vehicles Market, Japan Annual Sales (’000s), 2018–35

Table 46: Electric Vehicles Market, Japan, Market Size ($B), 2018–35

Table 47: Electric Vehicles Market, Japan imports & exports ($M)

Table 48: Electric Vehicles Market, Japan, Average Selling Price ($), 2018–35

Table 49: Electric Vehicles Market, South Korea Annual Sales (‘000s), 2018–2035

Table 50: Electric Vehicles Market, South Korea, Market Size ($B), 2018–2035

Table 51: Electric Vehicles Market, South Korea imports & exports ($M)

Table 52: Electric Vehicles Market, South Korea, Average Selling Price ($), 2018–2035

Table 53: Electric Vehicles Market, Germany Annual Sales (’000s), 2018–35

Table 54: Electric Vehicles Market, Germany, Market Size ($B), 2018–35

Table 55: Electric Vehicles Market, Germany imports and exports ($M)

Table 56: Electric Vehicles Market, Germany, Average Selling Price ($), 2018–35

Table 57: Electric Vehicles Market, France Annual Sales (‘000s), 2018–2035

Table 58: Electric Vehicles Market, France, Market Size ($B), 2018–2035

Table 59: Electric Vehicles Market, France imports & exports ($M)

Table 60: Electric Vehicles Market, France, Average Selling Price ($), 2018–2035

Table 61: Electric Vehicles Market, the Netherlands Annual Sales (’000s), 2018–35

Table 62: Electric Vehicles Market, the Netherlands, Market Size ($B), 2018–35

Table 63: Electric Vehicles Market, the Netherlands imports and exports ($M)

Table 64: Electric Vehicles Market, the Netherlands, Average Selling Price ($), 2018–35

Table 65: Electric Vehicles Market, Norway Annual Sales (‘000s), 2018–2035

Table 66: Electric Vehicles Market, Norway, Market Size ($B), 2018–2035

Table 67: Electric Vehicles Market, Norway imports & exports ($M)

Table 68: Electric Vehicles Market, Norway, Average Selling Price ($), 2018–2035

Table 69: Electric Vehicles Market, the UK Annual Sales (’000s), 2018–35

Table 70: Electric Vehicles Market, the UK, Market Size ($B), 2018–35

Table 71: Electric Vehicles Market, the UK imports and exports ($M)

Table 72: Electric Vehicles Market, the UK, Average Selling Price ($), 2018–35

Table 73: Abbreviations

Figures

Figure 1: Electric Vehicles Market, China, Annual Sales (‘000s), 2018–2035

Figure 2: Electric Vehicles Market, Global, Market Share (%), 2022

Figure 3: Electric Vehicles Market, Japan, Annual Sales (‘000s), 2018–2035

Figure 4: Electric Vehicles Market, the US, Publicly Accessible Charging Points (in ‘000s), 2010–2022

Figure 5: Electric Vehicle Value Chain

Figure 6: Global Electric Vehicles Market, Snapshot, 2022

Figure 7: Electric Vehicles Market, Global, Annual Sales (‘000s), 2018–2035

Figure 8: Electric Vehicles Market, Global, Annual Sales by Region (%), 2022 and 2035

Figure 9: Electric Vehicles Market, Global, Market Size ($B), 2018–2035

Figure 10: Electric Vehicles Market, Global, Market Size by Region (%), 2022 and 2035

Figure 11: Electric Vehicles Market, Global, Segmentation in Passenger Electric Vehicles body type (%)

Figure 12: Electric Vehicles Market, Global, Segmentation in Passenger Electric Vehicles Category (%)

Figure 13: Electric Vehicles Market, Global, Segmentation in Commercial Electric Vehicles Category (%)

Figure 14: Electric Vehicles Market, Global, Segmentation by Passenger Electric Vehicles Source (%)

Figure 15: Electric Vehicles Market, Global, Segmentation by Commercial Electric Vehicles Source (%)

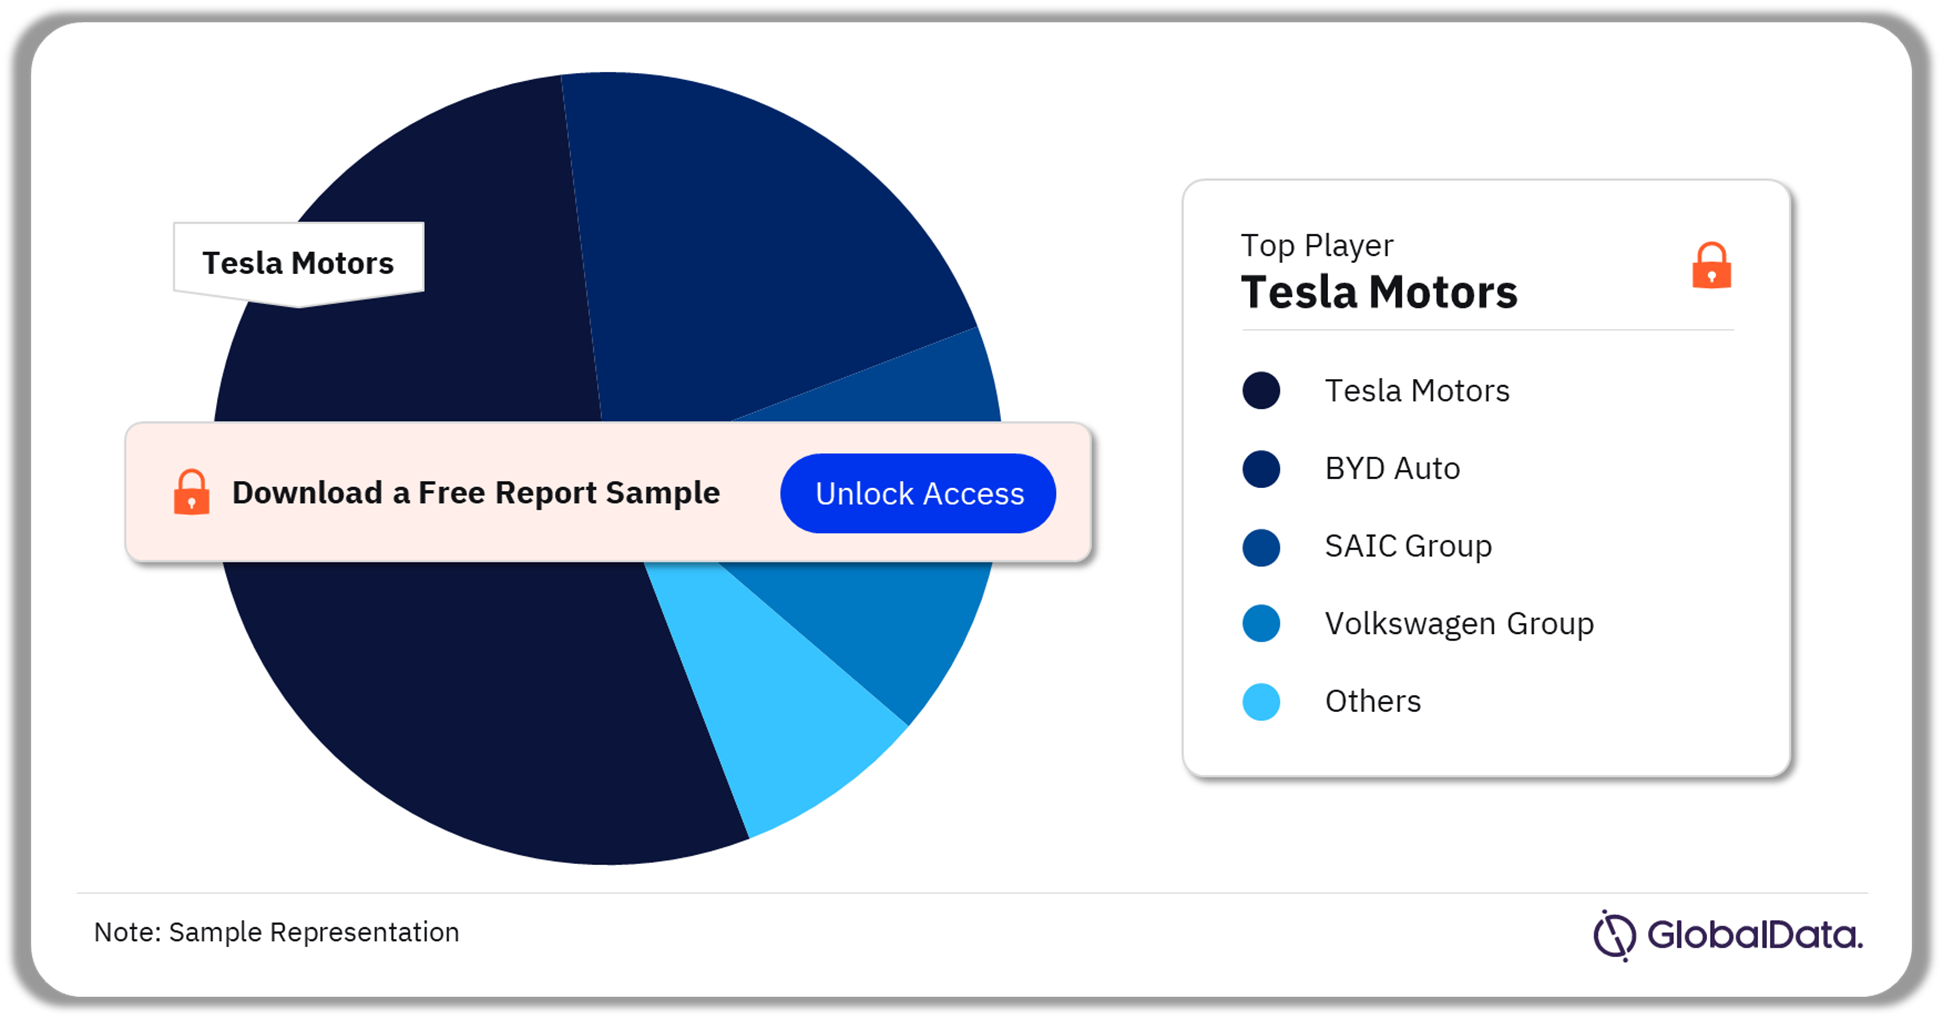
Figure 16: Electric Vehicles Market, Global, Market Share (%), 2022

Figure 17: Electric Vehicles Market, Global, Publicly Accessible Charging Points (in ‘000s), 2010–2022

Figure 18: Electric Vehicles Market, Global, Average Selling Price, 2018-35

Figure 19: Global, Electric Vehicles Market, Drivers, Restraints, and Challenges

Figure 20: Americas Electric Vehicles Market, Snapshot, 2022

Figure 21: Electric Vehicles Market, Americas, Annual Sales (‘000s), 2018–2035

Figure 22: Electric Vehicles Market, Americas, Market Size ($B), 2018–2035

Figure 23: Electric Vehicles Market, Americas, Segmentation by Passenger Electric Vehicles Size (%)

Figure 24: Electric Vehicles Market, Americas, Segmentation by Commercial Electric Vehicles Size (%)

Figure 25: Electric Vehicles Market, Americas, Segmentation by Passenger Electric Vehicles Category (%)

Figure 26: Electric Vehicles Market, Americas, Segmentation by Passenger Electric Vehicles Source (%)

Figure 27: Electric Vehicles Market, Americas, Segmentation by Commercial Electric Vehicles Source (%)

Figure 28: Electric Vehicles Market, Americas, Market Share (%), 2022

Figure 29: Electric Vehicles Market, Americas, Announced Charging Projects, 2012–2022

Figure 30: Electric Vehicles Market, Americas, Public Charging Infrastructure, Capacity by Status and Number of Projects (As of May 2023)

Figure 31: Electric Vehicles Market, Americas, Public Charging Infrastructure Project (%), 2022

Figure 32: Electric Vehicles Market, Americas, Average Selling Price, 2018-35

Figure 33: Asia-Pacific Electric Vehicles Market, Snapshot, 2022

Figure 34: Electric Vehicles Market, Asia-Pacific, Annual Sales (’000s), 2018–35

Figure 35: Electric Vehicles Market, Asia-Pacific, Market Size ($B), 2018–35

Figure 36: Electric Vehicles Market, Asia-Pacific, Segmentation by Passenger Electric Vehicles Size (%)

Figure 37: Electric Vehicles Market, Asia-Pacific, Segmentation by Commercial Electric Vehicles Size (%)

Figure 38: Electric Vehicles Market, Asia-Pacific, Segmentation by Passenger Electric Vehicles Category (%)

Figure 39: Electric Vehicles Market, Asia-Pacific, Segmentation by Commercial Electric Vehicles Category (%)

Figure 40: Electric Vehicles Market, Asia-Pacific, Segmentation by Passenger Electric Vehicles Source (%)

Figure 41: Electric Vehicles Market, Asia-Pacific, Segmentation by Commercial Electric Vehicles Source (%)

Figure 42: Electric Vehicles Market, Asia-Pacific, Market Share (%), 2022

Figure 43: Electric Vehicles Market, Asia Pacific, Announced Charging Projects, 2009–22

Figure 44: Electric Vehicles Market, Asia-Pacific, Public Charging Infrastructure, Capacity by Status, and Number of Projects (As of May 2023)

Figure 45: Electric Vehicles Market, Asia-Pacific, Public Charging Infrastructure Projects (%), 2022

Figure 46: Electric Vehicles Market, Asia Pacific, Average Selling Price, 2018-35

Figure 47: Europe Electric Vehicles Market, Snapshot, 2022

Figure 48: Electric Vehicles Market, Europe, Annual Sales (‘000s), 2018–2035

Figure 49: Electric Vehicles Market, Europe, Market Size ($B), 2018–2035

Figure 50: Electric Vehicles Market, Europe, Segmentation by Passenger Electric Vehicles Size (%)

Figure 51: Electric Vehicles Market, Europe, Segmentation by Commercial Electric Vehicles Size (%)

Figure 52: Electric Vehicles Market, Europe, Segmentation by Passenger Electric Vehicles Category (%)

Figure 53: Electric Vehicles Market, Europe, Segmentation by Commercial Electric Vehicles Category (%)

Figure 54: Electric Vehicles Market, Europe, Segmentation by Passenger Electric Vehicles Source (%)

Figure 55: Electric Vehicles Market, Europe, Segmentation by Commercial Electric Vehicles Source (%)

Figure 56: Electric Vehicles Market, Europe, Market Share (%), 2022

Figure 57: Electric Vehicles Market, Europe, Announced Charging Projects, 2011–2022

Figure 58: Electric Vehicles Market, Europe, Public Charging Infrastructure, Capacity by Status and Number of Projects (As of May 2023)

Figure 59: Electric Vehicles Market, Europe, Public Charging Infrastructure Projects (%), 2022

Figure 60: Electric Vehicles Market, Europe, Average Selling Price, 2018-35

Figure 61: The US Electric Vehicles Market, Snapshot, 2022

Figure 62: Electric Vehicles Market, the US, Annual Sales (’000s), 2018–35

Figure 63: Electric Vehicles Market, the US, Market Size ($B), 2018–35

Figure 64: Electric Vehicles Market, the US, Segmentation by Passenger Electric Vehicles Size (%)

Figure 65: Electric Vehicles Market, the US, Segmentation by Commercial Electric Vehicles Size (%)

Figure 66: Electric Vehicles Market, the US, Segmentation by Passenger Electric Vehicles Category (%)

Figure 67: Electric Vehicles Market, the US, Segmentation by Passenger Electric Vehicles Source (%)

Figure 68: Electric Vehicles Market, the US, Market Share (%), 2022

Figure 69: Electric Vehicles Market, the US Passenger Electric Vehicles, Imports and Exports

Figure 70: Electric Vehicles Market, the US Commercial Electric Vehicles, Imports and Exports

Figure 71: Electric Vehicles Market, the US, Publicly Accessible Charging Points (in ’000s), 2010–22

Figure 72: Electric Vehicles Market, the US, Announced Charging Projects, 2012–22

Figure 73: Electric Vehicles Market, the US, Public Charging Infrastructure, Capacity by Status, and Number of Projects (As of May 2023)

Figure 74: Electric Vehicles Market, the US, Public Charging Infrastructure Projects (%), 2022

Figure 75: Electric Vehicles Market, the US, Average Selling Price, 2018–35

Figure 76: Canada Electric Vehicles Market, Snapshot, 2022

Figure 77: Electric Vehicles Market, Canada, Annual Sales (‘000s), 2018–2035

Figure 78: Electric Vehicles Market, Canada, Market Size ($B), 2018–2035

Figure 79: Electric Vehicles Market, Canada, Segmentation by Passenger Electric Vehicles Size (%)

Figure 80: Electric Vehicles Market, Canada, Segmentation by Commercial Electric Vehicles Size (%)

Figure 81: Electric Vehicles Market, Canada, Segmentation by Passenger Electric Vehicles Category (%)

Figure 82: Electric Vehicles Market, Canada, Segmentation by Passenger Electric Vehicles Source (%)

Figure 83: Electric Vehicles Market, Canada, Market Share (%), 2022

Figure 84: Electric Vehicles Market, Canada Passenger Electric Vehicles, Imports & Exports

Figure 85: Electric Vehicles Market, Canada Commercial Electric Vehicles, Imports & Exports

Figure 86: Electric Vehicles Market, Canada, Publicly Accessible Charging Points (in ‘000s), 2012–2022

Figure 87: Electric Vehicles Market, Canada, Announced Charging Projects, 2015–2022

Figure 88: Electric Vehicles Market, Canada, Public Charging Infrastructure, Capacity by Status and Number of Projects (As of May 2023)

Figure 89: Electric Vehicles Market, Canada, Public Charging Infrastructure Project (%), 2022

Figure 90: Electric Vehicles Market, Canada, Average Selling Price, 2018-35

Figure 91: China Electric Vehicles Market, Snapshot, 2022

Figure 92: Electric Vehicles Market, China, Annual Sales (’000s), 2018–35

Figure 93: Electric Vehicles Market, China, Market Size ($B), 2018–35

Figure 94: Electric Vehicles Market, China, Segmentation by Passenger Electric Vehicles Size (%)

Figure 95: Electric Vehicles Market, China, Segmentation by Commercial Electric Vehicles Size (%)

Figure 96: Electric Vehicles Market, China, Segmentation by Passenger Electric Vehicles Category (%)

Figure 97: Electric Vehicles Market, China, Segmentation by Commercial Electric Vehicles Category (%)

Figure 98: Electric Vehicles Market, China, Segmentation by Passenger Electric Vehicles Source (%)

Figure 99: Electric Vehicles Market, China, Market Share (%), 2022

Figure 100: Electric Vehicles Market, China Passenger Electric Vehicles, Imports and Exports

Figure 101: Electric Vehicles Market, China Commercial Electric Vehicles, Imports and Exports

Figure 102: Electric Vehicles Market, China, Publicly Accessible Charging Points (in ’000s), 2014–22

Figure 103: Electric Vehicles Market, China, Announced Charging Projects, 2015–22

Figure 104: Electric Vehicles Market, China, Public Charging Infrastructure, Capacity by Status, and Number of Projects (As of May 2023)

Figure 105: Electric Vehicles Market, China, Average Selling Price, 2018–35

Figure 106: India Electric Vehicles Market, Snapshot, 2022

Figure 107: Electric Vehicles Market, India, Annual Sales (‘000s), 2018–2035

Figure 108: Electric Vehicles Market, India, Market Size ($B), 2018–2035

Figure 109: Electric Vehicles Market, India, Segmentation by Passenger Electric Vehicles Size (%)

Figure 110: Electric Vehicles Market, India, Segmentation by Passenger Electric Vehicles Category (%)

Figure 111: Electric Vehicles Market, India, Segmentation by Passenger Electric Vehicles Source (%)

Figure 112: Electric Vehicles Market, India, Market Share (%), 2022

Figure 113: Electric Vehicles Market, India Passenger Electric Vehicles, Imports & Exports

Figure 114: Electric Vehicles Market, India, Publicly Accessible Charging Points (in ‘000s), 2016–2022

Figure 115: Electric Vehicles Market, India, Announced Charging Projects, 2018–2022

Figure 116: Electric Vehicles Market, India, Public Charging Infrastructure, Capacity by Status and Number of Projects (As of May 2023)

Figure 117: Electric Vehicles Market, India, Public Charging Infrastructure Project (%), 2022

Figure 118: Electric Vehicles Market, India, Average Selling Price, 2018-35

Figure 119: Japan Electric Vehicles Market, Snapshot, 2022

Figure 120: Electric Vehicles Market, Japan, Annual Sales (’000s), 2018–35

Figure 121: Electric Vehicles Market, Japan, Market Size ($B), 2018–35

Figure 122: Electric Vehicles Market, Japan, Segmentation by Passenger Electric Vehicles Size (%)

Figure 123: Electric Vehicles Market, Japan, Segmentation by Commercial Electric Vehicles Size (%)

Figure 124: Electric Vehicles Market, Japan, Segmentation by Passenger Electric Vehicles Category (%)

Figure 125: Electric Vehicles Market, Japan, Segmentation by Commercial Electric Vehicles Category (%)

Figure 126: Electric Vehicles Market, Japan, Segmentation by Passenger Electric Vehicles Source (%)

Figure 127: Electric Vehicles Market, Japan, Segmentation by Commercial Electric Vehicles Source (%)

Figure 128: Electric Vehicles Market, Japan, Market Share (%), 2022

Figure 129: Electric Vehicles Market, Japan Passenger Electric Vehicles, Imports and Exports

Figure 130: Electric Vehicles Market, Japan Commercial Electric Vehicles, Imports and Exports

Figure 131: Electric Vehicles Market, Japan, Publicly Accessible Charging Points (in ’000s), 2010–22

Figure 132: Electric Vehicles Market, Japan, Announced Charging Projects, 2009–22

Figure 133: Electric Vehicles Market, Japan, Average Selling Price, 2018–35

Figure 134: South Korea Electric Vehicles Market, Snapshot, 2022

Figure 135: Electric Vehicles Market, South Korea, Annual Sales (‘000s), 2018–2035

Figure 136: Electric Vehicles Market, South Korea, Market Size ($B), 2018–2035

Figure 137: Electric Vehicles Market, South Korea, Segmentation by Passenger Electric Vehicles Size (%)

Figure 138: Electric Vehicles Market, South Korea, Segmentation by Passenger Electric Vehicles Category (%)

Figure 139: Electric Vehicles Market, South Korea, Segmentation by Passenger Electric Vehicles Source (%)

Figure 140: Electric Vehicles Market, South Korea, Segmentation by Commercial Electric Vehicles Source (%)

Figure 141: Electric Vehicles Market, South Korea, Market Share (%), 2022

Figure 142: Electric Vehicles Market, South Korea Passenger Electric Vehicles, Imports & Exports

Figure 143: Electric Vehicles Market, South Korea, Publicly Accessible Charging Points (in ‘000s), 2016–2022

Figure 144: Electric Vehicles Market, South Korea, Announced Charging Projects, 2021–2022

Figure 145: Electric Vehicles Market, South Korea, Average Selling Price, 2018-35

Figure 146: Germany Electric Vehicles Market, Snapshot, 2022

Figure 147: Electric Vehicles Market, Germany, Annual Sales (’000s), 2018–35

Figure 148: Electric Vehicles Market, Germany, Market Size ($B), 2018–35

Figure 149: Electric Vehicles Market, Germany, Segmentation by Passenger Electric Vehicles Size (%)

Figure 150: Electric Vehicles Market, Germany, Segmentation by Commercial Electric Vehicles Size (%)

Figure 151: Electric Vehicles Market, Germany, Segmentation by Passenger Electric Vehicles Category (%)

Figure 152: Electric Vehicles Market, Germany, Segmentation by Commercial Electric Vehicles Category (%)

Figure 153: Electric Vehicles Market, Germany, Segmentation by Passenger Electric Vehicles Source (%)

Figure 154: Electric Vehicles Market, Germany, Segmentation by Commercial Electric Vehicles Source (%)

Figure 155: Electric Vehicles Market, Germany, Market Share (%), 2022

Figure 156: Electric Vehicles Market, Germany Passenger Electric Vehicles, Imports and Exports

Figure 157: Electric Vehicles Market, Germany Commercial Electric Vehicles, Imports and Exports

Figure 158: Electric Vehicles Market, Germany, Publicly Accessible Charging Points (in ’000s), 2012–22

Figure 159: Electric Vehicles Market, Germany, Announced Charging Projects, 2016–22

Figure 160: Electric Vehicles Market, Germany, Public Charging Infrastructure, Capacity by Status, and Number of Projects (As of May 2023)

Figure 161: Electric Vehicles Market, Germany, Average Selling Price, 2018–35

Figure 162: France Electric Vehicles Market, Snapshot, 2022

Figure 163: Electric Vehicles Market, France, Annual Sales (‘000s), 2018–2035

Figure 164: Electric Vehicles Market, France, Market Size ($B), 2018–2035

Figure 165: Electric Vehicles Market, France, Segmentation by Passenger Electric Vehicles Size (%)

Figure 166: Electric Vehicles Market, France, Segmentation by Commercial Electric Vehicles Size (%)

Figure 167: Electric Vehicles Market, France, Segmentation by Passenger Electric Vehicles Category (%)

Figure 168: Electric Vehicles Market, France, Segmentation by Commercial Electric Vehicles Category (%)

Figure 169: Electric Vehicles Market, France, Segmentation by Passenger Electric Vehicles Source (%)

Figure 170: Electric Vehicles Market, France, Segmentation by Commercial Electric Vehicles Source (%)

Figure 171: Electric Vehicles Market, France, Market Share (%), 2022

Figure 172: Electric Vehicles Market, France Passenger Electric Vehicles, Imports & Exports

Figure 173: Electric Vehicles Market, France Commercial Electric Vehicles, Imports & Exports

Figure 174: Electric Vehicles Market, France, Publicly Accessible Charging Points (in ‘000s), 2012–2022

Figure 175: Electric Vehicles Market, France, Announced Charging Projects, 2018–2022

Figure 176: Electric Vehicles Market, France, Public Charging Infrastructure, Capacity by Status and Number of Projects (As of May 2023)

Figure 177: Electric Vehicles Market, France, Average Selling Price, 2018-35

Figure 178: The Netherlands Electric Vehicles Market, Snapshot, 2022

Figure 179: Electric Vehicles Market, the Netherlands, Annual Sales (’000s), 2018–35

Figure 180: Electric Vehicles Market, the Netherlands, Market Size ($B), 2018–35

Figure 181: Electric Vehicles Market, the Netherlands, Segmentation by Passenger Electric Vehicles Size (%)

Figure 182: Electric Vehicles Market, the Netherlands, Segmentation by Commercial Electric Vehicles Size (%)

Figure 183: Electric Vehicles Market, the Netherlands, Segmentation by Passenger Electric Vehicles Category (%)

Figure 184: Electric Vehicles Market, the Netherlands, Segmentation by Commercial Electric Vehicles Category (%)

Figure 185: Electric Vehicles Market, the Netherlands, Segmentation by Passenger Electric Vehicles Source (%)

Figure 186: Electric Vehicles Market, the Netherlands, Segmentation by Commercial Electric Vehicles Source (%)

Figure 187: Electric Vehicles Market, the Netherlands, Market Share (%), 2022

Figure 188: Electric Vehicles Market, the Netherlands Passenger Electric Vehicles, Imports and Exports

Figure 189: Electric Vehicles Market, the Netherlands Commercial Electric Vehicles, Imports and Exports

Figure 190: Electric Vehicles Market, the Netherlands, Publicly Accessible Charging Points (in ’000s), 2012–22

Figure 191: Electric Vehicles Market, the Netherlands, Announced Charging Projects, 2016–21

Figure 192: Electric Vehicles Market, the Netherlands, Public Charging Infrastructure, Capacity by Status, and Number of Projects (As of May 2023)

Figure 193: Electric Vehicles Market, the Netherlands, Average Selling Price, 2018–35

Figure 194: Norway Electric Vehicles Market, Snapshot, 2022

Figure 195: Electric Vehicles Market, Norway, Annual Sales (‘000s), 2018–2035

Figure 196: Electric Vehicles Market, Norway, Market Size ($B), 2018–2035

Figure 197: Electric Vehicles Market, Norway, Segmentation by Passenger Electric Vehicles Size (%)

Figure 198: Electric Vehicles Market, Norway, Segmentation by Commercial Electric Vehicles Size (%)

Figure 199: Electric Vehicles Market, Norway, Segmentation by Passenger Electric Vehicles Category (%)

Figure 200: Electric Vehicles Market, Norway, Segmentation by Commercial Electric Vehicles Category (%)

Figure 201: Electric Vehicles Market, Norway, Segmentation by Passenger Electric Vehicles Source (%)

Figure 202: Electric Vehicles Market, Norway, Segmentation by Commercial Electric Vehicles Source (%)

Figure 203: Electric Vehicles Market, Norway, Market Share (%), 2022

Figure 204: Electric Vehicles Market, Norway Passenger Electric Vehicles, Imports & Exports

Figure 205: Electric Vehicles Market, Norway Commercial Electric Vehicles, Imports & Exports

Figure 206: Electric Vehicles Market, Norway, Publicly Accessible Charging Points (in ‘000s), 2012–2022

Figure 207: Electric Vehicles Market, Norway, Announced Charging Projects, 2019–2021

Figure 208: Electric Vehicles Market, Norway, Public Charging Infrastructure, Capacity by Status and Number of Projects (As of May 2023)

Figure 209: Electric Vehicles Market, Norway, Average Selling Price, 2018-35

Figure 210: The UK Electric Vehicles Market, Snapshot, 2022

Figure 211: Electric Vehicles Market, the UK, Annual Sales (’000s), 2018–35

Figure 212: Electric Vehicles Market, the UK, Market Size ($B), 2018–35

Figure 213: Electric Vehicles Market, the UK, Segmentation by Passenger Electric Vehicles Size (%)

Figure 214: Electric Vehicles Market, the UK, Segmentation by Commercial Electric Vehicles Size (%)

Figure 215: Electric Vehicles Market, the UK, Segmentation by Passenger Electric Vehicles Category (%)

Figure 216: Electric Vehicles Market, the UK, Segmentation by Commercial Electric Vehicles Category (%)

Figure 217: Electric Vehicles Market, the UK, Segmentation by Passenger Electric Vehicles Source (%)

Figure 218: Electric Vehicles Market, the UK, Segmentation by Commercial Electric Vehicles Source (%)

Figure 219: Electric Vehicles Market, the UK, Market Share (%), 2022

Figure 220: Electric Vehicles Market, the UK Passenger Electric Vehicles, Imports and Exports

Figure 221: Electric Vehicles Market, the UK Commercial Electric Vehicles, Imports and Exports

Figure 222: Electric Vehicles Market, the UK, Publicly Accessible Charging Points (in ’000s), 2011–22

Figure 223: Electric Vehicles Market, the UK, Announced Charging Projects, 2011–22

Figure 224: Electric Vehicles Market, the UK, Public Charging Infrastructure, Capacity by Status, and Number of Projects (As of May 2023)

Figure 225: Electric Vehicles Market, the UK, Public Charging Infrastructure Projects (%), 2022

Figure 226: Electric Vehicles Market, the UK, Average Selling Price, 2018–35

Frequently asked questions

Currency USD
$3,995

Can be used by individual purchaser only

$11,985

Can be shared globally by unlimited users within the purchasing corporation e.g. all employees of a single company


Undecided about purchasing this report?

Enquire Before Buying Request a Free Sample

Get in touch to find out about multi-purchase discounts

reportstore@globaldata.com
Tel +44 20 7947 2745

Every customer’s requirement is unique. With over 220,000 construction projects tracked, we can create a tailored dataset for you based on the types of projects you are looking for. Please get in touch with your specific requirements and we can send you a quote.

Sample Report

We are confident about Electric Vehicles Market Analysis by Region, Propulsion Type, End-user Type and Forecast to 2030 report's unique quality. However, we want you to make the most beneficial decision for your business, so we offer free sample pages to help you:

  • Assess the relevance of the report
  • Evaluate the quality of the report
  • Justify the cost

Download your copy of the sample report and make an informed decision about whether the full report will provide you with the insights and information you need.

Below is a sample report to understand what you are buying

See what our customers are saying

“The GlobalData platform is our go-to tool for intelligence services. GlobalData provides an easy way to access comprehensive intelligence data around multiple sectors, which essentially makes it a one-for-all intelligence platform, for tendering and approaching customers.

GlobalData is very customer orientated, with a high degree of personalised services, which benefits everyday use. The highly detailed project intelligence and forecast reports can be utilised across multiple departments and workflow scopes, from operational to strategic level, and often support strategic decisions. GlobalData Analytics and visualisation solutions has contributed positively when preparing management presentations and strategic papers.”

Business Intelligence & Marketing Manager, SAL Heavy Lift

“COVID-19 has caused significant interference to our business and the COVID-19 intelligence from GlobalData has helped us reach better decisions around strategy. These two highlights have helped enormously to understand the projections into the future concerning our business units, we also utilise the project database to source new projects for Liebherr-Werk to use as an additional source to pitch for new business.”

Market Analyst & Management, Liebherr-Werk

Your daily news has saved me a lot of time and keeps me up-to-date with what is happening in the market, I like that you almost always have a link to the source origin. We also use your market data in our Strategic Business Process to support our business decisions. By having everything in one place on the Intelligence Center it has saved me a lot of time versus looking on different sources, the alert function also helps with this.

Head of Key Accounts, Saab AB

Having used several other market research companies, I find that GlobalData manages to provide that ‘difficult-to-get’ market data that others can’t, as well as very diverse and complete consumer surveys.

Marketing Intelligence Manager, Portugal Foods

Our experience with GlobalData has been very good, from the platform itself to the people. I find that the analysts and the account team have a high level of customer focus and responsiveness and therefore I can always rely on. The platform is more holistic than other providers. It is convenient and almost like a one stop shop. The pricing suite is highly competitive and value for our organisation.

I like reports that inform new segments such as the analysis on generation Z, millennials, the impact of COVID 19 to our banking customers and their new channel habits. Secondly the specialist insight on affluent sector significantly increases our understanding about this group of customers. The combination of those give us depth and breadth of the evolving market.

I’m in the business of answering and helping people make decisions so with the intelligence center I can do that, effectively and efficiently. I can share quickly key insights that answer and satisfy our country stakeholders by giving them many quality studies and primary research about competitive landscape beyond the outlook of our bank. It helps me be seen as an advisory partner and that makes a big difference. A big benefit of our subscription is that no one holds the whole data and because it allows so many people, so many different parts of our organisation have access, it enables all teams to have the same level of knowledge and decision support.

Head of Customer Insight and Research, Standard Chartered

“I know that I can always rely on Globaldata’s work when I’m searching for the right consumer and market insights. I use Globaldata insights to understand the changing market & consumer landscape and help create better taste & wellbeing solutions for our customers in food, beverage and healthcare industries.

Globaldata has the right data and the reports are of very high quality compared to your competitors. Globaldata not only has overall market sizes & consumer insights on food & beverages but also provides insights at the ingredient & flavour level. That is key for B2B companies like Givaudan. This way we understand our customers’ business and also gain insight to our unique industry”

Head of Consumer Sensory Insights, Givaudan

GlobalData provides a great range of information and reports on various sectors that is highly relevant, timely, easy to access and utilise.  The reports and data dashboards help engagement with clients; they provide valuable industry and market insights that can enrich client conversations and can help in the shaping of value propositions. Moreover, using GlobalData products has helped increase my knowledge of the finance sector, the players within it, and the general threats and opportunities.

I find the consumer surveys that are carried out to be extremely beneficial and not something I have seen anywhere else. They provided an insightful view of why and which consumers take (or don’t) particular financial products. This can help shape conversations with clients to ensure they make the right strategic decisions for their business.

One of the challenges I have found is that data in the payments space is often piecemeal. With GD all of the data I need is in one place, but it also comes with additional market reports that provide useful extra context and information. Having the ability to set-up alerts on relevant movements in the industry, be it competitors or customers, and have them emailed directly to me, ensures I get early sight of industry activity and don’t have to search for news.

Senior Account Manager, TSYS
Go even deeper with GlobalData Intelligence Center

Every Company Report we produce is powered by the GlobalData Intelligence Center.

Subscribing to our intelligence platform means you can monitor developments at Electric Vehicles Market Analysis by Region, Propulsion Type, End-user Type and Forecast to 2030 in real time.

  • Access a live Electric Vehicles Market Analysis by Region, Propulsion Type, End-user Type and Forecast to 2030 dashboard for 12 months, with up-to-the-minute insights.
  • Fuel your decision making with real-time deal coverage and media activity.
  • Turn insights on financials, deals, products and pipelines into powerful agents of commercial advantage.