Global Vinyl Chloride Monomer (VCM) Industry Outlook to 2024 – Capacity and Capital Expenditure Forecasts with Details of All Active and Planned Plants
Powered by ![]()
All the vital news, analysis, and commentary curated by our industry experts.

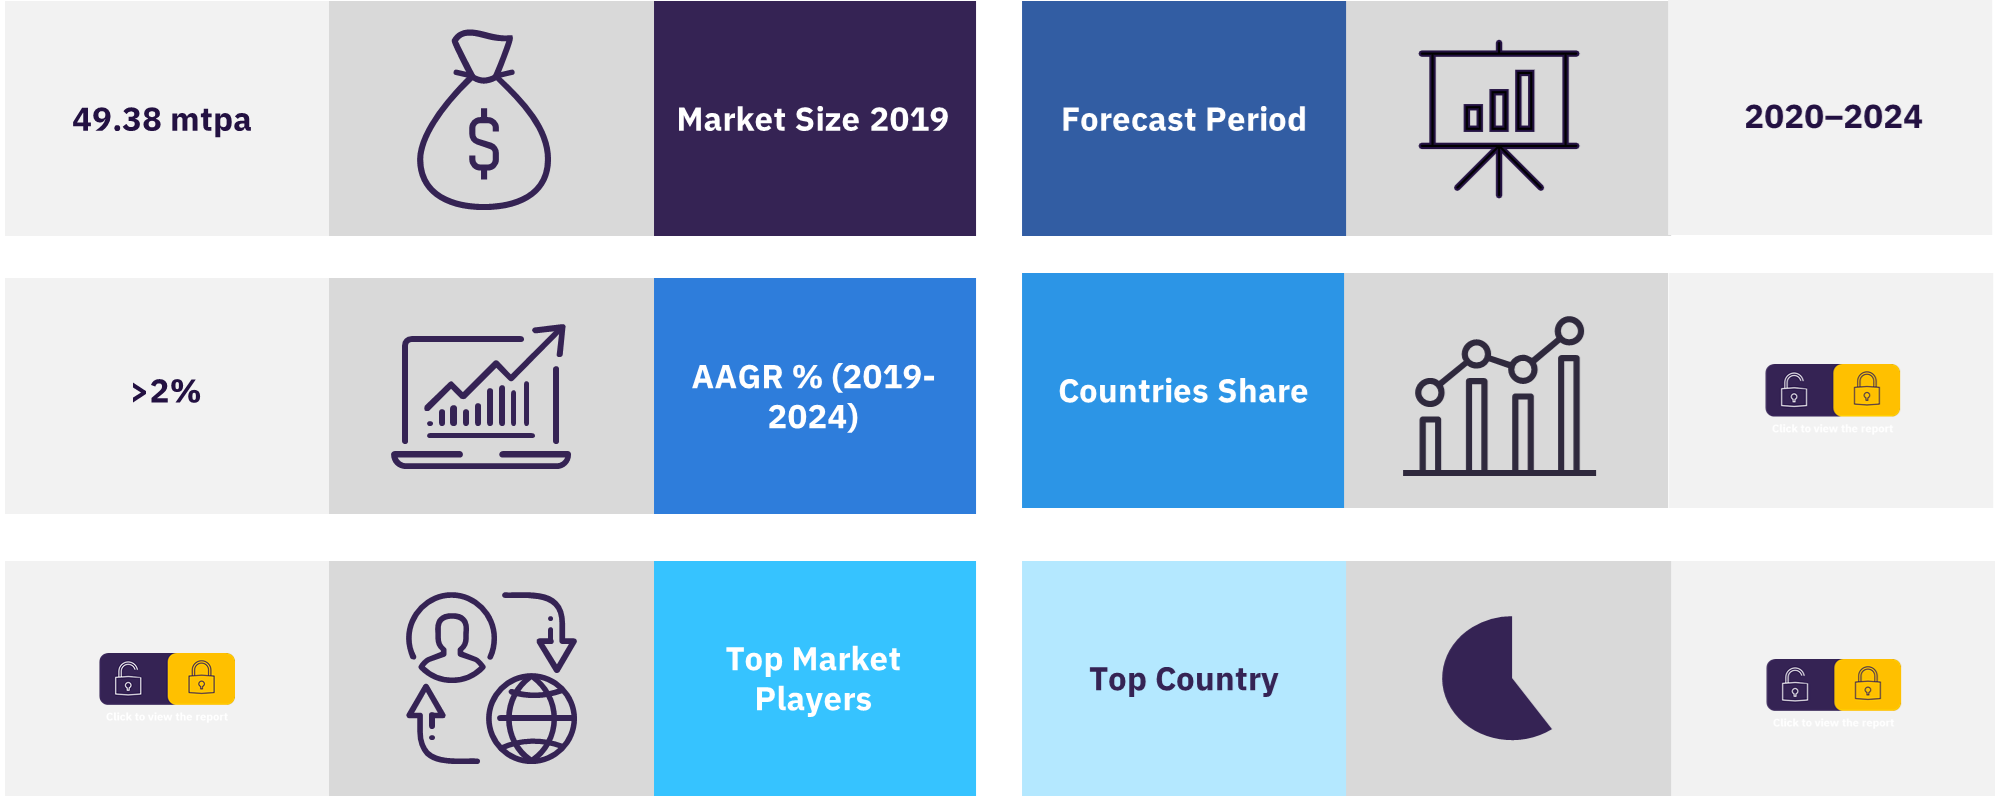
The global vinyl chloride monomer (VCM) market size was valued at 49.38 mtpa in 2019. The market is expected to grow at an AAGR of more than 2% during the period 2019-2024.
The global VCM market report provides industry details such as the plant’s name, status, and plant operator name for all active, planned, announced, suspended, and decommissioned plants globally by region and country for the period 2014-2024. The report also provides global and regional capital expenditure outlook by key countries, year on year, till 2024. The report offers a comparison of key countries based on contribution to global as well as regional plant capacities. The report also provides the installed plant capacity by production process and technology for the global VCM industry in 2019. Further, the report offers, planned and announced VCM plants along with the development stages for the period 2020–2024.
Global VCM market overview
For more insights on this report, download a free sample
Which are the key regions in the VCM industry?
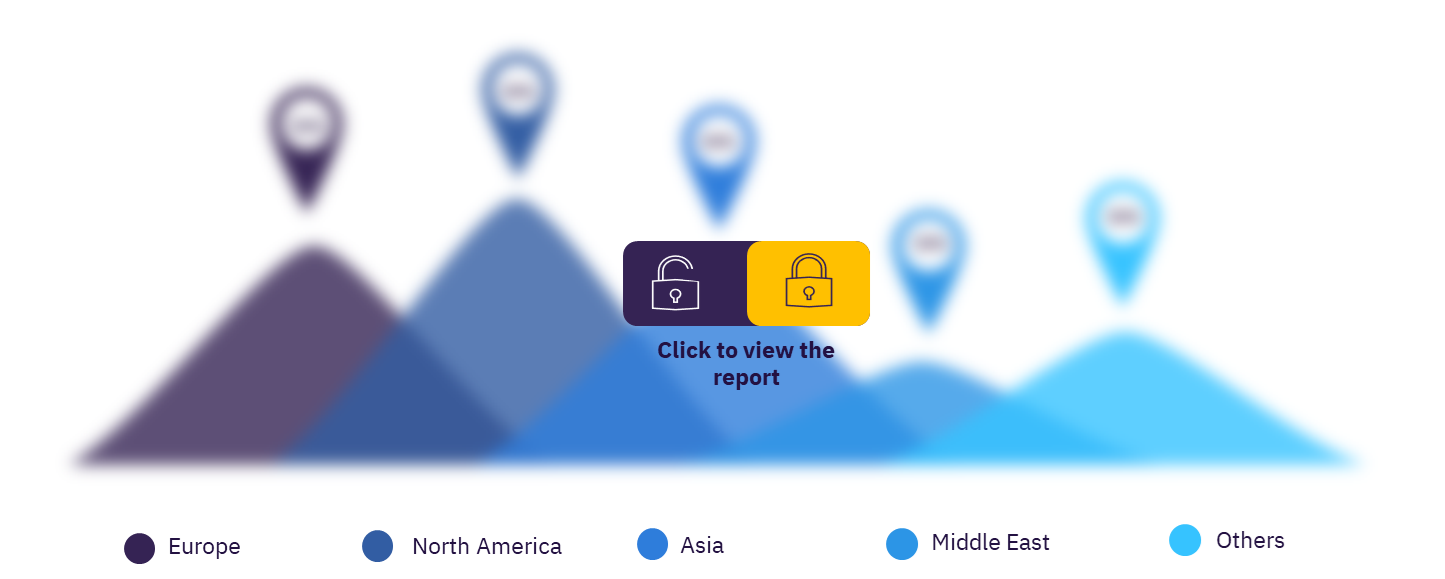
The key regions in the VCM industry are Africa, Asia, Europe, Former Soviet Union, Middle East, North America, South America. Among regions, Asia leads with the largest capacity contribution globally over the next five years, followed by North America and Europe.
Global VCM market, by key regions
For more regional insights, download a free sample
Which are the key countries in the VCM industry?
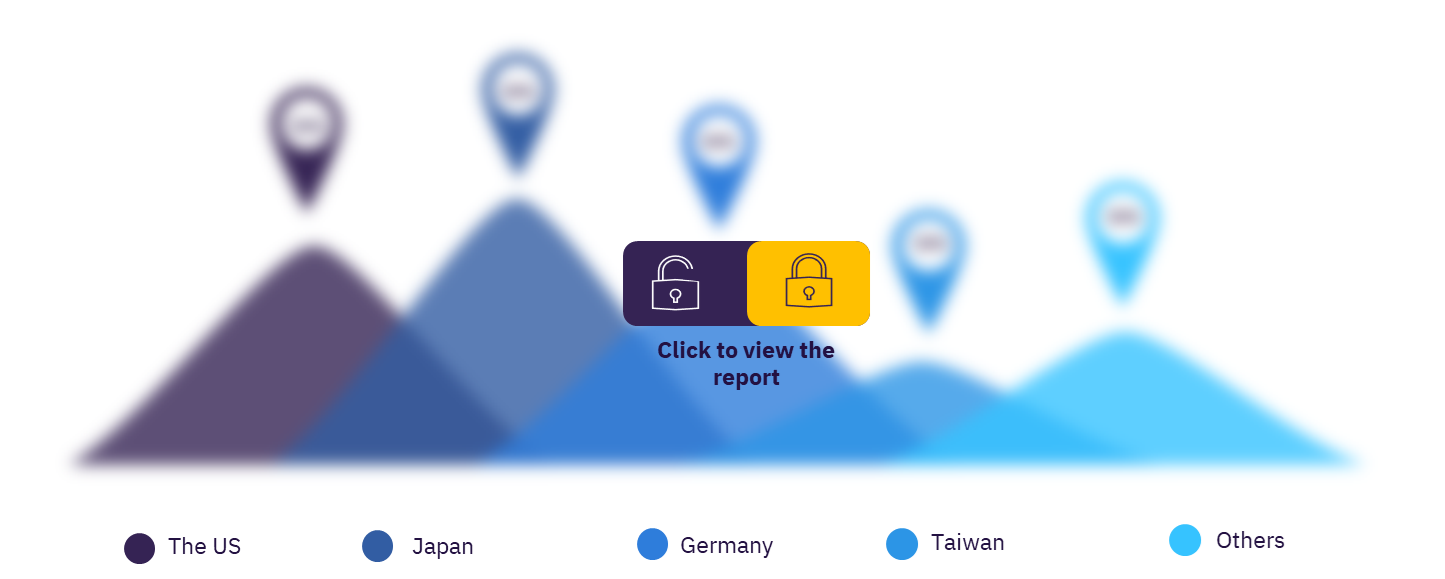
The key countries in the VCM industry are China, the US, Japan, Taiwan, Germany, South Korea, France, Russia, Belgium, and Brazil. Among the key countries, China led with the largest capacity contribution globally, followed by the US.
Global VCM industry, by key countries
For more country insights, download a free sample
Which are the key plants in the VCM industry?
The key plants in the VCM industry are Shintech Plaquemine Vinyl Chloride Monomer (VCM) Plant 3, Tianjin Bohai Chemical Development Company Tianjin Vinyl Chloride Monomer (VCM) Plant, Shenhua Yulin Vinyl Chloride Monomer (VCM) Plant, Vinythai Map Ta Phut Vinyl Chloride Monomer (VCM) Plant, Guangxi Huayi New Materials Qinzhou Vinyl Chloride Monomer (VCM) Plant, Wanhua Chemical Yantai Vinyl Chloride Monomer (VCM) Plant, HPCL GAIL JV Kakinada Vinyl Chloride Monomer (VCM) Plant, ANWIL Wloclawek Vinyl Chloride Monomer (VCM) Plant, INOVYN Rafnes Vinyl Chloride Monomer (VCM) Plant, and Westlake Chemical Corporation Geismar Vinyl Chloride Monomer (VCM) Plant.
Which are the key production process in the VCM industry?
The key production process in the VCM industry are EDC cracking, calcium carbide/acetylene route, and others. EDC cracking has the highest VCM market share.
Global VCM industry, by production processes

For more production process insights, download a free sample
Which are the key companies in the VCM industry?
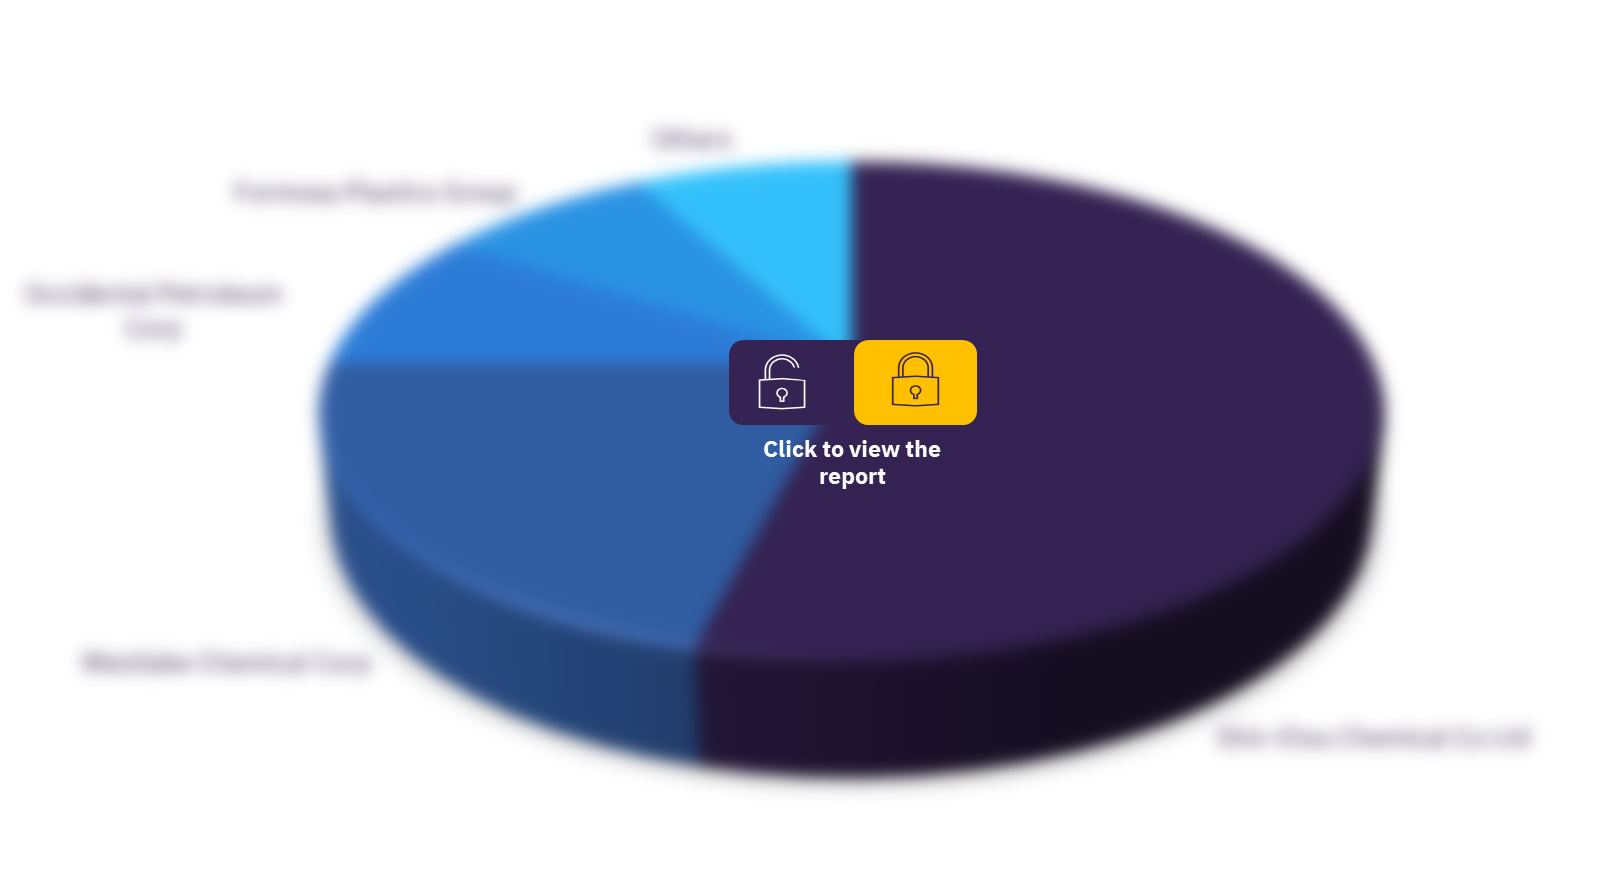
The key companies in the VCM industry are Westlake Chemical Corp, Occidental Petroleum Corp, Formosa Plastics Group, Shin-Etsu Chemical Co Ltd, Ineos Ltd, LG Chem Ltd, Tosoh Corp, Kem One SAS, International Chemical Investors Group GmbH, and Hanwha Corp.
Global VCM industry, by key companies
To know more about key companies, download a free sample
Market report scope
| Market size 2019 | 49.38 mtpa |
| AAGR | >2% (2019-2024) |
| Forecast period | 2020-2024 |
| Key regions | Africa, Asia, Europe, Former Soviet Union, Middle East, North America, South America |
| Key countries | China, the US, Japan, Taiwan, Germany, South Korea, France, Russia, Belgium, and Brazil |
| Key plants | Shintech Plaquemine Vinyl Chloride Monomer (VCM) Plant 3, Tianjin Bohai Chemical Development Company Tianjin Vinyl Chloride Monomer (VCM) Plant, Shenhua Yulin Vinyl Chloride Monomer (VCM) Plant, Vinythai Map Ta Phut Vinyl Chloride Monomer (VCM) Plant, Guangxi Huayi New Materials Qinzhou Vinyl Chloride Monomer (VCM) Plant, Wanhua Chemical Yantai Vinyl Chloride Monomer (VCM) Plant, HPCL GAIL JV Kakinada Vinyl Chloride Monomer (VCM) Plant, ANWIL Wloclawek Vinyl Chloride Monomer (VCM) Plant, INOVYN Rafnes Vinyl Chloride Monomer (VCM) Plant, and Westlake Chemical Corporation Geismar Vinyl Chloride Monomer (VCM) Plant |
| Key production processes | EDC Cracking, Calcium Carbide/Acetylene Route, and Others |
| Key companies | Westlake Chemical Corp, Occidental Petroleum Corp, Formosa Plastics Group, Shin-Etsu Chemical Co Ltd, Ineos Ltd, LG Chem Ltd, Tosoh Corp, Kem One SAS, International Chemical Investors Group GmbH, and Hanwha Corp |
Scope
- Global VCM capacity outlook by region
- Global VCM capacity outlook by country
- VCM planned and announced plants details
- Capacity share of the major VCM producers globally
- Global VCM capital expenditure outlook by region
- Global VCM capital expenditure outlook by country
Scope
Global VCM capacity outlook by region
Global VCM capacity outlook by country
VCM planned and announced plants details
Capacity share of the major VCM producers globally
Global VCM capital expenditure outlook by region
Global VCM capital expenditure outlook by country
Reasons to Buy
- Obtain the most up to date information available on all active and planned VCM plants globally
- Identify opportunities in the global VCM industry with the help of upcoming projects and capital expenditure outlook
- Facilitate decision making on the basis of strong historical and forecast of VCM capacity data
Table of Contents
Table
Figures
Frequently asked questions
-
What was the VCM market size in the year 2019?
The VCM market size was 49.38 mtpa in the year 2019.
-
What was the VCM market growth rate?
The VCM market is expected to grow at an AAGR of more than 2% during 2019-2024.
-
Which are the key regions in the VCM industry?
The key regions in the VCM industry are Africa, Asia, Europe, Former Soviet Union, Middle East, North America, South America.
-
Which are the key countries in the VCM industry?
The key countries in the VCM industry are China, the US, Japan, Taiwan, Germany, South Korea, France, Russia, Belgium, and Brazil.
-
Which are the key plants in the VCM industry?
The key plants in the VCM industry are Shintech Plaquemine Vinyl Chloride Monomer (VCM) Plant 3, Tianjin Bohai Chemical Development Company Tianjin Vinyl Chloride Monomer (VCM) Plant, Shenhua Yulin Vinyl Chloride Monomer (VCM) Plant, Vinythai Map Ta Phut Vinyl Chloride Monomer (VCM) Plant, Guangxi Huayi New Materials Qinzhou Vinyl Chloride Monomer (VCM) Plant, Wanhua Chemical Yantai Vinyl Chloride Monomer (VCM) Plant, HPCL GAIL JV Kakinada Vinyl Chloride Monomer (VCM) Plant, ANWIL Wloclawek Vinyl Chloride Monomer (VCM) Plant, INOVYN Rafnes Vinyl Chloride Monomer (VCM) Plant, and Westlake Chemical Corporation Geismar Vinyl Chloride Monomer (VCM) Plant.
-
Which are the key production process in the VCM industry?
The key production process in the VCM industry are EDC cracking, calcium carbide/acetylene route, and others. EDC cracking has the highest share.
-
Which are the key companies in the VCM industry?
The key companies in the VCM industry are Westlake Chemical Corp, Occidental Petroleum Corp, Formosa Plastics Group, Shin-Etsu Chemical Co Ltd, Ineos Ltd, LG Chem Ltd, Tosoh Corp, Kem One SAS, International Chemical Investors Group GmbH, and Hanwha Corp.
Get in touch to find out about multi-purchase discounts
reportstore@globaldata.com
Tel +44 20 7947 2745
Every customer’s requirement is unique. With over 220,000 construction projects tracked, we can create a tailored dataset for you based on the types of projects you are looking for. Please get in touch with your specific requirements and we can send you a quote.
Sample Report
Global Vinyl Chloride Monomer (VCM) Industry Outlook to 2024 – Capacity and Capital Expenditure Forecasts with Details of All Active and Planned Plants was curated by the best experts in the industry and we are confident about its unique quality. However, we want you to make the most beneficial decision for your business, so we offer free sample pages to help you:
- Assess the relevance of the report
- Evaluate the quality of the report
- Justify the cost
Download your copy of the sample report and make an informed decision about whether the full report will provide you with the insights and information you need.


