High Performance Computing Market Trends and Analysis by Region, Component, Deployment, Application and Segment Forecast to 2026

Powered by

Access in-depth insight and stay ahead of the market

High Performance Computing Market Report Overview

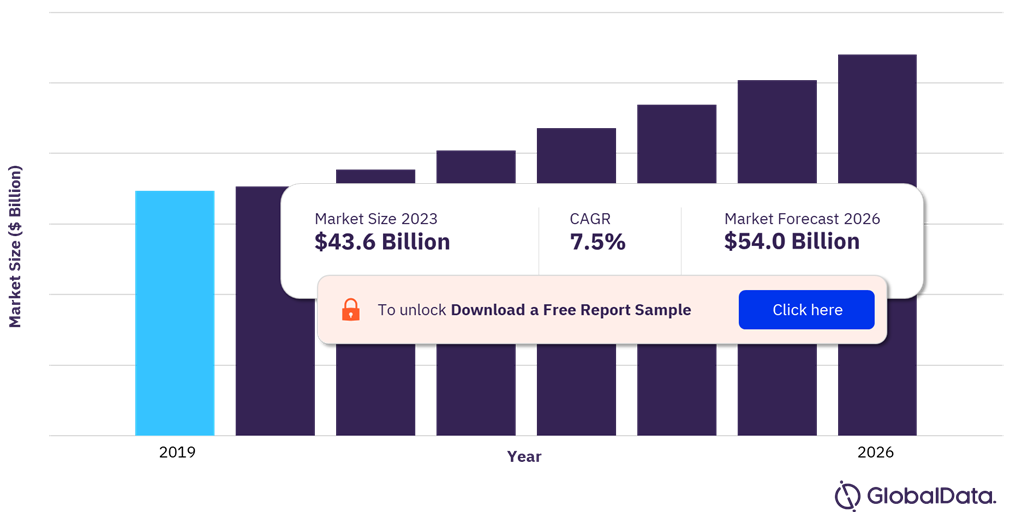
The high performance computing market size will be valued at $ 43.6 billion in 2023 and expected to grow at a compound annual growth rate (CAGR) of 7.5% over the forecast period. HPC systems’ ability to expedite computation of large volumes of data makes them a preferred option for solving problems in science, academia, technology, and businesses. As cutting-edge technologies like Machine Learning (ML), Internet of Things (IoT), and Artificial Intelligence (AI) evolve, they require large volumes of data. Growing use of such technologies is anticipated to be a key driving factor for high-performance computing demand over the forecast period.

High Performance Computing Market Outlook, 2019-2026 ($ Billion)

High Performance Computing Market Outlook, 2019-2026 ($ Billion)


View Sample Report for Additional Insights on the High Performance Computing Market Forecast, Download a Free Report Sample

Until recently, HPC systems ran in local data centers, but new solutions are emerging. Among them, HPC deployed in the cloud is the most prominent. Market trends suggest that cloud is the fastest-growing segment within HPC, which is itself one of their fastest-growing business units. Like everything else, HPC is moving to the cloud because of the flexibility that cloud solutions offer. Cloud computing can be used in two ways: to increase the capacity of in-house infrastructure or to increase the agility of a company that shares data across more than one site. The cloud represents a more agile approach to operating an IT architecture, particularly supporting modernizing enterprise applications. Benefits such as flexibility, cost effectiveness, scalability, and democratization of access are expected to augment HPC cloud systems’ demand.

Despite all its advantages, not everything can be done in the cloud. Some clients who had moved their HPC operations to the cloud have later moved some or all operations back on-premise. Security, regulations, and latency & performance issues are posing a challenge to cloud adoption. To make the most of the cloud benefits while also addressing its shortcomings, vendors have started offering hybrid solutions where HPC operations are split between on-premise and cloud.

High-performance edge computing could potentially address the shortcomings of both local HPC data centers and HPC deployed in the cloud. Edge computing refers to the deployment and use of computer processing close to where data is collected. The benefits of edge computing include improved performance and cost savings that can be achieved when developing, hosting, and powering applications nearer to consumption points. HPC deployed at the edge can bring high-performing processing power to sectors such as retail, live entertainment, and gaming, where data must be processed close to where it is generated to minimize latency.

Technological advancements such as HPC as a Service (HPCaaS), edge computing, and computational requirements for large volumes of data are factors anticipated to augment market growth over the next five years. Additionally, progress at a microarchitectural level such as faster interconnections, higher computing densities, scalable storage, and efficient infrastructure is expected to promote the adoption of modern solutions.

High Performance Computing Market Segmentation by Component

Servers dominated the market in 2022 with a revenue share of more than 40% and is expected to continue its domination over the forecast period. HPC servers use a combination of CPUs, MEMS, and AI chips. CPUs have been at the heart of powering data centers for decades, but their architectures are not best suited for new types of workloads driven by technologies such as AI and the IoT. GPUs are more powerful than CPUs, but the two chips are used in combination in HPC clusters as they complement each other. Thus, the imperative nature of servers in HPC clusters is expected to drive segmental growth.

Asia Pacific High Performance Computing Market Share by Component, 2023 (%)

Asia Pacific High Performance Computing Market Share by Component, 2023 (%)


Fetch Sample PDF for High Performance Computing (HPC) Segment-Specific Revenues and Shares, Download a Free Report Sample

In addition to servers, the component segment also includes storage, network equipment, software, services, and cloud. With a compounded annual growth rate of 3.6% from 2022 to 2026, the services segment is projected to record a modest growth. Services include maintenance & repair, system engineering, system integration, training, programming, and other services. The advent of HPC cloud led to a rise in service requirements, especially training and programming services. However, since major players have established their cloud services, the services segment is expected to record a flat growth over the forecast period.

High Performance Computing Market Segmentation by Deployment

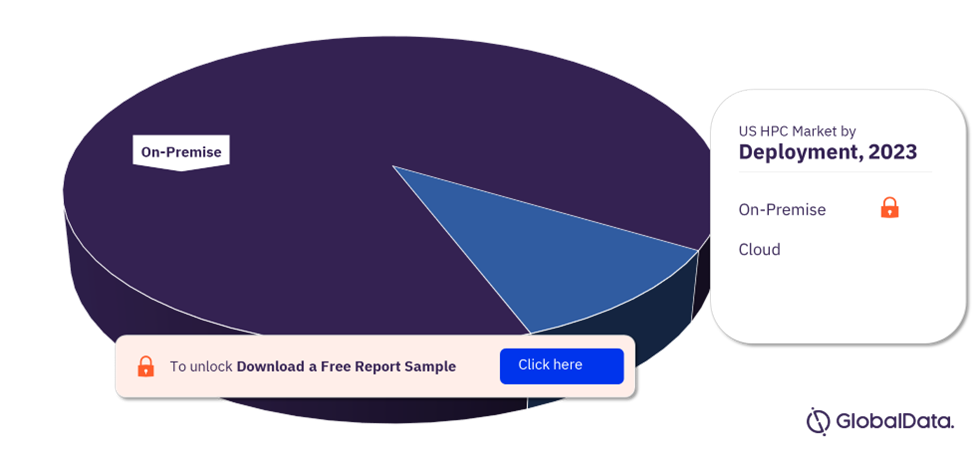
On-premise high performance computing systems are traditionally used and are still a preferred among major market players. Security concerns over sharing private information with cloud service providers pushes companies towards adopting on-premise systems. Increasing awareness of data protection, is expected to upkeep the demand for on-premise high-performance computing systems in the coming years.

US High Performance Computing Market Share by Deployment, 2023 (%)

US High Performance Computing Market Share by Deployment, 2023 (%)


Fetch Sample PDF for High Performance Computing Segment-Specific Revenues and Shares, Download a Free Report Sample

Cloud based HPC systems is projected to record fastest growth with a CAGR exceeding 15% in the next four years. Cloud represents a more agile approach to operating an IT architecture, particularly supporting modernizing enterprise applications. Many vendors have moved from selling equipment to providing HPC as a service (HPCaaS). HPCaaS’s rise is linked to the emergence of the cloud as an HPC solution. HPCaaS can be a compelling option for end-users. It puts intense data processing and workloads that require high-performance within reach of companies that lack the necessary capital to hire skilled staff and invest in hardware. HPCaaS brings HPC capabilities to those companies that cannot afford to develop HPC knowledge and infrastructure in-house

High Performance Computing Market Segmentation by Application

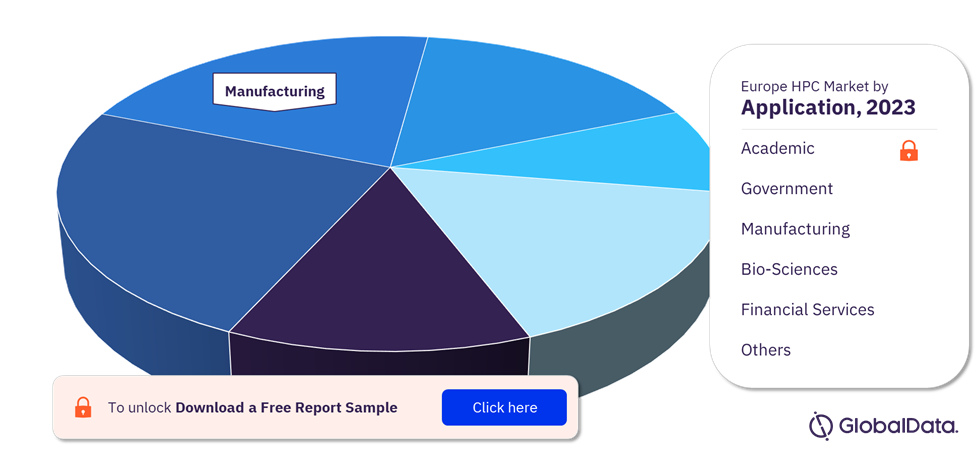
Based on applications, HPC market is categorized into academic, government, manufacturing, bio-sciences, financial services, and others. Bio-Science related applications prominently used HPC solutions resulting in the segments’ healthy growth, accounting 9.0% over the next five years. The segment includes genomics, bioinformatics, pharmaceutical research, drug discovery, and proteomics related applications. Research remains one of the leading HPC use cases. Today’s most powerful computers are used in medicine and biosciences. During the COVID-19 pandemic, powerful computing clusters have run models helping scientists understand the virus and how it spreads, make advancements in therapeutics, and even produce vaccines.

Europe High Performance Computing Market Share by Application, 2023 (%)

Europe High Performance Computing Market Share by Application, 2023 (%)


Fetch Sample PDF for High Performance Computing Segment-Specific Revenues and Shares, Download a Free Report Sample

In the private sector, financial services are one of the most important users of HPC. Investment firms use the technology to predict stock trends and trade with millisecond timing. Banks also use HPC to improve fraud detection. With a centralized system of fraud detection, information is gathered from all the available sources. Such systems can help detect and prevent cyberattacks, improve data privacy, enhance data protection, and support investigations. The system that is installed must have the capability to detect anomalies.

High Performance Computing Market Analysis by Region

Asia Pacific is anticipated to record a compound annual growth rate of more than 8% over the forecast period. The regional demand was led by rapid adoption of HPC solutions in China, India, and Japan. Possessing powerful supercomputers has always been a way for nation-states to demonstrate their technical capabilities. It also has implications for their security. According to statistics, China has more than 225 computers in the list of the top 500 supercomputers in the world. Some of the leading commercial HPC players hail from China, including Huawei, Lenovo, and Inspur. The Chinese government regards leadership in supercomputing as vital to its national security and the future of its defense, aerospace, energy, materials, biotech, and pharmaceuticals industries.

Global High Performance Computing Market Share by Region, 2023 (%)

Global High Performance Computing Market Share by Region, 2023 (%)


View Sample Report for Additional High Performance Computing Market Insights, Download a Free Report Sample

North America is characterized by early adoption of technology that helps companies to market newer products in the region. Led by the US, the region held a sizeable revenue share of the high performance computing market in 2022. The region is also characterized by presence of large volume of data center, which makes it conducive for HPC adoption as well.

High Performance Computing Market – Competitive Landscape

Competition in the HPC industry is characterized by the presence of multiple vendors operating across different layers of value chain. Companies operating in the market have strong hold in their respective solution offerings. For instance, Hewlett Packard Enterprise Co and Dell Technologies Inc have a strong hold across all the components of an HPC cluster. Companies such as DataDirect Networks Inc,       Juniper Networks Inc, and Seagate Technology Holdings PLC focus on specific hardware equipment.

Leading Players in the High Performance Computing Market

  • Hewlett Packard Enterprise Co
  • Dell Technologies Inc
  • Lenovo Group Ltd
  • Inspur Software Co Ltd
  • Atos SE
  • International Business Machines Corp
  • Fujitsu Ltd

Other High Performance Computing Market Vendors Mentioned

Inspur Software Co Ltd, Atos SE, NEC Corp, DataDirect Networks Inc, Seagate Technology Holdings PLC, NetApp Inc, Google LLC, Huawei Investment & Holding Co Ltd, Amazon Web Services Inc, Cisco Systems Inc, Oracle Corp, VMware Inc, and Juniper Networks Inc

To Know More About Leading High Performance Computing Market Players, Download a Free Report Sample

High Performance Computing Market Research Scope

Market Size in 2023 $43.6 billion
Market Size in 2026 $54.0 billion
CAGR 7.5% from 2022-2026
Forecast Period 2022-2026
Historic Data 2019-2021
Report Scope & Coverage Revenue Forecast, Company Market Share, and Growth Trends, Technology Trends, Macroeconomic Trends
Component Segment Server, Storage, Network, Software, Services, and Cloud
Deployment Segment On-Premise and Cloud
Application Segment Academic, Government, Manufacturing, Bio-Sciences, Financial Services, and Others
Key Companies Hewlett Packard Enterprise Co, Lenovo Group Ltd, International Business Machines Corp, Dell Technologies Inc, Huawei Investment & Holding Co Ltd, Fujitsu Ltd, Intel Corp, Advanced Micro Devices Inc, NVIDIA Corp, STMicroelectronics NV

High Performance Computing Market Segments and Scope

GlobalData Plc has segmented the high performance computing market report by component, deployment, application, and region:

High Performance Computing (HPC) Component Outlook (Revenue, USD Million, 2019-2026)

  • Server
  • Storage
  • Network
  • Software
  • Services
  • Cloud 

High Performance Computing (HPC) Deployment Outlook (Revenue, USD Million, 2019-2026)

  • On-Premise
  • Cloud

High Performance Computing (HPC) Application Outlook (Revenue, USD Million, 2019-2026)

  • Academic
  • Government
  • Manufacturing
  • Bio-Sciences
  • Financial Services
  • Others

High Performance Computing (HPC) Regional Outlook (Revenue, USD Million, 2019-2026)

  • North America
  • US
  • Canada
  • Europe 
  • UK
  • Germany
  • France
  • Italy
  • Spain
  • Netherlands
  • Switzerland
  • Rest of Europe
  • Asia Pacific 
  • China
  • India
  • Japan
  • Australia
  • South Korea
  • Singapore
  • Rest of Asia Pacific
  • South & Central America
  • Brazil
  • Mexico
  • Rest of South & Central America
  • Middle East & Africa
  • United Arab Emirates (UAE)
  • Saudi Arabia
  • South Africa
  • Rest of Middle East & Africa

The market intelligence report provides an in-depth analysis of the following –

  • High performance computing market outlook: analysis as well as historical figures and forecasts of revenue opportunities from the component, deployment, and application segments.
  • The competitive landscape: an examination of the positioning of leading players in the high performance computing market.
  • Company snapshots: analysis of the market position of leading service providers in the HPC market.
  • Underlying assumptions behind our published base-case forecasts, as well as potential market developments that would alter, either positively or negatively, our base-case outlook.

Scope

This report provides overview and service addressable market for High Performance Computing (HPC).

It identifies the key trends impacting growth of the market over the next 12 to 24 months, split into four categories: technology trends and macroeconomic trends

It includes global market forecasts for the High Performance Computing (HPC) industry and analysis of patents, company filings, and hiring trends.

It contains details of M&A and VF deals in the big data space.

The detailed value chain consists of five main aspects: component, equipment, data center solutions, and end users.

Reasons to Buy

  • This market intelligence report offers a thorough, forward-looking analysis of the HPC market, components, application, and key opportunities in a concise format to help executives build proactive and profitable growth strategies.
  • Accompanying GlobalData’s Forecast products, the report examines the assumptions and drivers behind ongoing and upcoming trends in high performance computing market.
  • The report also highlights key component segments (Server, Storage, Networking, Software, Services, and Cloud)
  • The report also highlights key deployment segments (On-Premise and Cloud)
  • The report also highlights key application segments (Academic, Government, Manufacturing, Bio-Sciences, Financial Services, and Others)
  • With more than 100 charts and tables, the report is designed for an executive-level audience, boasting presentation quality.
  • The report provides an easily digestible market assessment for decision-makers built around in-depth information gathered from local market players, which enables executives to quickly get up to speed with the current and emerging trends in High Performance Computing (HPC)
  • The broad perspective of the report coupled with comprehensive, actionable detail will help high performance computing stakeholders, service providers, and other high performance computing players succeed in growing of the high performance computing  market globally.

Table of Contents

CHAPTER 01 Executive Summary

1.1 High Performance Computing (HPC) Market Snapshot, 2021 & 2026 (US$ Mn)

CHAPTER 02 Research Scope & Segmentation

CHAPTER 03 High Performance Computing (HPC) Industry Trend Analysis

3.1 High Performance Computing (HPC) – Industry Value Chain

3.1.1 COMPONENTS

3.1.1.1 Semiconductors

3.1.2 EQUIPMENT

3.1.2.1 Servers

3.1.2.2 Storage Devices

3.1.2.3 Network Equipment

3.1.3 DATA CENTER SOLUTIONS

3.1.3.1 On-premise HPC Data Center

3.1.3.2 HPC in the Cloud

3.1.3.3 HPC Deployed at the Edge

3.1.3.4 Hybrid Solutions

3.1.4 END-USERS

3.1.4.1 Government Academia

3.1.4.2 Financial Services

3.1.4.3 Oil & Gas

3.1.4.4 Entertainment

3.1.4.5 Retail

3.1.4.6 Manufacturing

3.2 High Performance Computing (HPC) – Market Variables & Impact Analysis

3.2.1 MARKET DRIVER ANALYSIS

3.2.1.1 Growing Popularity of Edge Computing

3.2.1.2 Artificial Intelligence (AI) and Machine Learning (ML) Technologies Stemming the Growth of HPC

3.2.1.3 Increasing Adoption of Cloud Computing Coupled with the Provision of HPC as a Service (HPCaaS)

3.2.1.4 Emerging Use Cases Expected to Propel Market Growth

3.2.2 MARKET RESTRAINTS/CHALLENGES ANALYSIS

3.2.2.1 High Initial Cost Coupled with Lack of Expertise

3.2.2.2 Data Security Concerns

3.3 High Performance Computing (HPC) Market Structure – PORTER’s Analysis

3.4 High Performance Computing (HPC) Market Structure – PEST Analysis

3.5 Big Data – Mergers & Acquisitions (M&A), 2018 – 2022 (YTD)

3.5.1 M&A ACTIVITY DASHBOARD

3.6 Big Data – Patent Analysis, 2018 – 2022 (YTD)

3.6.1 PATENT ANALYTICS DASHBOARD

3.7 Big Data – Job Analysis, 2021

3.7.1 JOB ANALYTICS DASHBOARD

3.8 Big Data – Venture Financing Analysis, 2018 – 2022 (YTD)

3.8.1 VENTURE FINANCING DASHBOARD

3.9 Big Data – Social Media Analysis, 2018 – 2022 (YTD)

3.9.1 SOCIAL MEDIA ANALYTICS DASHBOARD

3.10 Technology Trends

3.11 Macroeconomic Trends

3.12 High Performance Computing (HPC) Market – COVID-19 Impact Analysis

3.13 High Performance Computing (HPC) Timeline

CHAPTER 04 Global HPC Market Revenue Opportunity

4.1 Global Market Revenue Snapshot, 2019 – 2026 (US$ Mn)

4.2 Global HPC Market by Deployment, 2019 – 2026 (US$ Mn)

4.3 Global HPC Market by Component, 2019 – 2026 (US$ Mn)

4.4 Global HPC Market by Application, 2019 – 2026 (US$ Mn)

CHAPTER 05 HPC Market Regional Outlook

5.1 HPC Market – Regional Deep Dive, 2019 – 2026 (US$ Mn)

5.2 North America HPC Market Snapshot, 2019 – 2026 (US$ Mn)

5.2.1 NORTH AMERICA HPC MARKET SIZE & FORECASTS, 2019 – 2026 (US$ MN)

5.2.1.1 North America HPC Market by Deployment, 2019 – 2026 (US$ Mn)

5.2.1.2 North America HPC Market by Component, 2019 – 2026 (US$ Mn)

5.2.1.3 North America HPC Market by Application, 2019 – 2026 (US$ Mn)

5.2.2 US HPC MARKET SIZE & FORECASTS, 2019 – 2026 (US$ MN)

5.2.2.1 US HPC Market by Deployment, 2019 – 2026 (US$ Mn)

5.2.2.2 US HPC Market by Component, 2019 – 2026 (US$ Mn)

5.2.2.3 US HPC Market by Application, 2019 – 2026 (US$ Mn)

5.2.3 CANADA HPC MARKET SIZE & FORECASTS, 2019 – 2026 (US$ MN)

5.2.3.1 Canada HPC Market by Deployment, 2019 – 2026 (US$ Mn)

5.2.3.2 Canada HPC Market by Component, 2019 – 2026 (US$ Mn)

5.2.3.3 Canada HPC Market by Application, 2019 – 2026 (US$ Mn)

5.3 Europe HPC Market Snapshot, 2019 – 2026 (US$ Mn)

5.3.1 EUROPE HPC MARKET SIZE & FORECASTS, 2019 – 2026 (US$ MN)

5.3.1.1 Europe HPC Market by Deployment, 2019 – 2026 (US$ Mn)

5.3.1.2 Europe HPC Market by Component, 2019 – 2026 (US$ Mn)

5.3.1.3 Europe HPC Market by Application, 2019 – 2026 (US$ Mn)

5.3.2 UK HPC MARKET SIZE & FORECASTS, 2019 – 2026 (US$ MN)

5.3.2.1 UK HPC Market by Deployment, 2019 – 2026 (US$ Mn)

5.3.2.2 UK HPC Market by Component, 2019 – 2026 (US$ Mn)

5.3.2.3 UK HPC Market by Application, 2019 – 2026 (US$ Mn)

5.3.3 GERMANY HPC MARKET SIZE & FORECASTS, 2019 – 2026 (US$ MN)

5.3.3.1 Germany HPC Market by Deployment, 2019 – 2026 (US$ Mn)

5.3.3.2 Germany HPC Market by Component, 2019 – 2026 (US$ Mn)

5.3.3.3 Germany HPC Market by Application, 2019 – 2026 (US$ Mn)

5.3.4 FRANCE HPC MARKET SIZE & FORECASTS, 2019 – 2026 (US$ MN)

5.3.4.1 France HPC Market by Deployment, 2019 – 2026 (US$ Mn)

5.3.4.2 France HPC Market by Component, 2019 – 2026 (US$ Mn)

5.3.4.3 France HPC Market by Application, 2019 – 2026 (US$ Mn)

5.3.5 ITALY HPC MARKET SIZE & FORECASTS, 2019 – 2026 (US$ MN)

5.3.5.1 Italy HPC Market by Deployment, 2019 – 2026 (US$ Mn)

5.3.5.2 Italy HPC Market by Component, 2019 – 2026 (US$ Mn)

5.3.5.3 Italy HPC Market by Application, 2019 – 2026 (US$ Mn)

5.3.6 NETHERLANDS HPC MARKET SIZE & FORECASTS, 2019 – 2026 (US$ MN)

5.3.6.1 Netherlands HPC Market by Deployment, 2019 – 2026 (US$ Mn)

5.3.6.2 Netherlands HPC Market by Component, 2019 – 2026 (US$ Mn)

5.3.6.3 Netherlands HPC Market by Application, 2019 – 2026 (US$ Mn)

5.3.8 RUSSIA HPC MARKET SIZE & FORECASTS, 2019 – 2026 (US$ MN)

5.3.8.1 Russia HPC Market by Deployment, 2019 – 2026 (US$ Mn)

5.3.8.2 Russia HPC Market by Component, 2019 – 2026 (US$ Mn)

5.3.8.3 Russia HPC Market by Application, 2019 – 2026 (US$ Mn)

5.3.9 SPAIN HPC MARKET SIZE & FORECASTS, 2019 – 2026 (US$ MN)

5.3.9.1 Spain HPC Market by Deployment, 2019 – 2026 (US$ Mn)

5.3.9.2 Spain HPC Market by Component, 2019 – 2026 (US$ Mn)

5.3.9.3 Spain HPC Market by Application, 2019 – 2026 (US$ Mn)

5.3.10 SWITZERLAND HPC MARKET SIZE & FORECASTS, 2019 – 2026 (US$ MN)

5.3.10.1 Switzerland HPC Market by Deployment, 2019 – 2026 (US$ Mn)

5.3.10.2 Switzerland HPC Market by Component, 2019 – 2026 (US$ Mn)

5.3.10.3 Switzerland HPC Market by Application, 2019 – 2026 (US$ Mn)

5.3.11 REST OF EUROPE HPC MARKET SIZE & FORECASTS, 2019 – 2026 (US$ MN)

5.3.11.1 Rest of Europe HPC Market by Deployment, 2019 – 2026 (US$ Mn)

5.3.11.2 Rest of Europe HPC Market by Component, 2019 – 2026 (US$ Mn)

5.3.11.3 Rest of Europe HPC Market by Application, 2019 – 2026 (US$ Mn)

5.4 Asia Pacific HPC Market Snapshot, 2019 – 2026 (US$ Mn)

5.4.1 ASIA PACIFIC HPC MARKET SIZE & FORECASTS, 2019 – 2026 (US$ MN)

5.4.1.1 Asia Pacific HPC Market by Deployment, 2019 – 2026 (US$ Mn)

5.4.1.2 Asia Pacific HPC Market by Component, 2019 – 2026 (US$ Mn)

5.4.1.3 Asia Pacific HPC Market by Application, 2019 – 2026 (US$ Mn)

5.4.2 CHINA HPC MARKET SIZE & FORECASTS, 2019 – 2026 (US$ MN)

5.4.2.1 China HPC Market by Deployment, 2019 – 2026 (US$ Mn)

5.4.2.2 China HPC Market by Component, 2019 – 2026 (US$ Mn)

5.4.2.3 China HPC Market by Application, 2019 – 2026 (US$ Mn)

5.4.3 INDIA HPC MARKET SIZE & FORECASTS, 2019 – 2026 (US$ MN)

5.4.3.1 India HPC Market by Deployment, 2019 – 2026 (US$ Mn)

5.4.3.2 India HPC Market by Component, 2019 – 2026 (US$ Mn)

5.4.3.3 India HPC Market by Application, 2019 – 2026 (US$ Mn)

5.4.4 JAPAN HPC MARKET SIZE & FORECASTS, 2019 – 2026 (US$ MN)

5.4.4.1 Japan HPC Market by Deployment, 2019 – 2026 (US$ Mn)

5.4.4.2 Japan HPC Market by Component, 2019 – 2026 (US$ Mn)

5.4.4.3 Japan HPC Market by Application, 2019 – 2026 (US$ Mn)

5.4.5 AUSTRALIA HPC MARKET SIZE & FORECASTS, 2019 – 2026 (US$ MN)

5.4.5.1 Australia HPC Market by Deployment, 2019 – 2026 (US$ Mn)

5.4.5.2 Australia HPC Market by Component, 2019 – 2026 (US$ Mn)

5.4.5.3 Australia HPC Market by Application, 2019 – 2026 (US$ Mn)

5.4.6 SINGAPORE HPC MARKET SIZE & FORECASTS, 2019 – 2026 (US$ MN)

5.4.6.1 Singapore HPC Market by Deployment, 2019 – 2026 (US$ Mn)

5.4.6.2 Singapore HPC Market by Component, 2019 – 2026 (US$ Mn)

5.4.6.3 Singapore HPC Market by Application, 2019 – 2026 (US$ Mn)

5.4.7 SOUTH KOREA HPC MARKET SIZE & FORECASTS, 2019 – 2026 (US$ MN)

5.4.7.1 South Korea HPC Market by Deployment, 2019 – 2026 (US$ Mn)

5.4.7.2 South Korea HPC Market by Component, 2019 – 2026 (US$ Mn)

5.4.7.3 South Korea HPC Market by Application, 2019 – 2026 (US$ Mn)

5.4.8 REST OF ASIA PACIFIC HPC MARKET SIZE & FORECASTS, 2019 – 2026 (US$ MN)

5.4.8.1 Rest of Asia Pacific HPC Market by Deployment, 2019 – 2026 (US$ Mn)

5.4.8.2 Rest of Asia Pacific HPC Market by Component, 2019 – 2026 (US$ Mn)

5.4.8.3 Rest of Asia Pacific HPC Market by Application, 2019 – 2026 (US$ Mn)

5.5 Central & South America HPC Market Snapshot, 2019 – 2026 (US$ Mn)

5.5.1 CENTRAL AND SOUTH AMERICA HPC MARKET SIZE & FORECASTS, 2019 – 2026 (US$ MN)

5.5.1.1 Central and South America HPC Market by Deployment, 2019 – 2026 (US$ Mn)

5.5.1.2 Central and South America HPC Market by Component, 2019 – 2026 (US$ Mn)

5.5.1.3 Central and South America HPC Market by Application, 2019 – 2026 (US$ Mn)

5.5.2 BRAZIL HPC MARKET SIZE & FORECASTS, 2019 – 2026 (US$ MN)

5.5.2.1 Brazil HPC Market by Deployment, 2019 – 2026 (US$ Mn)

5.5.2.2 Brazil HPC Market by Component, 2019 – 2026 (US$ Mn)

5.5.2.3 Brazil HPC Market by Application, 2019 – 2026 (US$ Mn)

5.5.3 MEXICO HPC MARKET SIZE & FORECASTS, 2019 – 2026 (US$ MN)

5.5.3.1 Mexico HPC Market by Deployment, 2019 – 2026 (US$ Mn)

5.5.3.2 Mexico HPC Market by Component, 2019 – 2026 (US$ Mn)

5.5.3.3 Mexico HPC Market by Application, 2019 – 2026 (US$ Mn)

5.5.4 REST OF CENTRAL AND SOUTH AMERICA HPC MARKET SIZE & FORECASTS, 2019 – 2026 (US$ MN)

5.5.4.1 Rest of Central and South America HPC Market by Deployment, 2019 – 2026 (US$ Mn)

5.5.4.2 Rest of Central and South America HPC Market by Component, 2019 – 2026 (US$ Mn)

5.5.4.3 Rest of Central and South America HPC Market by Application, 2019 – 2026 (US$ Mn)

5.6 Middle East & Africa HPC Market Snapshot, 2019 – 2026 (US$ Mn)

5.6.1 MIDDLE EAST AND AFRICA HPC MARKET SIZE & FORECASTS, 2019 – 2026 (US$ MN)

5.6.1.1 Middle East and Africa HPC Market by Deployment, 2019 – 2026 (US$ Mn)

5.6.1.2 Middle East and Africa HPC Market by Component, 2019 – 2026 (US$ Mn)

5.6.1.3 Middle East and Africa HPC Market by Application, 2019 – 2026 (US$ Mn)

5.6.2 UAE HPC MARKET SIZE & FORECASTS, 2019 – 2026 (US$ MN)

5.6.2.1 UAE HPC Market by Deployment, 2019 – 2026 (US$ Mn)

5.6.2.2 UAE HPC Market by Component, 2019 – 2026 (US$ Mn)

5.6.2.3 UAE HPC Market by Application, 2019 – 2026 (US$ Mn)

5.6.3 SAUDI ARABIA HPC MARKET SIZE & FORECASTS, 2019 – 2026 (US$ MN)

5.6.3.1 Saudi Arabia HPC Market by Deployment, 2019 – 2026 (US$ Mn)

5.6.3.2 Saudi Arabia HPC Market by Component, 2019 – 2026 (US$ Mn)

5.6.3.3 Saudi Arabia HPC Market by Application, 2019 – 2026 (US$ Mn)

5.6.4 SOUTH AFRICA HPC MARKET SIZE & FORECASTS, 2019 – 2026 (US$ MN)

5.6.4.1 South Africa HPC Market by Deployment, 2019 – 2026 (US$ Mn)

5.6.4.2 South Africa HPC Market by Component, 2019 – 2026 (US$ Mn)

5.6.4.3 South Africa HPC Market by Application, 2019 – 2026 (US$ Mn)

5.6.5 REST OF MIDDLE EAST AND AFRICA HPC MARKET SIZE & FORECASTS, 2019 – 2026 (US$ MN)

5.6.5.1 Rest of Middle East and Africa HPC Market by Deployment, 2019 – 2026 (US$ Mn)

5.6.5.2 Rest of Middle East and Africa HPC Market by Component, 2019 – 2026 (US$ Mn)

5.6.5.3 Rest of Middle East and Africa HPC Market by Application, 2019 – 2026 (US$ Mn)

CHAPTER 06 Global HPC Competitive Landscape

6.1 HPC Competitive Index

6.2 HPC Vendor Company Profiles

6.2.1 HEWLETT PACKARD ENTERPRISE CO

6.2.1.1 Overview and Financial Performance

6.2.1.2 Recent Developments and Innovations

6.2.2 LENOVO GROUP LTD

6.2.2.1 Overview and Financial Performance

6.2.2.2 Recent Developments and Innovations

6.2.3 INTERNATIONAL BUSINESS MACHINES CORP

6.2.3.1 Overview and Financial Performance

6.2.3.2 Recent Developments and Innovations

6.2.4 DELL TECHNOLOGIES INC

6.2.4.1 Overview and Financial Performance

6.2.4.2 Recent Developments and Innovations

6.2.5 HUAWEI INVESTMENT & HOLDING CO LTD

6.2.5.1 Overview and Financial Performance

6.2.5.2 Recent Developments and Innovations

6.2.6 FUJITSU LTD

6.2.6.1 Overview and Financial Performance

6.2.6.2 Recent Developments and Innovations

6.2.7 INTEL CORP

6.2.7.1 Overview and Financial Performance

6.2.7.2 Recent Developments and Innovations

6.2.8 ADVANCED MICRO DEVICES INC

6.2.8.1 Overview and Financial Performance

6.2.8.2 Recent Developments and Innovations

6.2.9 NVIDIA CORP

6.2.9.1 Overview and Financial Performance

6.2.9.2 Recent Developments and Innovations

6.2.10 STMICROELECTRONICS NV

6.2.10.1 Overview and Financial Performance

6.2.10.2 Recent Developments and Innovations

6.3 Other HPC Market Participants:

6.3.1 INSPUR SOFTWARE CO LTD

6.3.2 ATOS SE

6.3.3 NEC CORP

6.3.4 DATADIRECT NETWORKS INC

6.3.5 SEAGATE TECHNOLOGY HOLDINGS PLC

6.3.6 NETAPP INC

6.3.7 GOOGLE LLC

6.3.8 HUAWEI INVESTMENT & HOLDING CO LTD

6.3.9 AMAZON WEB SERVICES INC

6.3.10 CISCO SYSTEMS INC

6.3.11 ORACLE CORP

6.3.12 VMWARE INC

6.3.13 JUNIPER NETWORKS INC

CHAPTER 07 Methodology and Scope

7.1 Information Procurement

7.2 HPC Analysis

7.3 Market Opportunity Forecast – Research Methodology & Formulation

7.4 Competitive Index – Research Methodology & Formulation

Contact Us

Table

Table 1 Key Trends Overview

Table 2 Top 5 Venture Financing Deals by Value

Table 3 Technology Trends

Table 4 Macroeconomics Trends

Table 5 Global HPC Market by Deployment, 2019 – 2026 (US$ Mn)

Table 6 Global HPC Market by Component, 2019 – 2026 (US$ Mn)

Table 7 Global HPC Market by Application, 2019 – 2026 (US$ Mn)

Table 8 North America HPC Market by Deployment, 2019 – 2026 (US$ Mn)

Table 9 North America HPC Market by Component, 2019 – 2026 (US$ Mn)

Table 10 North America HPC Market by Application, 2019 – 2026 (US$ Mn)

Table 11 US HPC Market by Deployment, 2019 – 2026 (US$ Mn)

Table 12 US HPC Market by Component, 2019 – 2026 (US$ Mn)

Table 13 US HPC Market by Application, 2019 – 2026 (US$ Mn)

Table 14 Canada HPC Market by Deployment, 2019 – 2026 (US$ Mn)

Table 15 Canada HPC Market by Component, 2019 – 2026 (US$ Mn)

Table 16 Canada HPC Market by Application, 2019 – 2026 (US$ Mn)

Table 17 Europe HPC Market by Deployment, 2019 – 2026 (US$ Mn)

Table 18 Europe HPC Market by Component, 2019 – 2026 (US$ Mn)

Table 19 Europe HPC Market by Application, 2019 – 2026 (US$ Mn)

Table 20 UK HPC Market by Deployment, 2019 – 2026 (US$ Mn)

Table 21 UK HPC Market by Component, 2019 – 2026 (US$ Mn)

Table 22 UK HPC Market by Application, 2019 – 2026 (US$ Mn)

Table 23 Germany HPC Market by Deployment, 2019 – 2026 (US$ Mn)

Table 24 Germany HPC Market by Component, 2019 – 2026 (US$ Mn)

Table 25 Germany HPC Market by Application, 2019 – 2026 (US$ Mn)

Table 26 France HPC Market by Deployment, 2019 – 2026 (US$ Mn)

Table 27 France HPC Market by Component, 2019 – 2026 (US$ Mn)

Table 28 France HPC Market by Application, 2019 – 2026 (US$ Mn)

Table 29 Italy HPC Market by Deployment, 2019 – 2026 (US$ Mn)

Table 30 Italy HPC Market by Component, 2019 – 2026 (US$ Mn)

Table 31 Italy HPC Market by Application, 2019 – 2026 (US$ Mn)

Table 32 Netherlands HPC Market by Deployment, 2019 – 2026 (US$ Mn)

Table 33 Netherlands HPC Market by Component, 2019 – 2026 (US$ Mn)

Table 34 Netherlands HPC Market by Application, 2019 – 2026 (US$ Mn)

Table 35 Russia HPC Market by Deployment, 2019 – 2026 (US$ Mn)

Table 36 Russia HPC Market by Component, 2019 – 2026 (US$ Mn)

Table 37 Russia HPC Market by Application, 2019 – 2026 (US$ Mn)

Table 38 Spain HPC Market by Deployment, 2019 – 2026 (US$ Mn)

Table 39 Spain HPC Market by Component, 2019 – 2026 (US$ Mn)

Table 40 Spain HPC Market by Application, 2019 – 2026 (US$ Mn)

Table 41 Switzerland HPC Market by Deployment, 2019 – 2026 (US$ Mn)

Table 42 Switzerland HPC Market by Component, 2019 – 2026 (US$ Mn)

Table 43 Switzerland HPC Market by Application, 2019 – 2026 (US$ Mn)

Table 44 Rest of Europe HPC Market by Deployment, 2019 – 2026 (US$ Mn)

Table 45 Rest of Europe HPC Market by Component, 2019 – 2026 (US$ Mn)

Table 46 Rest of Europe HPC Market by Application, 2019 – 2026 (US$ Mn)

Table 47 Asia Pacific HPC Market by Deployment, 2019 – 2026 (US$ Mn)

Table 48 Asia Pacific HPC Market by Component, 2019 – 2026 (US$ Mn)

Table 49 Asia Pacific HPC Market by Application, 2019 – 2026 (US$ Mn)

Table 50 China HPC Market by Deployment, 2019 – 2026 (US$ Mn)

Table 51 China HPC Market by Component, 2019 – 2026 (US$ Mn)

Table 52 China HPC Market by Application, 2019 – 2026 (US$ Mn)

Table 53 India HPC Market by Deployment, 2019 – 2026 (US$ Mn)

Table 54 India HPC Market by Component, 2019 – 2026 (US$ Mn)

Table 55 India HPC Market by Application, 2019 – 2026 (US$ Mn)

Table 56 Japan HPC Market by Deployment, 2019 – 2026 (US$ Mn)

Table 57 Japan HPC Market by Component, 2019 – 2026 (US$ Mn)

Table 58 Japan HPC Market by Application, 2019 – 2026 (US$ Mn)

Table 59 Australia HPC Market by Deployment, 2019 – 2026 (US$ Mn)

Table 60 Australia HPC Market by Component, 2019 – 2026 (US$ Mn)

Table 61 Australia HPC Market by Application, 2019 – 2026 (US$ Mn)

Table 62 Singapore HPC Market by Deployment, 2019 – 2026 (US$ Mn)

Table 63 Singapore HPC Market by Component, 2019 – 2026 (US$ Mn)

Table 64 Singapore HPC Market by Application, 2019 – 2026 (US$ Mn)

Table 65 South Korea HPC Market by Deployment, 2019 – 2026 (US$ Mn)

Table 66 South Korea HPC Market by Component, 2019 – 2026 (US$ Mn)

Table 67 South Korea HPC Market by Application, 2019 – 2026 (US$ Mn)

Table 68 Rest of Asia Pacific HPC Market by Deployment, 2019 – 2026 (US$ Mn)

Table 69 Rest of Asia Pacific HPC Market by Component, 2019 – 2026 (US$ Mn)

Table 70 Rest of Asia Pacific HPC Market by Application, 2019 – 2026 (US$ Mn)

Table 71 Central and South America HPC Market by Deployment, 2019 – 2026 (US$ Mn)

Table 72 Central and South America HPC Market by Component, 2019 – 2026 (US$ Mn)

Table 73 Central and South America HPC Market by Application, 2019 – 2026 (US$ Mn)

Table 74 Brazil HPC Market by Deployment, 2019 – 2026 (US$ Mn)

Table 75 Brazil HPC Market by Component, 2019 – 2026 (US$ Mn)

Table 76 Brazil HPC Market by Application, 2019 – 2026 (US$ Mn)

Table 77 Mexico HPC Market by Deployment, 2019 – 2026 (US$ Mn)

Table 78 Mexico HPC Market by Component, 2019 – 2026 (US$ Mn)

Table 79 Mexico HPC Market by Application, 2019 – 2026 (US$ Mn)

Table 80 Rest of Central and South America HPC Market by Deployment, 2019 – 2026 (US$ Mn)

Table 81 Rest of Central and South America HPC Market by Component, 2019 – 2026 (US$ Mn)

Table 82 Rest of Central and South America HPC Market by Application, 2019 – 2026 (US$ Mn)

Table 83 Middle East and Africa HPC Market by Deployment, 2019 – 2026 (US$ Mn)

Table 84 Middle East and Africa HPC Market by Component, 2019 – 2026 (US$ Mn)

Table 85 Middle East and Africa HPC Market by Application, 2019 – 2026 (US$ Mn)

Table 86 UAE HPC Market by Deployment, 2019 – 2026 (US$ Mn)

Table 87 UAE HPC Market by Component, 2019 – 2026 (US$ Mn)

Table 88 UAE HPC Market by Application, 2019 – 2026 (US$ Mn)

Table 89 Saudi Arabia HPC Market by Deployment, 2019 – 2026 (US$ Mn)

Table 90 Saudi Arabia HPC Market by Component, 2019 – 2026 (US$ Mn)

Table 91 Saudi Arabia HPC Market by Application, 2019 – 2026 (US$ Mn)

Table 92 South Africa HPC Market by Deployment, 2019 – 2026 (US$ Mn)

Table 93 South Africa HPC Market by Component, 2019 – 2026 (US$ Mn)

Table 94 South Africa HPC Market by Application, 2019 – 2026 (US$ Mn)

Table 95 Rest of Middle East and Africa HPC Market by Deployment, 2019 – 2026 (US$ Mn)

Table 96 Rest of Middle East and Africa HPC Market by Component, 2019 – 2026 (US$ Mn)

Table 97 Rest of Middle East and Africa HPC Market by Application, 2019 – 2026 (US$ Mn)

Figures

Fig.1 Market Snapshot, 2021 & 2026

Fig.2 High Performance Computing (HPC) Market Segmentation

Fig.3 High Performance Computing (HPC) – Industry Value Chain Analysis

Fig.4 HPC Value Chain Analysis – Component Leaders & Challengers

Fig.5 HPC Value Chain Analysis – Servers Leaders & Challengers

Fig.6 HPC Value Chain Analysis – Storage Leaders & Challengers

Fig.7 HPC Value Chain Analysis – Networking Equipment Leaders & Challengers

Fig.8 HPC Value Chain Analysis – Data Center Solutions Leaders & Challengers

Fig.9 HPC Value Chain Analysis – Prominent End Users

Fig.10 High Performance Computing (HPC) Market – Key Drivers Impact Analysis

Fig.11 High Performance Computing (HPC) Market – Key Restraints/Challenges Impact Analysis

Fig.12 Global High Performance Computing (HPC) Market – PORTER’s Five Force Analysis

Fig.13 Global High Performance Computing (HPC) Market – PEST Analysis

Fig.14 Big Data – M&A Activity Dashboard

Fig.15 Big Data – Patent Activity Dashboard

Fig.16 Big Data – Job Analytics Dashboard

Fig.17 Big Data – Venture Financing Dashboard

Fig.18 Big Data – Social Media Dashboard

Fig.19 Global HPC Market – Revenue Opportunity Forecast, 2019-2026 (US$ Million)

Fig.20 Global HPC Market by Deployment, 2019 – 2026 (US$ Mn)

Fig.21 Global HPC Market by Component, 2019 – 2026 (US$ Mn)

Fig.22 Global HPC Market by Application, 2019 – 2026 (US$ Mn)

Fig.23 HPC – Market Overview

Fig.24 North America HPC Market Snapshot, 2019 – 2026 (US$ Mn)

Fig.25 North America HPC Market By Deployment Share – 2021 & 2026 ($Mn)

Fig.26 North America HPC By Component Share – 2021 & 2026 ($Mn)

Fig.27 North America HPC By Application Share – 2021 & 2026 ($Mn)

Fig.28 US HPC By Deployment Share – 2021 & 2026 ($Mn)

Fig.29 US HPC By Component Share – 2021 & 2026 ($Mn)

Fig.30 US HPC By Component Share – 2021 & 2026 ($Mn)

Fig.31 Canada HPC By Deployment Share – 2021 & 2026 ($Mn)

Fig.32 Canada HPC By Component Share – 2021 & 2026 ($Mn)

Fig.33 Canada HPC By Component Share – 2021 & 2026 ($Mn)

Fig.34 Europe HPC Market Snapshot, 2019 – 2026 (US$ Mn)

Fig.35 Europe HPC By Deployment Share – 2021 & 2026 ($Mn)

Fig.36 Europe HPC By Component Share – 2021 & 2026 ($Mn)

Fig.37 Europe HPC By Application Share – 2021 & 2026 ($Mn)

Fig.38 UK HPC By Deployment Share – 2021 & 2026 ($Mn)

Fig.39 UK HPC By Component Share – 2021 & 2026 ($Mn)

Fig.40 UK HPC By Application Share – 2021 & 2026 ($Mn)

Fig.41 Germany HPC By Deployment Share – 2021 & 2026 ($Mn)

Fig.42 Germany HPC By Component Share – 2021 & 2026 ($Mn)

Fig.43 Germany HPC By Application Share – 2021 & 2026 ($Mn)

Fig.44 France HPC By Deployment Share – 2021 & 2026 ($Mn)

Fig.45 France HPC By Component Share – 2021 & 2026 ($Mn)

Fig.46 France HPC By Application Share – 2021 & 2026 ($Mn)

Fig.47 Italy HPC By Deployment Share – 2021 & 2026 ($Mn)

Fig.48 Italy HPC By Component Share – 2021 & 2026 ($Mn)

Fig.49 Italy HPC By Application Share – 2021 & 2026 ($Mn)

Fig.50 Netherlands HPC By Deployment Share – 2021 & 2026 ($Mn)

Fig.51 Netherlands HPC By Component Share – 2021 & 2026 ($Mn)

Fig.52 Netherlands HPC By Application Share – 2021 & 2026 ($Mn)

Fig.53 Russia HPC By Deployment Share – 2021 & 2026 ($Mn)

Fig.54 Russia HPC By Component Share – 2021 & 2026 ($Mn)

Fig.55 Russia HPC By Application Share – 2021 & 2026 ($Mn)

Fig.56 Spain HPC By Deployment Share – 2021 & 2026 ($Mn)

Fig.57 Spain HPC By Component Share – 2021 & 2026 ($Mn)

Fig.58 Spain HPC By Application Share – 2021 & 2026 ($Mn)

Fig.59 Switzerland HPC By Deployment Share – 2021 & 2026 ($Mn)

Fig.60 Switzerland HPC By Component Share – 2021 & 2026 ($Mn)

Fig.61 Switzerland HPC By Component Share – 2021 & 2026 ($Mn)

Fig.62 Rest of Europe HPC By Component Share – 2021 & 2026 ($Mn)

Fig.63 Rest of Europe HPC By Component Share – 2021 & 2026 ($Mn)

Fig.64 Rest of Europe HPC By Application Share – 2021 & 2026 ($Mn)

Fig.65 Asia Pacific HPC Market Snapshot, 2019 – 2026 (US$ Mn)

Fig.66 Asia Pacific HPC By Deployment Share – 2021 & 2026 ($Mn)

Fig.67 Asia Pacific HPC By Component Share – 2021 & 2026 ($Mn)

Fig.68 Asia Pacific HPC By Application Share – 2021 & 2026 ($Mn)

Fig.69 China HPC By Deployment Share – 2021 & 2026 ($Mn)

Fig.70 China HPC By Component Share – 2021 & 2026 ($Mn)

Fig.71 China HPC By Application Share – 2021 & 2026 ($Mn)

Fig.72 India HPC By Deployment Share – 2021 & 2026 ($Mn)

Fig.73 India HPC By Component Share – 2021 & 2026 ($Mn)

Fig.74 India HPC By Application Share – 2021 & 2026 ($Mn)

Fig.75 Japan HPC By Deployment Share – 2021 & 2026 ($Mn)

Fig.76 Japan HPC By Component Share – 2021 & 2026 ($Mn)

Fig.77 Japan HPC By Application Share – 2021 & 2026 ($Mn)

Fig.78 Australia HPC By Deployment Share – 2021 & 2026 ($Mn)

Fig.79 Australia HPC By Component Share – 2021 & 2026 ($Mn)

Fig.80 Australia HPC By Application Share – 2021 & 2026 ($Mn)

Fig.81 Singapore HPC By Deployment Share – 2021 & 2026 ($Mn)

Fig.82 Singapore HPC By Component Share – 2021 & 2026 ($Mn)

Fig.83 Singapore HPC By Application Share – 2021 & 2026 ($Mn)

Fig.84 South Korea HPC By Deployment Share – 2021 & 2026 ($Mn)

Fig.85 South Korea HPC By Component Share – 2021 & 2026 ($Mn)

Fig.86 South Korea HPC By Application Share – 2021 & 2026 ($Mn)

Fig.87 Rest of Asia Pacific HPC By Deployment Share – 2021 & 2026 ($Mn)

Fig.88 Rest of Asia Pacific HPC By Component Share – 2021 & 2026 ($Mn)

Fig.89 Rest of Asia Pacific HPC By Application Share – 2021 & 2026 ($Mn)

Fig.90 South & Central America HPC Market Snapshot, 2019 – 2026 (US$ Mn)

Fig.91 Central and South America HPC By Deployment Share – 2021 & 2026 ($Mn)

Fig.92 Central and South America HPC By Component Share – 2021 & 2026 ($Mn)

Fig.93 Central and South America HPC By Application Share – 2021 & 2026 ($Mn)

Fig.94 Brazil HPC By Deployment Share – 2021 & 2026 ($Mn)

Fig.95 Brazil HPC By Component Share – 2021 & 2026 ($Mn)

Fig.96 Brazil HPC By Application Share – 2021 & 2026 ($Mn)

Fig.97 Mexico HPC By Deployment Share – 2021 & 2026 ($Mn)

Fig.98 Mexico HPC By Component Share – 2021 & 2026 ($Mn)

Fig.99 Mexico HPC By Application Share – 2021 & 2026 ($Mn)

Fig.100 Rest of Central and South America HPC By Deployment Share – 2021 & 2026 ($Mn)

Fig.101 Rest of Central and South America HPC By Component Share – 2021 & 2026 ($Mn)

Fig.102 Rest of Central and South America HPC By Application Share – 2021 & 2026 ($Mn)

Fig.103 Middle East & Africa HPC Market Snapshot, 2019 – 2026 (US$ Mn)

Fig.104 Middle East and Africa HPC By Deployment Share – 2021 & 2026 ($Mn)

Fig.105 Middle East and Africa HPC By Component Share – 2021 & 2026 ($Mn)

Fig.106 Middle East and Africa HPC By Application Share – 2021 & 2026 ($Mn)

Fig.107 UAE HPC By Deployment Share – 2021 & 2026 ($Mn)

Fig.108 UAE HPC By Component Share – 2021 & 2026 ($Mn)

Fig.109 UAE HPC By Application Share – 2021 & 2026 ($Mn)

Fig.110 Saudi Arabia HPC By Deployment Share – 2021 & 2026 ($Mn)

Fig.111 Saudi Arabia HPC By Component Share – 2021 & 2026 ($Mn)

Fig.112 Saudi Arabia HPC By Application Share – 2021 & 2026 ($Mn)

Fig.113 South Africa HPC By Deployment Share – 2021 & 2026 ($Mn)

Fig.114 South Africa HPC By Component Share – 2021 & 2026 ($Mn)

Fig.115 South Africa HPC By Application Share – 2021 & 2026 ($Mn)

Fig.116 Rest of Middle East and Africa HPC By Deployment Share – 2021 & 2026 ($Mn)

Fig.117 Rest of Middle East and Africa HPC By Component Share – 2021 & 2026 ($Mn)

Fig.118 Rest of Middle East and Africa HPC By Application Share – 2021 & 2026 ($Mn)

Fig.119 HPC – Growth-Innovation Matrix

Fig.120 Data Analysis Model

Fig.121 HPC Forecast Analysis

Frequently asked questions

  • What will be the high performance computing market size in 2023?

    The high performance computing market size was valued at $43.6 billion in 2023.

  • What is the high performance computing market growth rate?

    The HPC market is expected to grow at a CAGR of 7.5% during the forecast period (2022-2026).

  • What are the key high performance computing market drivers?

    Increasing adoption of AI, IoT, and Machine Learning (ML) resulting in the need for computing large volume of data is expected to drive the HPC systems’ demand to compute.

  • What are the key high performance computing market segments?

    Component Segments: Server, Storage, Network, Software, Services, and Cloud

    Deployment Segments: On-Premise and Cloud

    Application Segments: Academic, Government, Manufacturing, Bio-Sciences, Financial Services, and Others

  • Which are the leading high performance computing companies globally?

    Some of the leading HPC companies are Hewlett Packard Enterprise Co, Lenovo Group Ltd, International Business Machines Corp, Dell Technologies Inc, Huawei Investment & Holding Co Ltd, Fujitsu Ltd, Intel Corp, Advanced Micro Devices Inc, NVIDIA Corp, and STMicroelectronics NV, among others.

  • Is there a third level of segmentation in the report?

    GlobalData’s focus is on providing reliable and accurate data that is supported by robust research methodology. Our reports undergo rigorous quality checks and are based on primary and secondary research sources, ensuring that the numbers and insights provided are trustworthy.  However, despite the best efforts to gather comprehensive data, there could be instances where the available data is limited, making it challenging to provide third level segmentation. In such cases, GlobalData may choose to provide high-level insights and general trends rather than forcing segmentation that may not be backed by sufficient data. This approach ensures that the report’s overall quality and credibility are maintained.

Currency USD
$3,950

Can be used by individual purchaser only

$7,950

Can be shared globally by unlimited users within the purchasing corporation e.g. all employees of a single company


Undecided about purchasing this report?

Enquire Before Buying Request a Free Sample

Get in touch to find out about multi-purchase discounts

reportstore@globaldata.com
Tel +44 20 7947 2745

Every customer’s requirement is unique. With over 220,000 construction projects tracked, we can create a tailored dataset for you based on the types of projects you are looking for. Please get in touch with your specific requirements and we can send you a quote.

Sample Report

We are confident about High Performance Computing Market Trends and Analysis by Region, Component, Deployment, Application and Segment Forecast to 2026 report's unique quality. However, we want you to make the most beneficial decision for your business, so we offer free sample pages to help you:

  • Assess the relevance of the report
  • Evaluate the quality of the report
  • Justify the cost

Download your copy of the sample report and make an informed decision about whether the full report will provide you with the insights and information you need.

Below is a sample report to understand what you are buying

See what our customers are saying

“The GlobalData platform is our go-to tool for intelligence services. GlobalData provides an easy way to access comprehensive intelligence data around multiple sectors, which essentially makes it a one-for-all intelligence platform, for tendering and approaching customers.

GlobalData is very customer orientated, with a high degree of personalised services, which benefits everyday use. The highly detailed project intelligence and forecast reports can be utilised across multiple departments and workflow scopes, from operational to strategic level, and often support strategic decisions. GlobalData Analytics and visualisation solutions has contributed positively when preparing management presentations and strategic papers.”

Business Intelligence & Marketing Manager, SAL Heavy Lift

“COVID-19 has caused significant interference to our business and the COVID-19 intelligence from GlobalData has helped us reach better decisions around strategy. These two highlights have helped enormously to understand the projections into the future concerning our business units, we also utilise the project database to source new projects for Liebherr-Werk to use as an additional source to pitch for new business.”

Market Analyst & Management, Liebherr-Werk

Your daily news has saved me a lot of time and keeps me up-to-date with what is happening in the market, I like that you almost always have a link to the source origin. We also use your market data in our Strategic Business Process to support our business decisions. By having everything in one place on the Intelligence Center it has saved me a lot of time versus looking on different sources, the alert function also helps with this.

Head of Key Accounts, Saab AB

Having used several other market research companies, I find that GlobalData manages to provide that ‘difficult-to-get’ market data that others can’t, as well as very diverse and complete consumer surveys.

Marketing Intelligence Manager, Portugal Foods

Our experience with GlobalData has been very good, from the platform itself to the people. I find that the analysts and the account team have a high level of customer focus and responsiveness and therefore I can always rely on. The platform is more holistic than other providers. It is convenient and almost like a one stop shop. The pricing suite is highly competitive and value for our organisation.

I like reports that inform new segments such as the analysis on generation Z, millennials, the impact of COVID 19 to our banking customers and their new channel habits. Secondly the specialist insight on affluent sector significantly increases our understanding about this group of customers. The combination of those give us depth and breadth of the evolving market.

I’m in the business of answering and helping people make decisions so with the intelligence center I can do that, effectively and efficiently. I can share quickly key insights that answer and satisfy our country stakeholders by giving them many quality studies and primary research about competitive landscape beyond the outlook of our bank. It helps me be seen as an advisory partner and that makes a big difference. A big benefit of our subscription is that no one holds the whole data and because it allows so many people, so many different parts of our organisation have access, it enables all teams to have the same level of knowledge and decision support.

Head of Customer Insight and Research, Standard Chartered

“I know that I can always rely on Globaldata’s work when I’m searching for the right consumer and market insights. I use Globaldata insights to understand the changing market & consumer landscape and help create better taste & wellbeing solutions for our customers in food, beverage and healthcare industries.

Globaldata has the right data and the reports are of very high quality compared to your competitors. Globaldata not only has overall market sizes & consumer insights on food & beverages but also provides insights at the ingredient & flavour level. That is key for B2B companies like Givaudan. This way we understand our customers’ business and also gain insight to our unique industry”

Head of Consumer Sensory Insights, Givaudan

GlobalData provides a great range of information and reports on various sectors that is highly relevant, timely, easy to access and utilise.  The reports and data dashboards help engagement with clients; they provide valuable industry and market insights that can enrich client conversations and can help in the shaping of value propositions. Moreover, using GlobalData products has helped increase my knowledge of the finance sector, the players within it, and the general threats and opportunities.

I find the consumer surveys that are carried out to be extremely beneficial and not something I have seen anywhere else. They provided an insightful view of why and which consumers take (or don’t) particular financial products. This can help shape conversations with clients to ensure they make the right strategic decisions for their business.

One of the challenges I have found is that data in the payments space is often piecemeal. With GD all of the data I need is in one place, but it also comes with additional market reports that provide useful extra context and information. Having the ability to set-up alerts on relevant movements in the industry, be it competitors or customers, and have them emailed directly to me, ensures I get early sight of industry activity and don’t have to search for news.

Senior Account Manager, TSYS
Go even deeper with GlobalData Intelligence Center

Every Company Report we produce is powered by the GlobalData Intelligence Center.

Subscribing to our intelligence platform means you can monitor developments at High Performance Computing Market Trends and Analysis by Region, Component, Deployment, Application and Segment Forecast to 2026 in real time.

  • Access a live High Performance Computing Market Trends and Analysis by Region, Component, Deployment, Application and Segment Forecast to 2026 dashboard for 12 months, with up-to-the-minute insights.
  • Fuel your decision making with real-time deal coverage and media activity.
  • Turn insights on financials, deals, products and pipelines into powerful agents of commercial advantage.