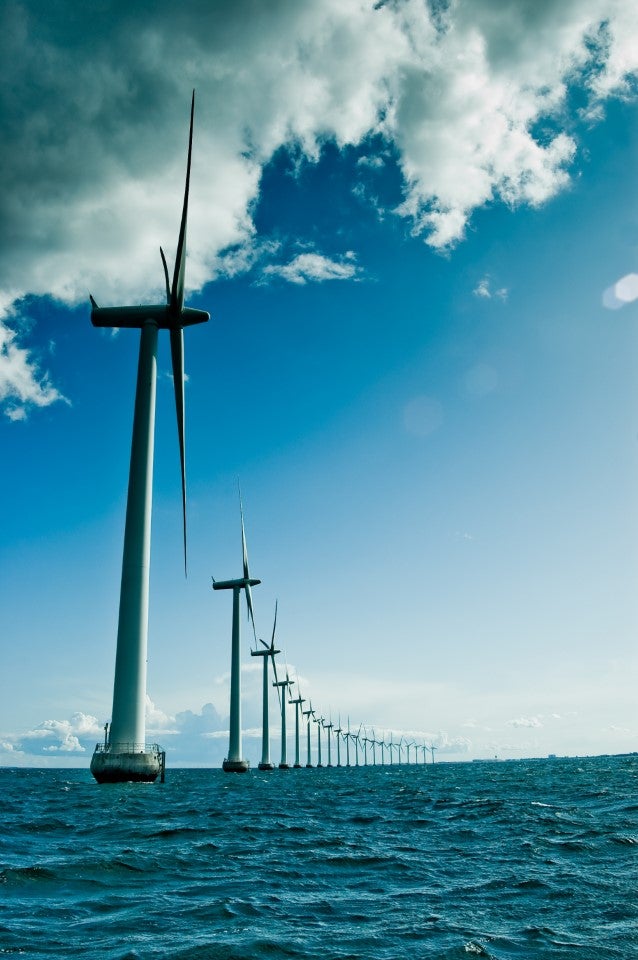
Hydropower Market (Large Hydro, Small Hydro, and Pumped Storage), Update 2020 – Global Market Size, Segmentation, Investment Trends, and Key Country Analysis to 2030
Powered by ![]()
All the vital news, analysis, and commentary curated by our industry experts.

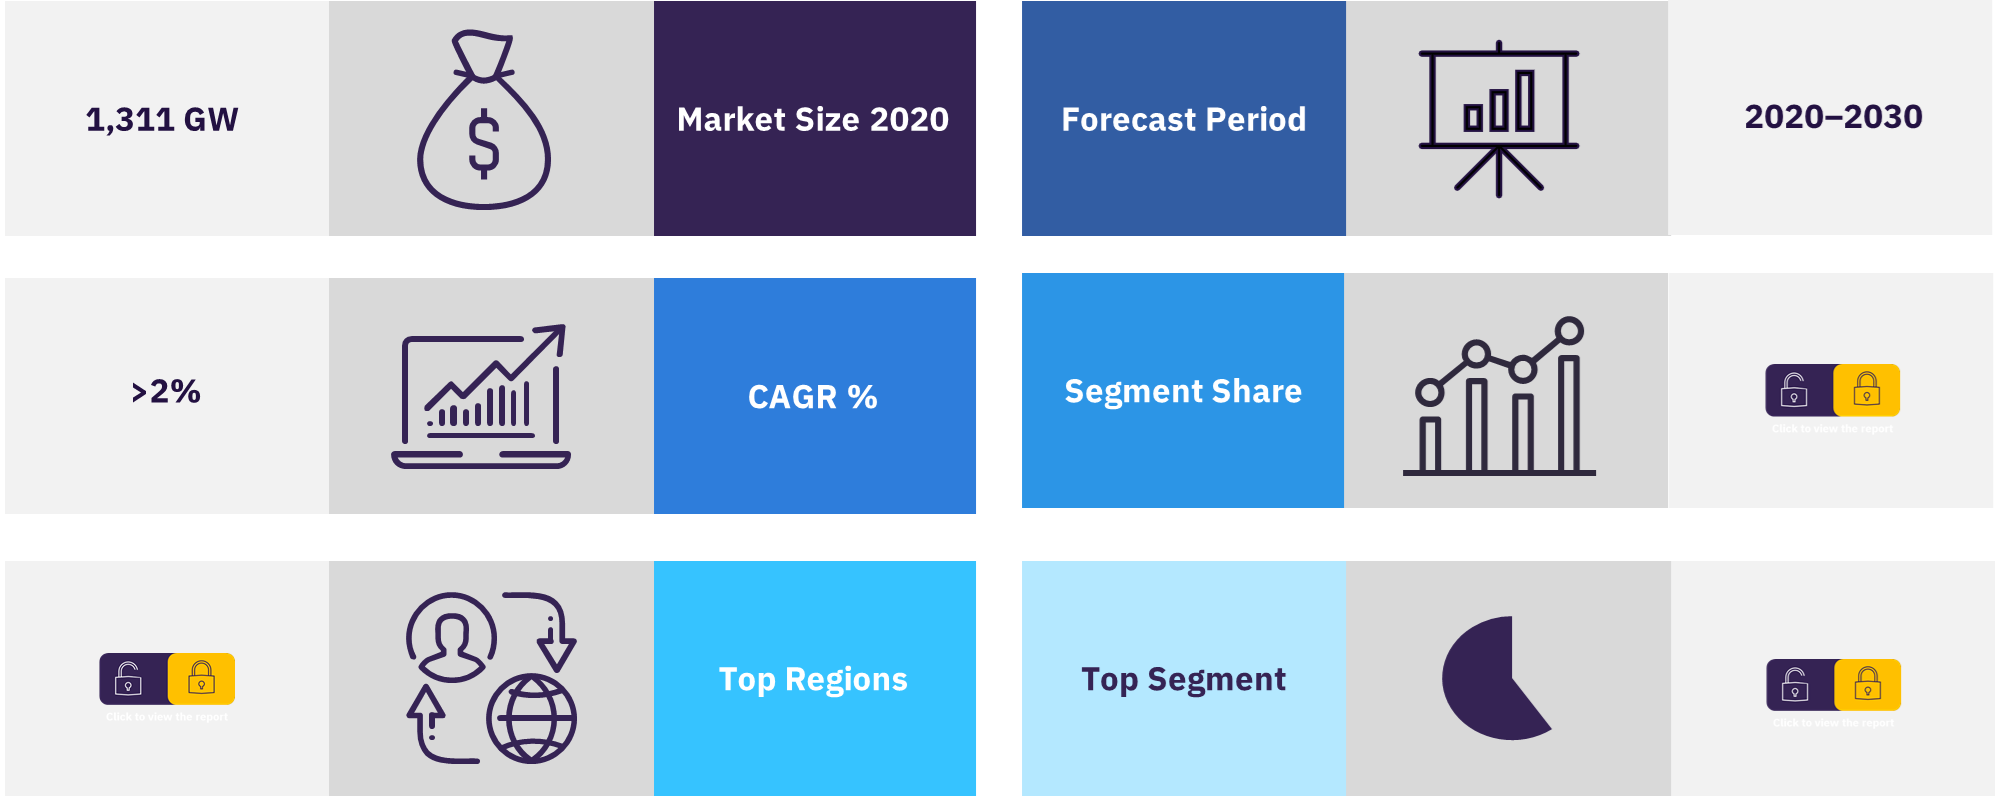
Global hydropower market was valued at 1,311 GW in 2020. The market is expected to grow at a CAGR of more than 2% during the forecast period.
The global hydropower market report provides a clear overview of and detailed insight into the global hydropower market. It also provides data and analysis on the historic and forecast hydropower capacity and generation; the impact of COVID-19 pandemic, major plants, and market size for ten key hydropower countries – The US, Canada, Brazil, Argentina, China, India, Pakistan, Philippines, Russian Federation, and Turkey.
Hydropower market overview
For more insights on this report, download a free sample
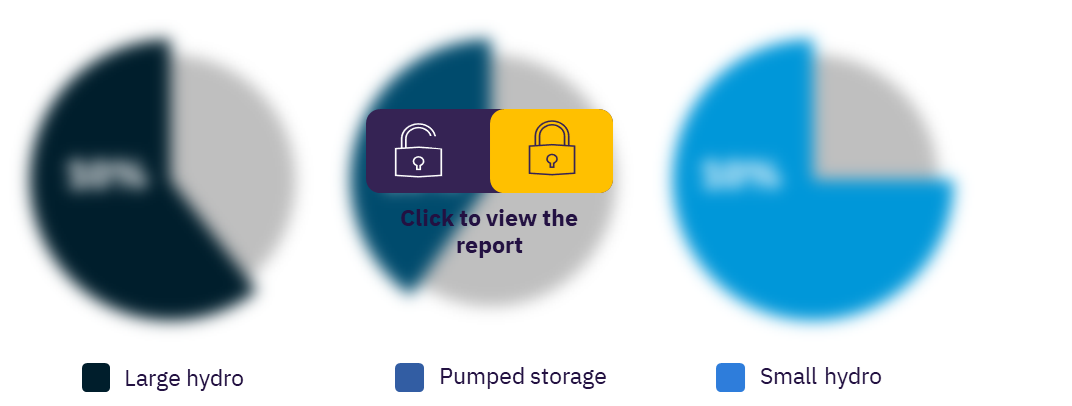
Which are the key segments in the global hydropower market?
The key segments in the global hydropower market are large hydro, pumped storage, and small hydro. Among them large hydro had the highest share.
Hydropower market, by segments
For more segment insights, download a free sample
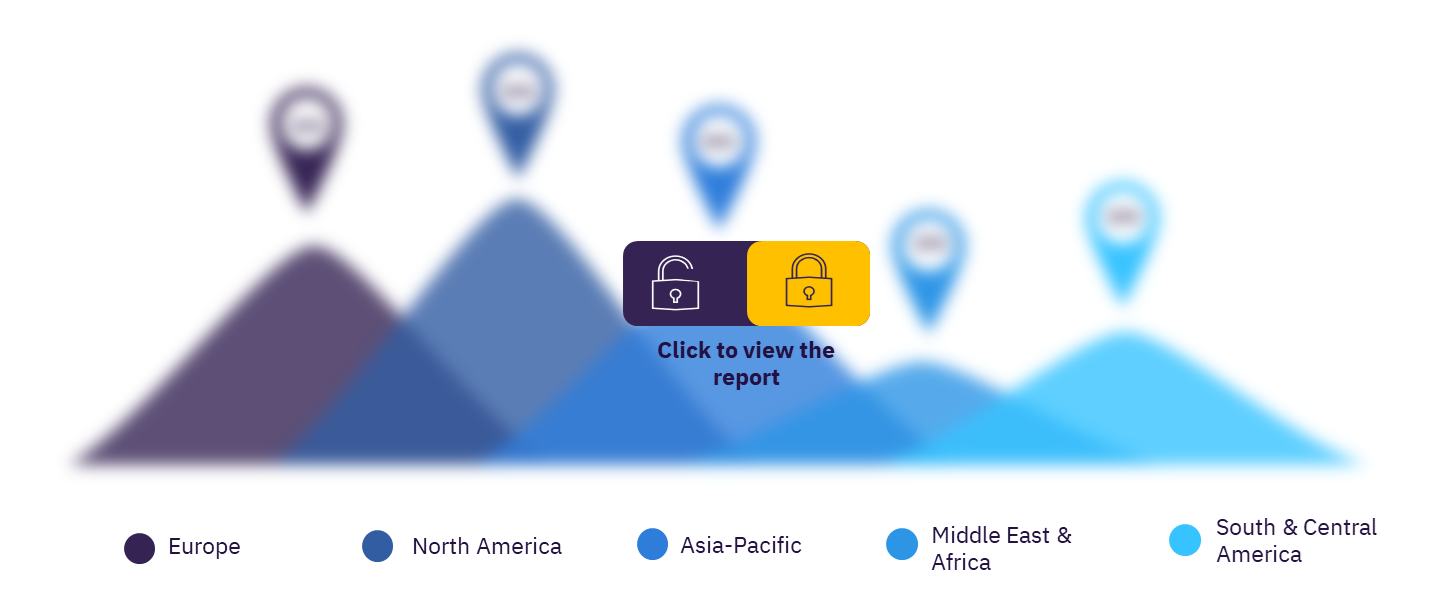
Which are the key regions in the global hydropower market?
The key regions in the global hydropower market are Asia-Pacific, Europe, North America, South and Central America, and Middle East & Africa. Asia-Pacific region has the largest installed hydropower capacity and most of this is from China alone.
Hydropower market, by key regions
For more regional insights, download a free sample
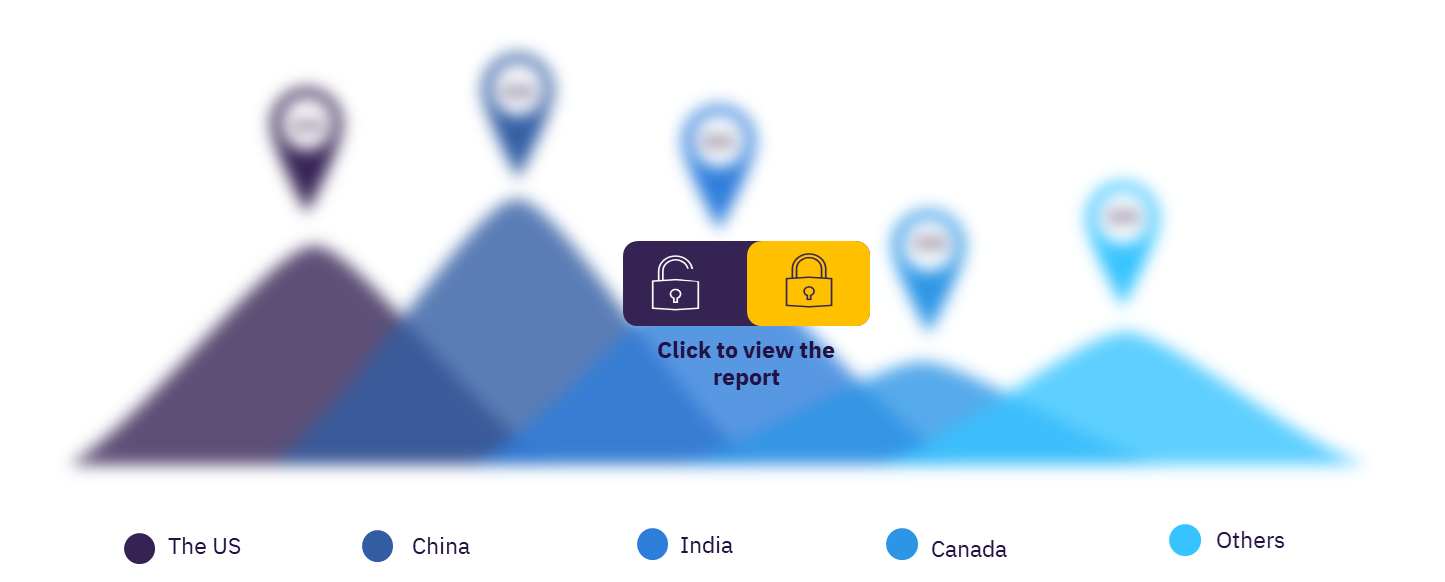
Which are the key countries in the global hydropower market?
The key countries in the global hydropower market are the US, Canada, Brazil, Argentina, China, India, Pakistan, Philippines, Russian Federation, and Turkey. China has the largest installed hydropower capacity.
The US
In the US, large hydropower is a mature technology, and there is a very limited scope for the construction of additional hydropower plants. The major hydroelectric dams are in the northwest, the Tennessee Valley and on the Colorado River. The majority of waterways in these regions have already been developed, and hydropower capacity is expected to grow through small hydropower plants.
Canada
Canada has a large hydropower potential due to the large network of rivers in the country. These rivers are not concentrated in one part of the country making hydropower a viable technology in any province. While the potential is available in all provinces, most of the built hydropower capacity is in Quebec. Quebec is also home to some of the largest hydropower plants in the country. Hydro Quebec, Quebec’s state-run generating company owns most of the hydropower capacity in the state and is the leading hydropower generating company in the country.
Brazil
Hydro power segment in energy sector of Brazil is significantly impacted by the spread of COVID-19 pandemic. Government had to announce country wide lockdown to spread the COVID-19 pandemic. The shutdown of non-essential services led to a decline in power consumption demand which has significantly impacted the hydro power segment. Both the capacity and generation are expected to get hit because of the pandemic.
Argentina
Hydropower is the second largest power source in Argentina in terms of capacity and generation after thermal power. These are the two major sources of electricity while all other technologies together contribute to a very small share.
China
China has made significant strides in the development of hydropower, but there have been controversies surrounding its large-scale projects, such as the Three Gorges dam project and the Jinsha River project. In all cases, the protests are related to the environmental degradation caused by reservoir development. The government is currently pushing ahead with the announced projects, but a significant lobby continues to oppose them.
India
Indian hydro power market is one the fastest growing renewable energy segment in the country and in 2020 it overtook Japan in term of power generation. However, in March 2020, India implemented country wide lockdown in an attempt to slowdown the spread of COVID-19 pandemic. The operations of all non-essential services were stopped while essential services were operating at a reduced workforce.
Pakistan
Pakistan relies heavily on its hydropower capacity for electricity generation and derives over a fourth of its electricity from hydropower plants. However, due to frequent droughts, the flow of water is inconsistent rendering hydropower less reliable than desired. In this backdrop, the government has been developing thermal power capacity to counter the uncertainty of hydropower.
Philippines
Large hydropower plants are mostly built in the largest islands of Luzon, Davao, and Samar Island. The most power consuming provinces of the country fall under these islands and this makes the transmission system efficient in wheeling electricity from the plants to consumers. Most of the upcoming hydropower plants are also in these two islands.
Russian Federation
According to the Energy Strategy of the country, there will be growth in electricity consumption in the whole of Russia, with a view to accelerate natural resource development in Western and Eastern Siberia, the Far East, the European North, and the Caspian Region. Under Russia’s Energy Strategy to 2030, the government intends to increase the share of nuclear power and, to a smaller extent, hydropower as well in its energy mix and generate around half of the country’s electricity using these two sources.
Turkey
Turkey has considerable hydropower potential in the form of rivers and lakes – especially in high-altitude regions around the Black Sea. Turkey’s hydropower capacity was entirely state owned until the privatization drive was initiated in the power sector. Several hydropower plants owned by state agencies including EUAS and DSI were privatized by being sold to private companies partially or fully. This privatization drive was a key part of the country’s strategy to liberalize the country’s energy sector.
Hydropower market, by key countries
For more country insights, download a free sample
Who are the key players in the global hydropower market?
The key players in the global hydropower market are Tennessee Valley Authority, Hydro Quebec, China Three Gorges, China Three Gorges Brasil Energia, Central Puerto SA, NHPC, Pakistan Water and Power Development Authority, Marubeni Corp, RusHydro, and DSI.
Market report scope
| Market size | 1,311 GW |
| CAGR | >2% |
| Forecast period | 2020-2030 |
| Key segments | Large Hydro, Pumped Storage, and Small Hydro |
| Key regions | Asia-Pacific, Europe, North America, South and Central America, and Middle East & Africa |
| Key countries | The US, Canada, Brazil, Argentina, China, India, Pakistan, Philippines, Russian Federation, and Turkey |
| Key players | Tennessee Valley Authority, Hydro Quebec, China Three Gorges, China Three Gorges Brasil Energia, Central Puerto SA, NHPC, Pakistan Water and Power Development Authority, Marubeni Corp, RusHydro, and DSI |
Scope
The report includes:
- Hydropower market study at global level, and at key country level covering ten key countries in depth.
- Key growth drivers and challenges at a global level including the challenge posed by the COVID-19 pandemic on the global hydropower market.
- The impact of the COVID-19 pandemic on the hydropower markets of each of the ten key countries.
- Historic and forecast data for cumulative installed hydropower capacity and generation split by type (large hydro, small hydro, and pumped storage) is provided at global level and also for each of the 10 countries covered.
- Major active and upcoming hydropower plants in each of the ten key countries.
- Annual deal value and volume during 2010–2019, globally and in each of the 10 key countries.
Key Highlights
–
Reasons to Buy
The report will allow you to:
- Facilitate decision-making by providing historical and forecast data in the hydropower market.
- Develop business strategies by understanding the drivers and challenges of the market.
- Position yourself to gain the maximum advantage of the industry’s growth potential.
- Maximize potential in the growth of the hydropower market
- Identify key partners, geographies, and business-development avenues.
- Respond to business structure, strategy, and prospects.
Hydro Quebec
China Three Gorges
China Three Gorges Brasil Energia
Central Puerto SA
NHPC
Pakistan Water and Power Development Authority
Marubeni Corp
RusHydro
DSI
Table of Contents
Table
Figures
Frequently asked questions
-
What was the global hydropower market size in the year 2020?
The global hydropower market size was 1,311 GW in the year 2020.
-
What is the global hydropower market growth rate?
The global hydropower market is expected to grow at a CAGR of 2% during the forecast period.
-
Which are the key segments in the global hydropower market?
Large hydro, pumped storage, and small hydro are the key segments in the global hydropower market.
-
Which are the key regions in the global hydropower market?
Asia-Pacific, Europe, North America, South and Central America, and Middle East & Africa are the key regions in the global hydropower market.
-
Which are the key countries in the global hydropower market?
The US, Canada, Brazil, Argentina, China, India, Pakistan, Philippines, Russian Federation, and Turkey are the key countries in the global hydropower market.
-
Which are the key players in the global hydropower market?
Tennessee Valley Authority, Hydro Quebec, China Three Gorges, China Three Gorges Brasil Energia, Central Puerto SA, NHPC, Pakistan Water and Power Development Authority, Marubeni Corp, RusHydro, and DSI are the key players in the global hydropower market.
Get in touch to find out about multi-purchase discounts
reportstore@globaldata.com
Tel +44 20 7947 2745
Every customer’s requirement is unique. With over 220,000 construction projects tracked, we can create a tailored dataset for you based on the types of projects you are looking for. Please get in touch with your specific requirements and we can send you a quote.
Sample Report
Hydropower Market (Large Hydro, Small Hydro, and Pumped Storage), Update 2020 – Global Market Size, Segmentation, Investment Trends, and Key Country Analysis to 2030 was curated by the best experts in the industry and we are confident about its unique quality. However, we want you to make the most beneficial decision for your business, so we offer free sample pages to help you:
- Assess the relevance of the report
- Evaluate the quality of the report
- Justify the cost
Download your copy of the sample report and make an informed decision about whether the full report will provide you with the insights and information you need.