Infrastructure Construction Market Analysis by Region, Sector, Project Pipelines, Trends and Growth Forecast to 2027
Powered by ![]()
All the vital news, analysis, and commentary curated by our industry experts.

How will the ‘Infrastructure Construction Market’ help you achieve your business goals?
The report’s in-depth analysis and market insights will enable you to:
- Identify and evaluate market opportunities using our standardized valuation and forecasting methodologies.
- Assess market growth and understand the latest trends in the infrastructure construction
- Formulate business strategies using GlobalData’s critical and actionable insights.
How is the ‘Infrastructure Construction Market’ report different from other reports in the market?
Businesses need to have a deeper understanding of the market dynamics to gain a competitive edge in the coming decade. Anticipate market changes and develop risk management strategies with the following data:
- Overview of the global infrastructure industry to 2027, including roads, railways, power generation, airports, ports, and water and sewage.
- Comprehensive insights into the infrastructure industry in major global regions: North America, Latin America, Western Europe, Eastern Europe, South Asia, South-East Asia, North-East Asia, Australasia, the Middle East and North Africa, and Sub-Saharan Africa.
- Benchmarking 91 leading construction markets according to infrastructure construction market value and growth.
- Analysis of the latest infrastructure pipeline projects across key sectors and markets.
We recommend this valuable source of information to anyone involved in:
- Contractors including Civil Works, Electrical, HVAC, And Others
- Engineers
- Management consultants and Investment Banks
- Construction Consultants/Designers
- Professional Services/ Consultancies
- Construction Technology suppliers
- Building Material Merchants/Players
- Construction Equipment Suppliers
- Portfolio Managers / Buy-side Firms
- Insurance Companies
To Get a Snapshot of the Infrastructure Construction Market Report
Infrastructure Construction Market Report Overview
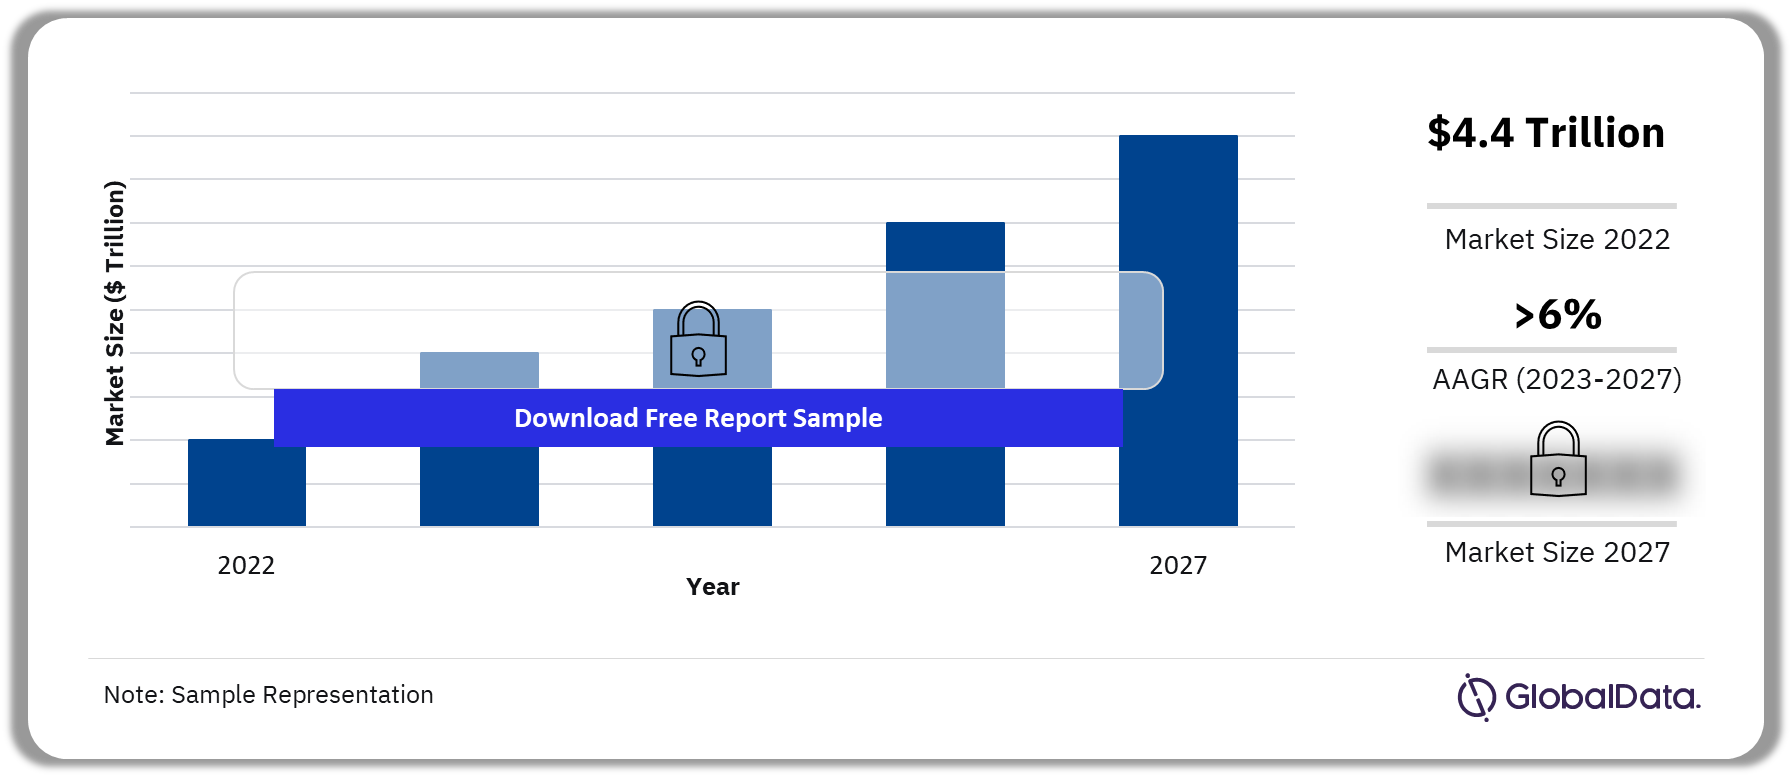
The infrastructure construction market size was $4.4 trillion in 2022. The market is primarily driven by increasing infrastructure investments by governments of various countries to generate economic growth momentum and help offset weakness in other construction sectors, particularly residential construction.
In the coming five years, infrastructure construction will grow at an AAGR of more than 6% reflecting major spending plans in key economies, notably the US and China.
Infrastructure Construction Market Outlook, 2022-2027 ($ Trillions)
Buy the Full Report for More Insights on the Infrastructure Construction Market Forecasts
The infrastructure construction market report provides a comprehensive understanding of the market growth forecasting up to 2027 and a historical overview of the infrastructure construction industry. It gives an overview of the key sectors and updates on the pipeline projects.
| Market Size (2022) | $4.4 Trillion |
| AAGR (2023-2027) | >6% |
| Key Sectors | · Roads
· Railways · Electricity & Power · Water and Sewerage · Airports and Other Infrastructure |
| Key Regions | · North-East Asia
· South-East Asia · South Asia · Australasia · Middle East and North Africa · Sub-Saharan Africa · US and Canada · Latin America · Western Europe · Eastern Europe and Central Asia |
| Enquire & Decide | Discover the perfect solution for your business needs. Enquire now and let us help you make an informed decision before making a purchase. |
Infrastructure Construction Market Sectors
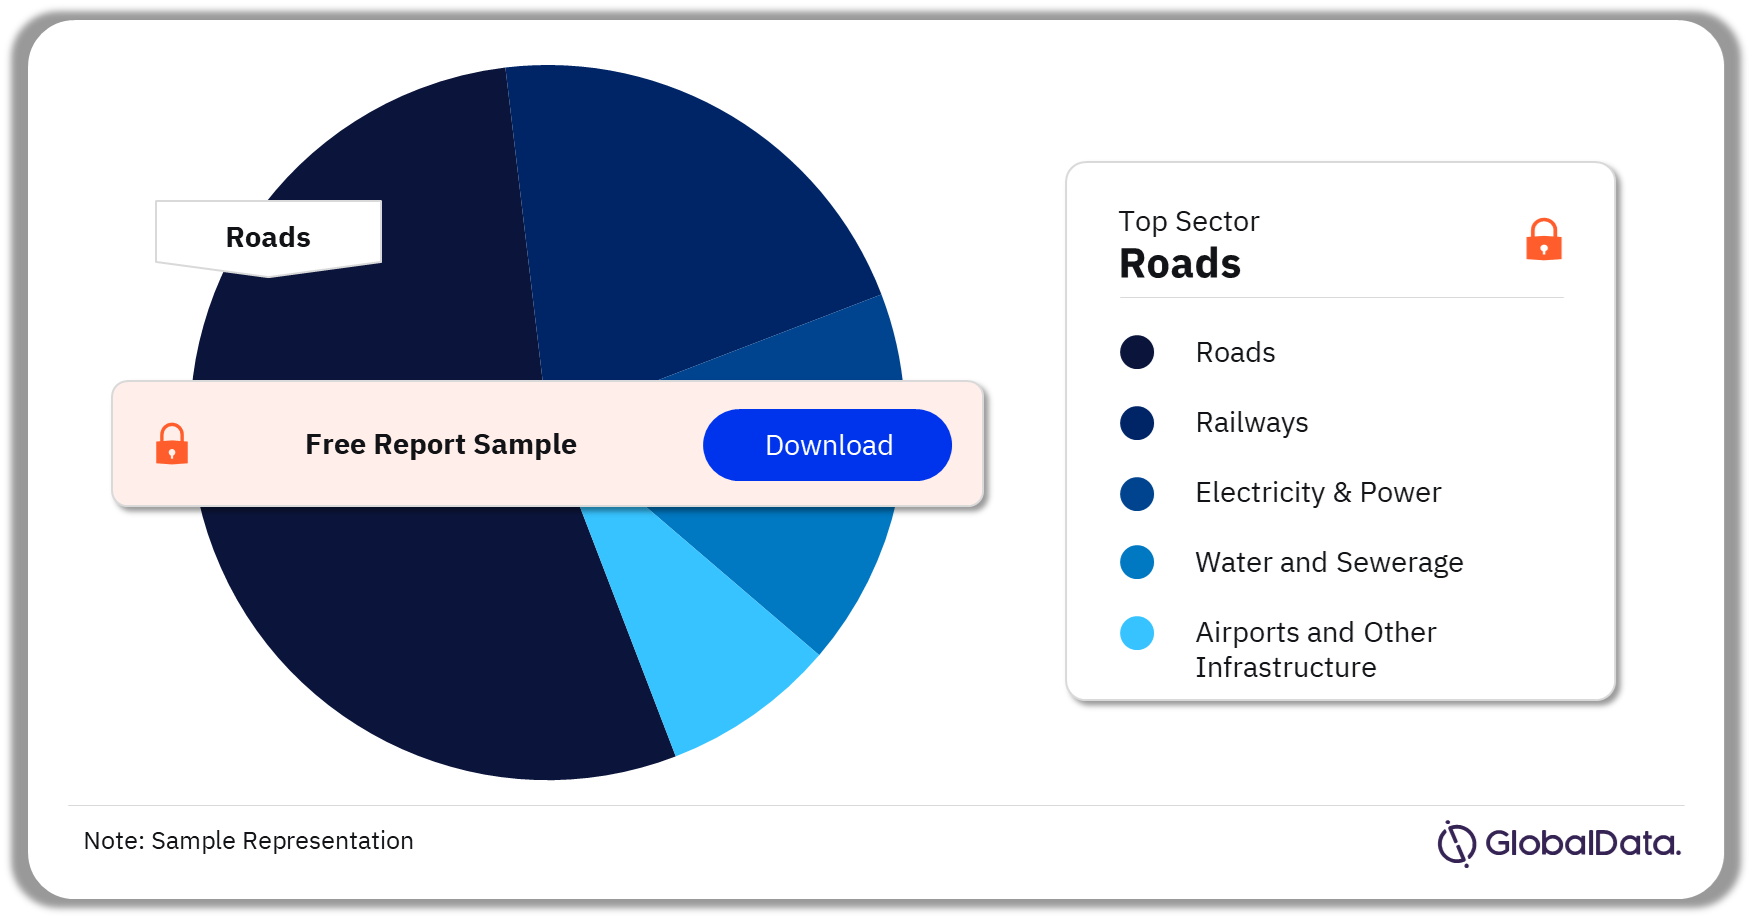
The key sectors in the construction industry are roads, railways, electricity & power, water and sewerage, and airports and other infrastructure. Road infrastructure construction had the highest revenue share in 2022, followed by electricity & power.
Road Construction: By region, the markets which recorded the highest annual road infrastructure output in 2022 were China, Western Europe, and North America. Although China’s construction industry is being severely impacted by the financial crisis in the real estate sector, the government is investing heavily in infrastructure to drive the economy. The growth of the construction industry will, however, be supported by a substantial increase in public investment in the infrastructure, and energy and utilities construction sectors. In North America, the increase in output in 2022 can, in part, be attributed to an increase in available funding for projects through the Infrastructure Investment and Jobs Act.
Infrastructure Construction Market Analysis, by Sectors, 2022 (%)
Buy the Full Report for More Sector-Wise Insights into the Construction Industry
Infrastructure Construction Market Segmentation by Regions
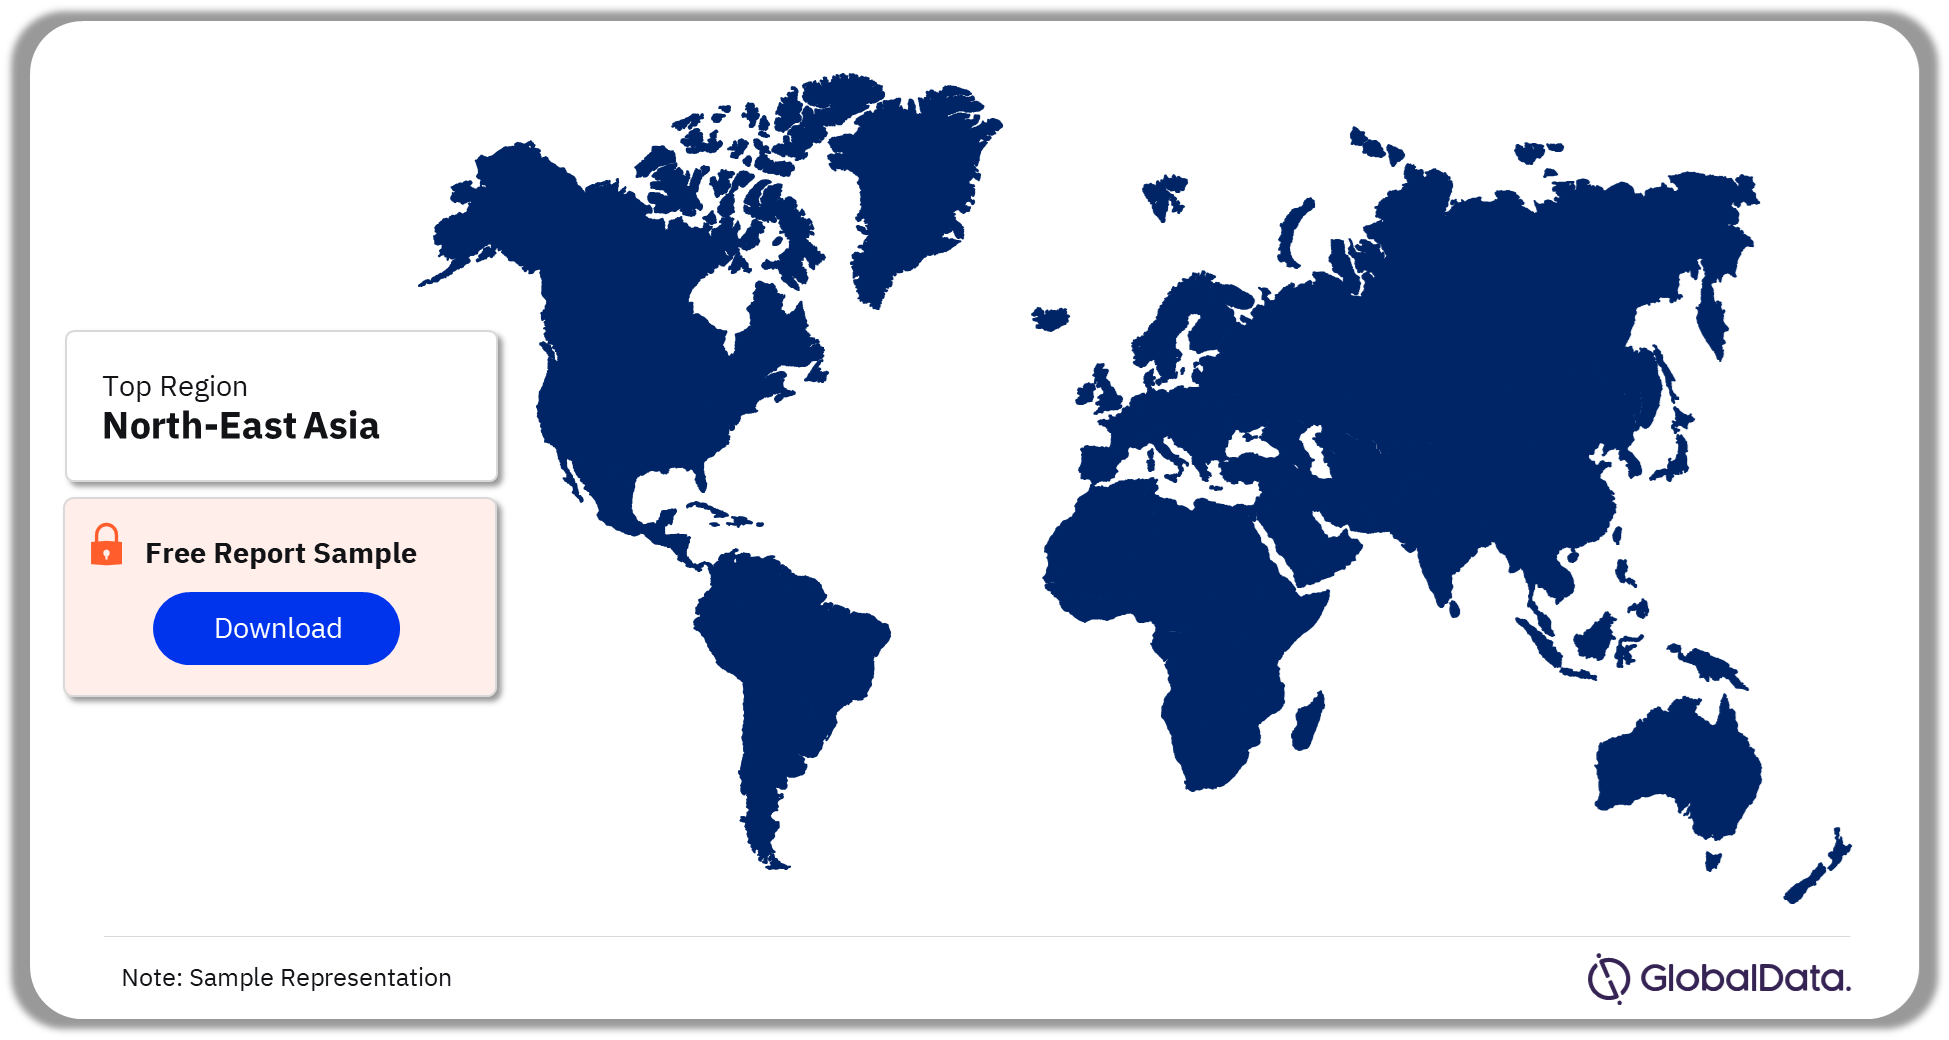
The key regions in the infrastructure construction market are North-East Asia, South-East Asia, South Asia, Australasia, Middle East and North Africa, Sub-Saharan Africa, US and Canada, Latin America, Western Europe, Eastern Europe and Central Asia. In 2023, North-East Asia accounted for the highest construction output value. The leading countries contributing to the regional growth in 2022 were China, Japan, South Korea, Taiwan, Hong Kong, Macau, and Mongolia. China contributed the highest construction output value in the region during 2023.
Infrastructure Construction Market Analysis by Regions, 2022 (%)
Buy the Full Report for More Regional Insights on the Infrastructure Construction Market
Sectors Covered in the Report
Infrastructure Construction Market Sectors Outlook (Value, $ Trillion, 2017-2027)
- Roads
- Railways
- Electricity & Power
- Water and Sewerage
- Airports and Other Infrastructure
Infrastructure Construction Market Regions Outlook (Value, $ Trillion, 2017-2027)
- North-East Asia
- South-East Asia
- South Asia
- Australasia
- Middle East and North Africa
- Sub-Saharan Africa
- North America
- Latin America
- Western Europe
- Eastern Europe
Table of Contents
Table
Figures
Frequently asked questions
-
What was the size of the infrastructure construction market?
The infrastructure construction market size was $4.4 trillion in 2022.
-
What is the growth rate of the infrastructure construction market?
The infrastructure construction market is expected to grow at an AAGR of more than 6% between 2023-2027.
-
Which region had the highest construction output value in 2022?
North-East Asia accounted for the highest construction output value in 2022.
-
Which country had the largest share in the North-East Asian region in 2022?
China led the North-East Asian infrastructure construction market with the highest construction output value.
-
Which sector dominated the infrastructure construction market?
The road sector dominated the infrastructure construction market in 2022 and is anticipated to continue doing so during the forecast period.
Get in touch to find out about multi-purchase discounts
reportstore@globaldata.com
Tel +44 20 7947 2745
Every customer’s requirement is unique. With over 220,000 construction projects tracked, we can create a tailored dataset for you based on the types of projects you are looking for. Please get in touch with your specific requirements and we can send you a quote.
Sample Report
Infrastructure Construction Market Analysis by Region, Sector, Project Pipelines, Trends and Growth Forecast to 2027 was curated by the best experts in the industry and we are confident about its unique quality. However, we want you to make the most beneficial decision for your business, so we offer free sample pages to help you:
- Assess the relevance of the report
- Evaluate the quality of the report
- Justify the cost
Download your copy of the sample report and make an informed decision about whether the full report will provide you with the insights and information you need.