Internet of Things (IoT) Market Trends and Analysis by End-User, Product, Enterprise Size, Vertical, Region, and Segment Forecast to 2027
Powered by ![]()
Access in-depth insight and stay ahead of the market

Accessing the in-depth insights from the ‘Internet of Things’ report can help:
- Gain a valuable understanding of the current and future state of the market. This will allow businesses to make informed decisions about market entry, product development, and investments
- Identify competitors’ capabilities to stay ahead in the market
- Identify segments and get an understanding of various stakeholders across different stages of the entire value chain
- Anticipate changes in demand and adjust the business development strategies
- Identify potential regions and countries for growth opportunities
How is our ‘Internet of Things’ report different from other reports in the market?
- The report presents in-depth market sizing and forecast at a segment level for more than 15 countries including historical and forecast analysis for the period 2019-2027 for market assessment.
- Detailed segmentation by:
- End-User – Enterprise and Consumer
- Product – IoT Hardware, IoT Software, IoT Services
- Vertical – Government, Utilities, Manufacturing, Transport and Logistics, Energy, Insurance, Construction, Retail, Healthcare, Others
- Enterprise size – Micro, Small, Medium, Large, Very large
- Consumer Product – Automated Home, Connected Car, Wearables
- Region – North America, Europe, Asia-Pacific, South & Central America, and Middle East & Africa
- The report covers key market drivers and challenges impacting the IoT market.
- The report also covers a Mergers & Acquisitions (M&A) activity dashboard.
- The competitive landscape includes competitive positioning of key companies and company share analysis in the IoT market that will help the stakeholders in the ongoing process of identifying, researching, and evaluating competitors, to gain insight to form their business strategies.
- Competitive profiling and benchmarking of key companies in the market to provide a deeper understanding of industry competition.
- The report can be a valuable tool for stakeholders to improve their operations, increase customer satisfaction, and maximize profitability by analyzing the latest IoT trends, tracking market growth and demand, and evaluating the existing competition in the market.
We recommend this valuable source of information to:
- Companies offering IoT services/solutions
- Consulting & Professional Services Firms
- Venture Capital/Equity Firms
Buy the Full Report for Additional IoT Market Insights, Download a Free Sample Report
Internet of Things (IoT) Report Overview
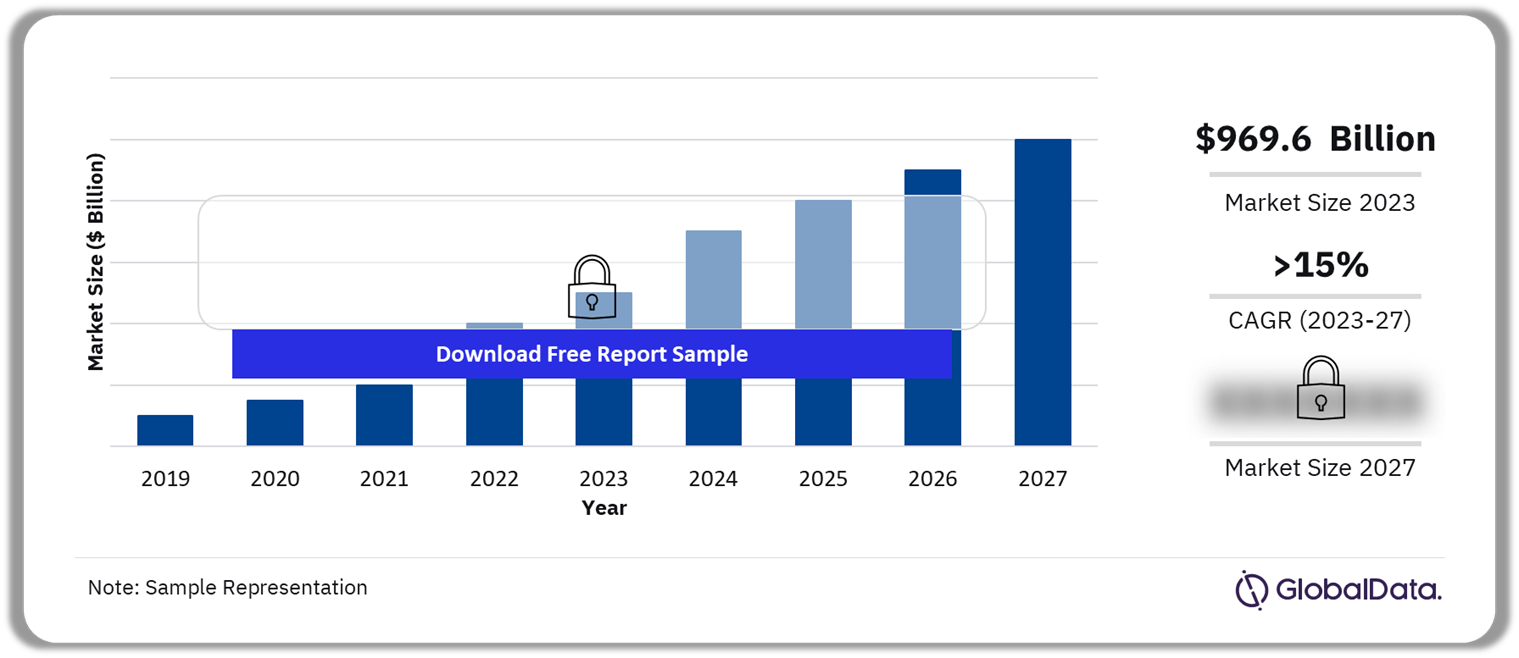
The Internet of Things (IoT) market size revenue was valued at $969.6 billion in 2023 and is expected to grow at a compound annual growth rate (CAGR) of more than 15% over the forecast period. The adoption of IoT is poised to receive significant support from the rise of artificial intelligence of things (AIoT), driven primarily by advancements such as ChatGPT, the growing acceptance of smart cities, and progress in connectivity technologies such as LoRaWAN, Sigfox, and Zigbee. IoT stands as a key driver of digital transformation, particularly when integrated with other cutting-edge technologies such as AI, 5G, and cloud computing. This integration holds the promise of boosting operational efficiency, slashing costs, refining decision-making processes, and elevating customer experiences. IoT technology utilizes interconnected devices to oversee, regulate, and supervise various business operations, enabling the automation of numerous manual tasks and predictive maintenance, thereby enhancing productivity.
Internet of Things (IoT) Market Outlook 2019 – 2027 ($ Billion)
Buy the Full Report for Additional Insights on the Market Size Projections,
Download a Free Sample
The sensors embedded within IoT devices generate vast amounts of data. Analyzing this data can drive the development of optimized business strategies and enhanced operational processes, empowering managers to make more informed decisions. Furthermore, the user-specific data collected through smart devices aids businesses and getting deeper insights into customer expectations and behaviors. Analyzing this data facilitates targeted advertising, refinement of pricing strategies, and improvements in customer service. The COVID-19 pandemic underscored the indispensable role of IoT in our daily lives. While many traditional IoT applications, such as smart city projects, were put on hold due to the economic slowdown and shifting government priorities, several IoT use cases experienced increased adoption during the pandemic. Examples include using connected thermal cameras for potential COVID-19 infection detection and implementing sensors to monitor office occupancy levels. These emerging applications have fostered a positive perception of IoT as a crucial facilitator of the future. Despite the market gaining momentum, numerous companies, especially small and medium-sized enterprises (SMEs), continue to lack a comprehensive understanding of IoT, leading to low adoption rates. Consequently, IoT solution providers should prioritize raising awareness by employing clear messaging, presenting compelling case studies, and offering proof points that demonstrate IoT as a competitive edge. Furthermore, the broader promotion of IoT products is vital to reach potential inductors effectively.
| Market Size (2023) | $969.6 billion |
| CAGR (2023-2027) | >15% |
| Forecast Period | 2023-2027 |
| Historic Period | 2019-2022 |
| Report Scope & Coverage | Industry overview, revenue forecast, regional analysis, competitive landscape, company profiles, growth trends |
| End-user Segment | · Enterprise IoT
· Consumer IoT |
| Product Type Segment | · IoT Hardware
· IoT Software · IoT Services |
| Enterprise Size Segment | · Very Large (5,000+)
· Large (1,001- 4,999) · Medium (251-1,000) · Small (51-250) · Micro (Less than 50) |
| Vertical Segment | · Government
· Manufacturing · Retail · Transport and Logistics · Energy |
| Consumer Product Segment | · Automated Homes
· Connected Car · Wearables |
| Regional Segment | · North America
· Europe · Asia Pacific · South & Central America · Middle East & Africa |
| Leading Companies | · Microsoft Corp
· Alphabet Inc · Samsung Electronics Co Ltd · Intel Corp · Qualcomm Inc |
| Enquire & Decide | Discover the perfect solution for your business needs. Enquire now and let us help you make an informed decision before making a purchase. |
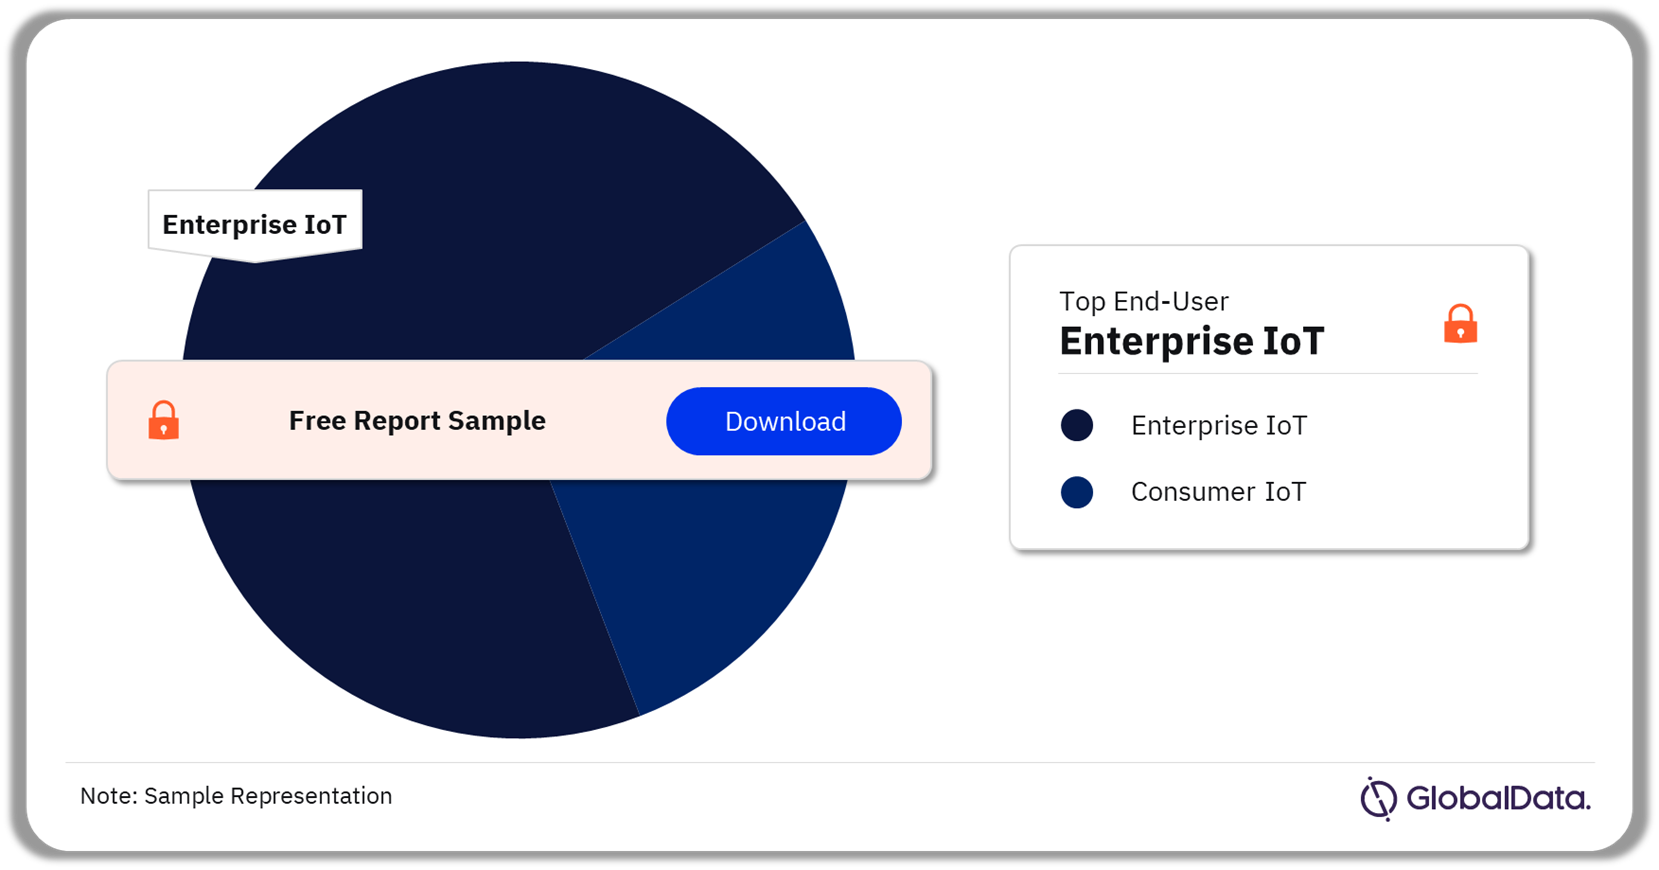
Internet of Things (IoT) Market Segmentation by End-User
The market by end-user is segregated into enterprise and consumer segments. The enterprise segment demand is projected to capture more than 70% of the market by 2027. IT services have become indispensable in the Internet of Things value chain. Integrating both information technology (IT) and operational technology (OT) calls for the expertise of external consulting firms, particularly in the expanding realm of predictive maintenance. Notably, there is a thriving market for smart city design and integration services, which harmonize applications across smart buildings, transportation, infrastructure, and power grids.
The pandemic has made it imperative for cities to embrace smart technologies like IoT and AI to effectively tackle future challenges. By harnessing smart city data and conducting efficient analysis, cities can automate their infrastructure, thereby enhancing the well-being and safety of residents. AI holds immense potential to transform energy distribution, optimize the performance of water pipelines, sewage systems, and utilities, and predict and mitigate maintenance requirements.
Moreover, it can streamline transportation networks and bolster urban planning by providing insights into strategies for reducing CO2 emissions. Additionally, while the initial rollout of 5G communications may have been slow, it will ultimately play a pivotal role in advancing smart city initiatives.
Internet of Things (IoT) Market Analysis by End-User, 2023 (%)
Buy the Full Report for End-User Insights in the IoT Market, Download a Free Sample Report
The widespread adoption of IoT hinges on establishing a global standard for IoT security. The surge in connected devices has heightened cyberattack vulnerabilities, yet current IoT ecosystems lack sufficient security regulation. IoT security encompasses threats across devices, apps, networks, and data, primarily focusing on endpoint security to safeguard all connected devices. Attacks on industrial equipment and critical infrastructure pose significant threats, especially due to weak or nonexistent security controls on many devices. While regulations such as the US IoT Cybersecurity Improvement Act are emerging, manufacturers are improving device security, for a unified IoT adoption.
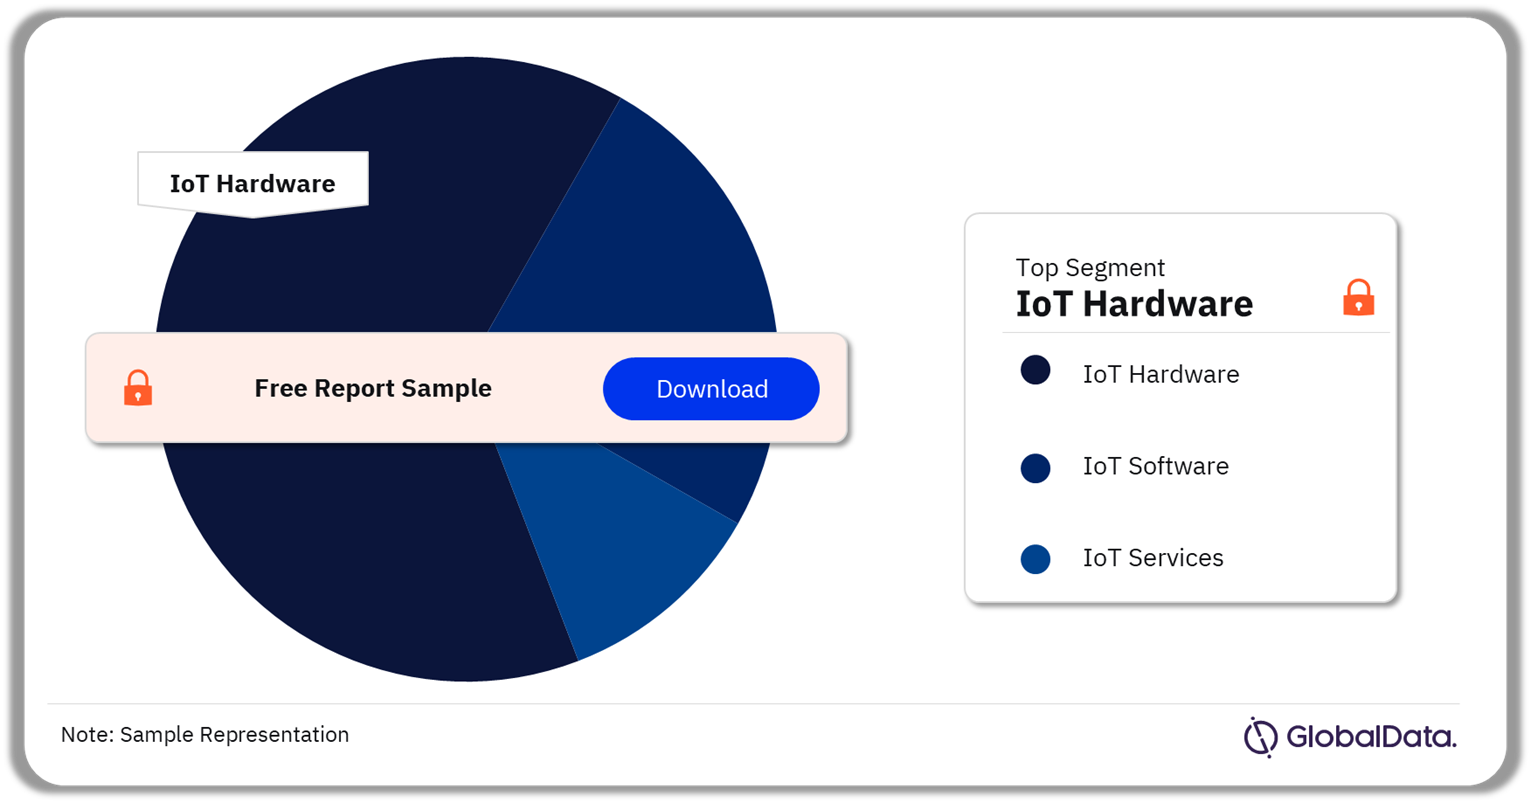
Internet of Things (IoT) Market Segmentation by Product Type
IoT solution is primarily implemented through three product types, IoT hardware, IoT software, and IoT services. The IoT hardware segment demand is projected to capture more than 50% of the market by 2027. During the forecast period, the IoT hardware market will witness healthy growth, exceeding a CAGR of 12% over the forecast period.
Internet of Things (IoT) Market Analysis by Product Type, 2023 (%)
Buy the Full Report for Segment-specific IoT Market Revenues and Shares,
Download a Free Sample
In 2023, the IoT software segment accounted for approximately 20% of the market value. This segment encompasses software, applications, and platforms that facilitate the management and operation of critical aspects within the connected ecosystem, such as networking (via platforms, embedded systems, and middleware), data collection, device integration, and data analysis. One significant application area of IoT software is the digital twin, which is a software representation of physical assets and processes enabling organizations to conduct ‘what if simulations’. These simulations aid in proactively identifying and addressing issues, preventing downtime, and accelerating the development of new products. As a result, the rise of digital twin technology is poised to propel the IoT software market forward.
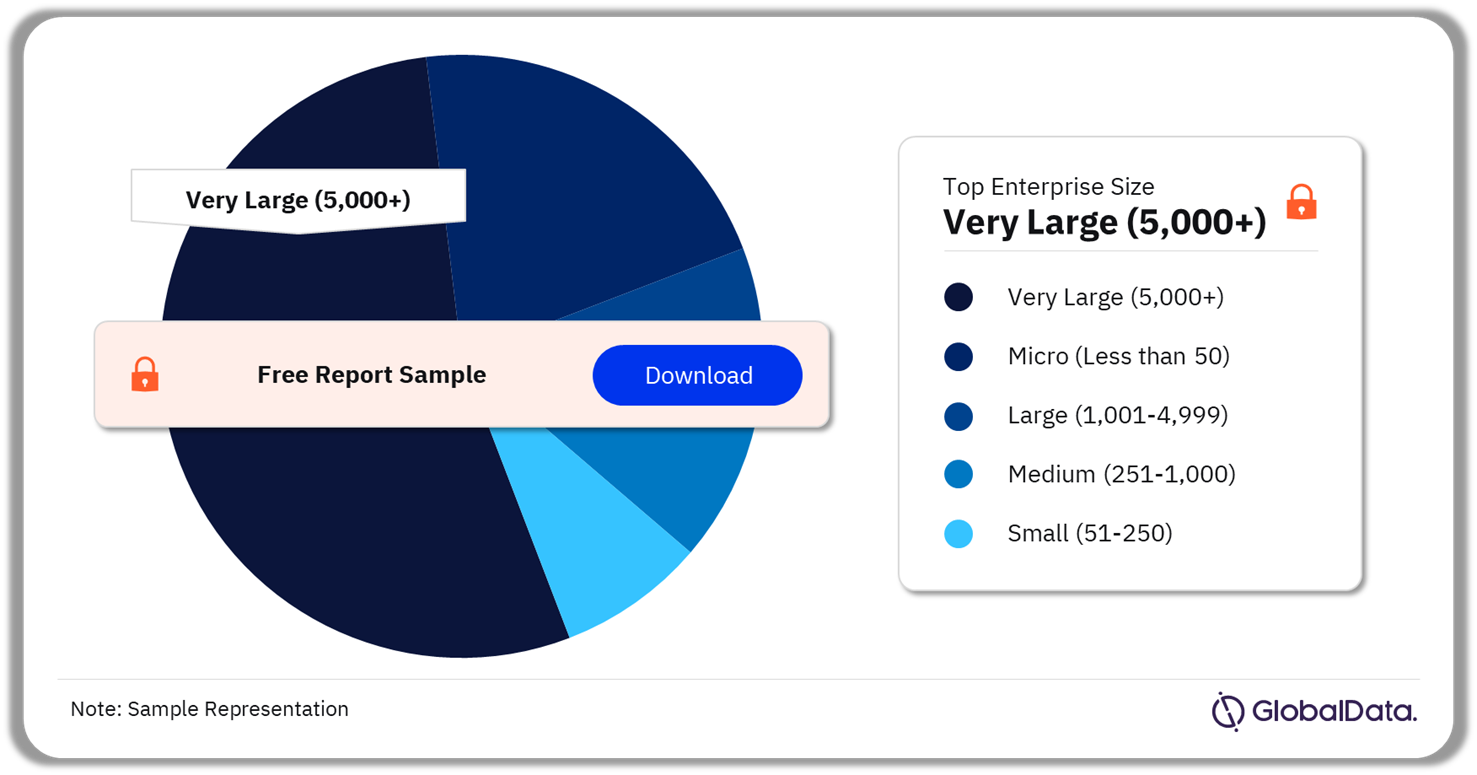
Internet of Things (IoT) Market Segmentation by Enterprise Size
Based on enterprise size, the Internet of Things market is categorized into very large (5000+), large (1001-4999), medium (251-1000), small (51-250), and micro (less than 50). In 2023, the very large enterprises market captured a sizeable market share exceeding 35%, and the segment is anticipated to witness strong growth, recording a CAGR surpassing 15% over the forecast period.
Internet of Things Market Analysis By Enterprise Size, 2023 (%)
Buy the Full Report for Enterprise-Size Insights in the IoT Market, Download a Free Sample Report
Critical drivers for the expansion of IoT entail enterprise-wide digital transformation, the adoption of industry 4.0 standards, and traditional industries seeking sustainable operational approaches. Moreover, simultaneous technological advancements, including the deployment of 5G networks and the uptake of advanced analytics and AI, facilitate rapid processing of data gathered from diverse enterprise IoT nodes, enabling swift responses. Numerous manufacturers are leveraging IoT manufacturing applications to reduce costs, enhance facility services, and bolster worker safety, among other benefits.
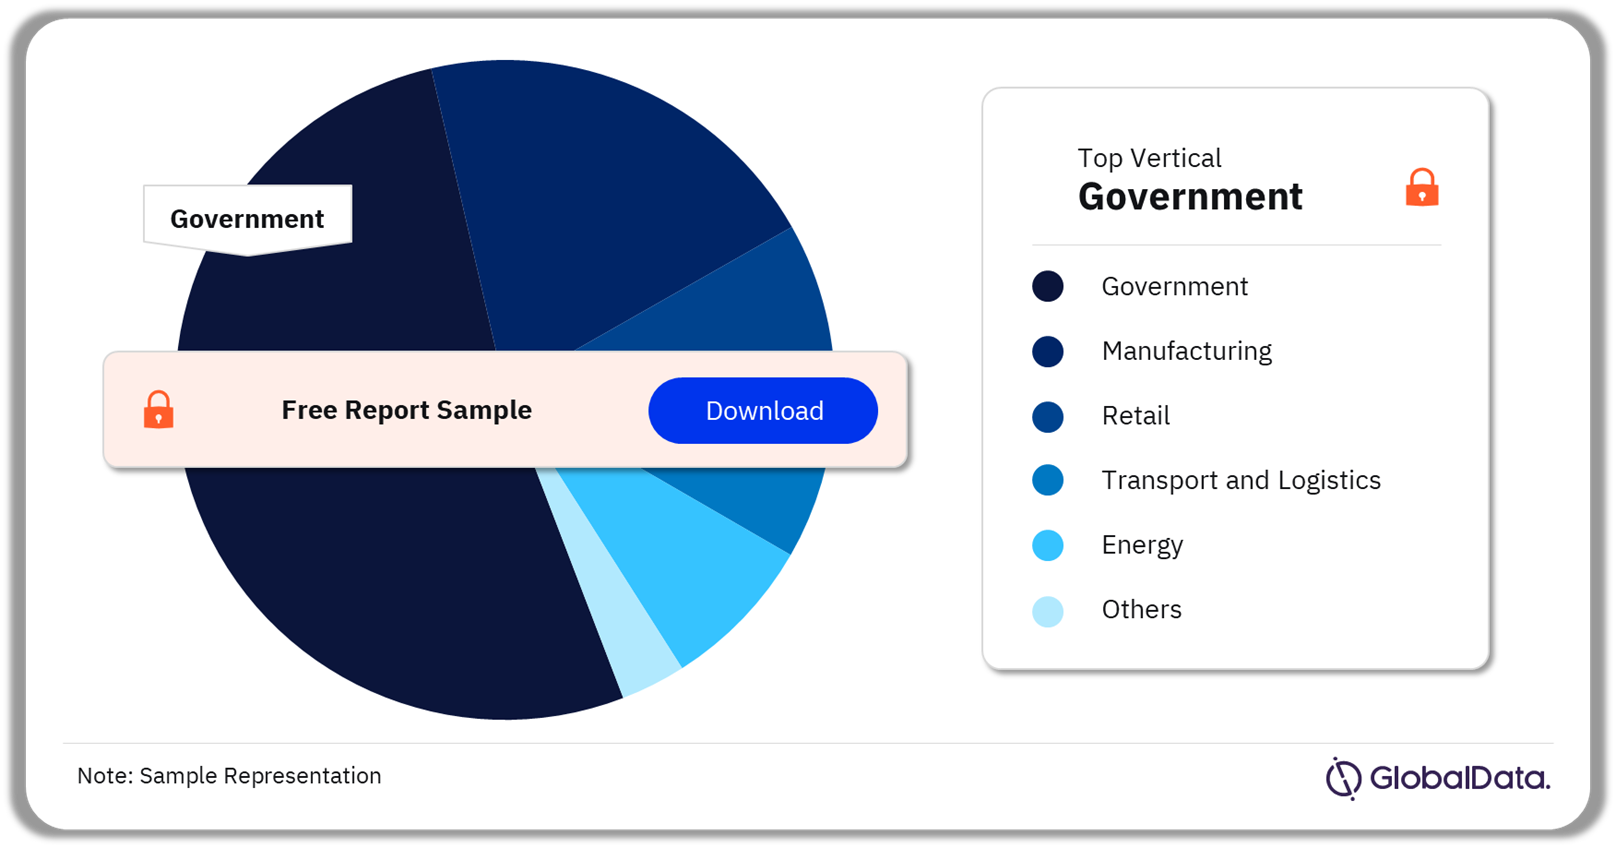
Internet of Things (IoT) Market Segmentation by Vertical
The IoT vertical segment includes government, utilities, manufacturing, transport and logistics, energy, insurance, construction, retail, and healthcare, among others. As of 2023, the IoT market in the government category captured the highest market size, accounting for over 10% of the overall IoT market size globally. The government segment includes central, federal, regional, state, and local (county or municipality) governments and other government establishments such as advisory commissions, etc. Governments of various countries are investing in the creation of smart cities, which will drive the government segment.
Internet of Things (IoT) Market Analysis by Vertical, 2023 (%)
Buy the Full Report for Vertical-Wise Insights in the IoT Market, Download a Free Sample Report
Additionally, verticals such as utilities, manufacturing, energy, transport and logistics, and retail captured over 25% of the market size in 2023. As traditional applications of IoT in government public sector services, such as smart city and traffic management, continue to gain traction, the emergence of new IoT use cases in connected vehicles, autonomous driving, smart packaging, and patient monitoring is becoming increasingly apparent.
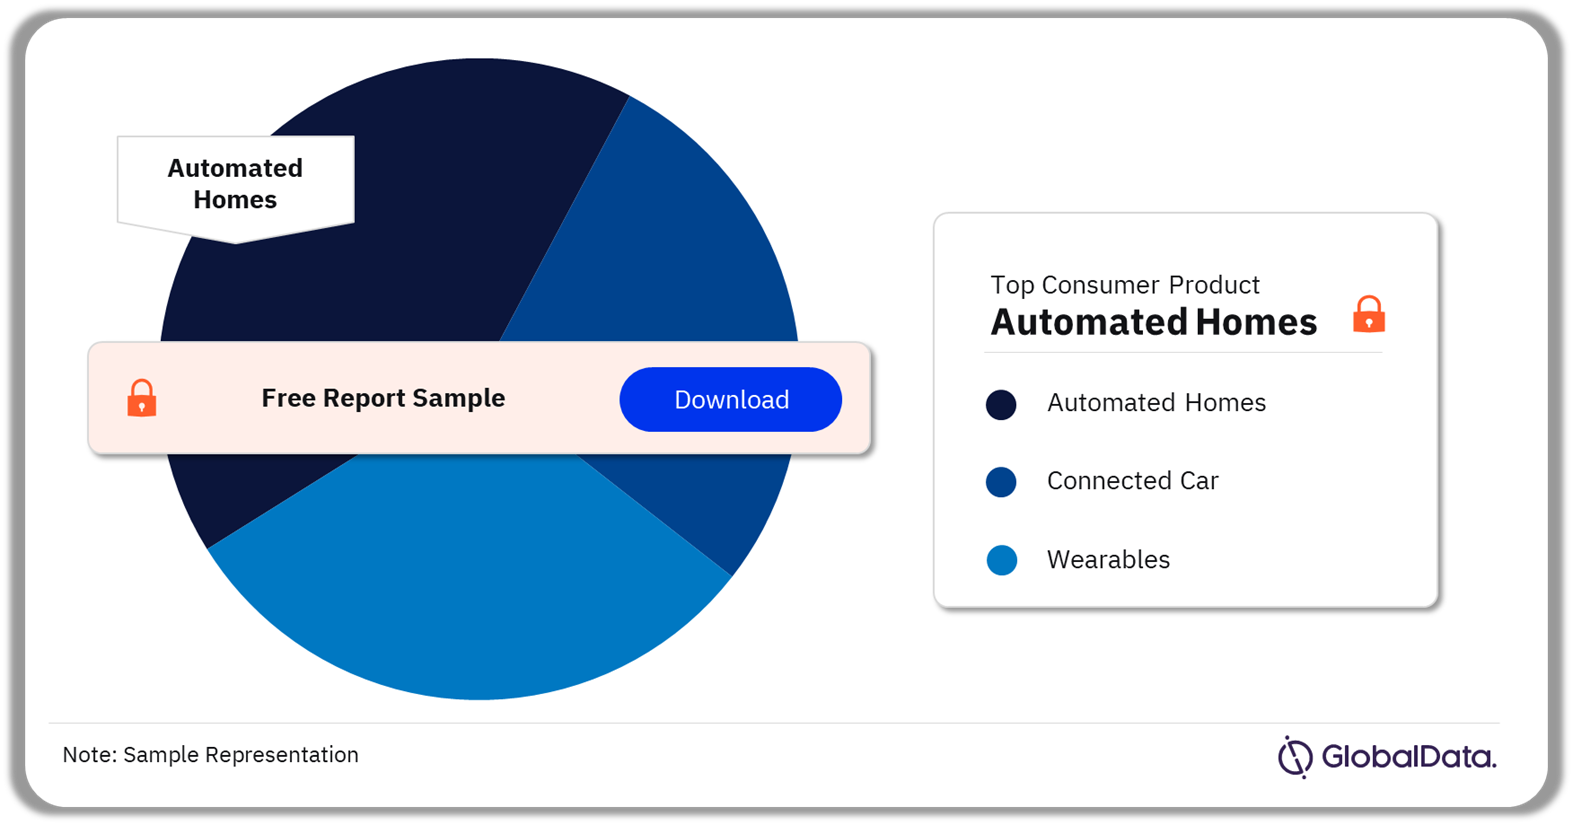
Internet of Things (IoT) Market Segmentation by Consumer Product
Based on consumer products, the market is categorized into automated home, connected car, and wearables. In 2023, the automated homes market captured a sizeable market share exceeding 35%. The wearables segment is anticipated to witness strong growth over the forecast period, recording a CAGR surpassing 12%.
The emergence of smart speakers has significantly influenced the landscape of automated homes, offering seamless, voice-activated control over various smart devices. With their relatively affordable price tags, they serve as an accessible entry point for customers interested in exploring home automation. Moreover, their success has increased competition among tech industry giants such as Amazon, Google, Apple, Alibaba, and Samsung.
Internet of Things (IoT) Market Analysis by Consumer Product, 2023 (%)
Buy the Full Report for Consumer-Products Insights in the IoT Market, Download a Free Sample Report
Amidst global challenges such as escalating living expenses and the impact of the Ukraine conflict on energy prices, consumers are increasingly turning to automated home devices such as smart thermostats. These devices, equipped with sensors, continuously monitor the environment, regulate home temperatures, and ensure minimal energy consumption when the home is unoccupied. According to a study conducted by Nest Labs, smart thermostats potentially save the average household up to 12% on heating costs and 15% on cooling costs.
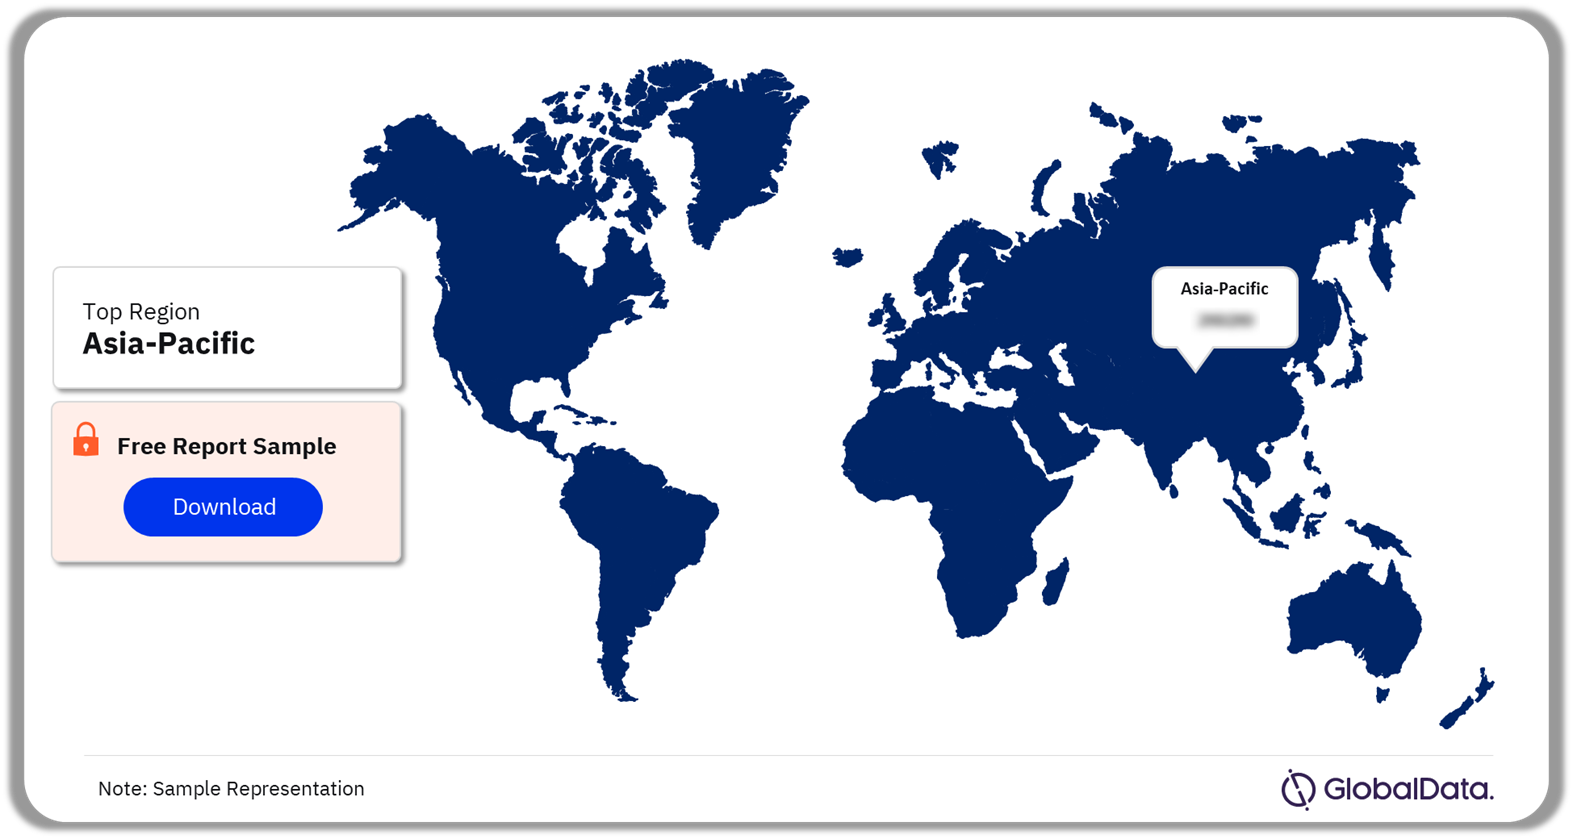
Internet of Things (IoT) Market Segmentation by Regions
Asia Pacific’s IoT market value was the highest in 2023, capturing over 30% of the overall market size. The US and China led the regional market, collectively accounting for over 40% of the IoT market in 2023. The adoption of mobile 5G services supported by increasing demand for smart city platforms will drive the regional IoT markets.
The expansion of IoT is driven by several simultaneous developments. Enterprise demand for process enhancement is a primary driver behind the adoption of IoT-enabled condition monitoring. Additionally, businesses are deploying IoT devices and technologies to enhance sustainability and minimize ecological footprints in compliance with regulatory requirements. The deployment of 5G networks is anticipated to accelerate IoT adoption further, as enhanced connectivity ensures superior real-time monitoring capabilities. Moreover, the advent of IoT has facilitated the rapid processing of large volumes of data collected at IoT nodes with minimal latency.
Internet of Things (IoT) Market Analysis by Region, 2023 (%)
Buy the Full Report for Regional Insights in the IoT Market, Download a Free Sample Report
Asia Pacific is projected to retain the largest share by 2027, accounting for over 30% of the IoT market value, with a forecasted growth rate exceeding 15% over the forecast period. The growing demand and implementation of 5G services will favor the proliferation of the IoT market in Asia Pacific. Apart from the Asia Pacific market, the South and Central America IoT market is also expected to witness growth over the near future, registering a CAGR of more than 15% over the forecast period.
Internet of Things (IoT) Market – Competitive Landscape
The competitive scenario in the IoT sector is characterized by significant fragmentation. Many venture capital firms are making substantial investments in innovative IoT startups that boast cutting-edge expertise. The trend toward IoT ecosystem consolidation through mergers and acquisitions appears promising for streamlining the complex market. However, customers continue to express frustration regarding the need to purchase and manage separate components from various vendors, which can present challenges in demonstrating satisfactory returns on investment to key stakeholders.
In January 2024, Vodafone and Microsoft revealed a decade-long collaboration valued at $1.5 billion. The partnership aims to introduce generative AI (Gen AI), digital solutions, enterprise services, and cloud offerings to more than 300 businesses and public sector entities spanning Europe and Africa.
Additionally, in December 2023, Intel and Siemens forged a partnership agreement to advance and accelerate digitization within the manufacturing process. Leveraging their respective portfolios of Internet of Things (IoT) solutions, along with Siemens’ automation technologies, the collaboration aims to enhance manufacturing processes and factory cybersecurity and foster, fostering a resilient industry ecosystem.
The key companies leading the IoT market include Microsoft Corp, Alphabet Inc, International Business Machines Corp, Samsung Electronics Co Ltd, Intel Corp, Qualcomm Inc, Apple Inc, Amazon.com Inc, Cisco Systems Inc, and Salesforce Inc, among others.
Leading Companies of the Internet of Things (IoT) Market
- Microsoft Corp
- Alphabet Inc
- Samsung Electronics Co Ltd
- Intel Corp
- Qualcomm Inc
- Apple Inc
- International Business Machines Corp
- Amazon.com Inc
- Cisco Systems Inc
- Salesforce Inc
Other Internet of Things (IoT) Market Vendors Mentioned
Telefonaktiebolaget LM Ericsson, Deutsche Telekom AG, Vodafone Group Plc, Huawei Investment & Holding Co Ltd, AT&T Inc, Nokia Corp, and Verizon Communications Inc, among others.
Buy the Full Report for More Insights about the IoT Market Players, Download a Free Sample Report
Key Segments Covered in this Report
GlobalData Plc has segmented the Internet of Things (IoT) market report by end-user, product, vertical, enterprise size, consumer product, and region:
Internet of Things Market End-User Outlook (Revenue, $Million, 2019-2027)
- Consumer IoT
- Enterprise IoT
Internet of Things Market Product Outlook (Revenue, $Million, 2019-2027)
- IoT Hardware
- IoT Software
- IoT Services
Internet of Things Market Vertical Outlook (Revenue, $Million, 2019-2027)
- Government
- Utilities
- Manufacturing
- Transport and Logistics
- Energy
- Insurance
- Construction
- Retail
- Healthcare
- Others
Internet of Things Market Enterprise Size Outlook (Revenue, $Million, 2019-2027)
- Micro (Less than 50)
- Small (51-250)
- Medium (251-1000)
- Large (1001-4999)
- Very Large (5000+)
Internet of Things Market Consumer Product Outlook (Revenue, $Million, 2019-2027)
- Automated Home
- Connected Car
- Wearables
Internet of Things Regional Outlook (Revenue, $Million, 2019-2027)
- North America
- US
- Canada
- Mexico
- Europe
- Germany
- UK
- Italy
- France
- Spain
- The Netherlands
- Rest of Europe
- Asia Pacific
- China
- Japan
- India
- Australia
- Singapore
- South Korea
- Rest of Asia Pacific
- South & Central America
- Brazil
- Argentina
- Rest of South & Central America
- Middle East & Africa
- United Arab Emirates (UAE)
- Kingdom of Saudi Arabia (KSA)
- South Africa
- Rest of Middle East & Africa
Scope
This report provides overview and service addressable market for Internet of Things.
It identifies the key trends impacting growth of the market over the next 12 to 24 months.
It includes global market forecasts for the Internet of Things industry and analysis of patents, company filings, and hiring trends.
It contains details of M&A and VF deals in the Internet of Things space.
The detailed value chain consists of five main aspects: IoT Device layer, IoT Connectivity layer, IoT Data layer, IoT Services layer, and IoT App layer
Key Highlights
The global Internet of Things (IoT) market size revenue was valued at $969.6 billion in 2023 and is expected to grow at a compound annual growth rate (CAGR) of 15.8% during 2023-2027. The adoption of IoT is poised to receive significant support from the rise of artificial intelligence of things (AIoT), driven primarily by advancements such as ChatGPT, the growing acceptance of smart cities, and progress in connectivity technologies such as LoRaWAN, Sigfox, and Zigbee.
Reasons to Buy
This market intelligence report offers a thorough, forward-looking analysis of the global Internet of things market, product type, key vendor outlook, and key opportunities in a concise format to help executives build proactive and profitable growth strategies.
Accompanying GlobalData’s Forecast products, the report examines the assumptions and drivers behind ongoing and upcoming trends in Internet of Things markets.
With more than 20 charts and tables, the report is designed for an executive-level audience, boasting presentation quality.
The report provides an easily digestible market assessment for decision-makers built around in-depth information gathered from local market players, which enables executives to quickly get up to speed with the current and emerging trends in Internet of Things markets.
The broad perspective of the report coupled with comprehensive, actionable detail will help Internet of Things players, investors, and other stakeholders succeed in the growing Internet of Things market globally.
Key Players
Microsoft CorpAlphabet Inc
Samsung Electronics Co Ltd
Intel Corp
Qualcomm Inc
Apple Inc
International Business Machines Corp
Amazon.com Inc
Cisco Systems Inc
Salesforce Inc
Table of Contents
Table
Figures
Frequently asked questions
-
What was the Internet of Things market size in 2023?
The IoT market size was valued at $969.6 billion in 2023.
-
What is the Internet of Things market growth rate?
The IoT market is expected to grow at a CAGR of more than 15% during the forecast period.
-
What is the key Internet of Things market driver?
The amalgamation of artificial intelligence (AI) and the Internet of Things (IoT) is significantly impacting technology landscapes.
-
Which was the leading end-user segment of the Internet of Things market in 2023?
The enterprise IoT segment led the IoT market in 2023.
-
Which was the dominant product type of the Internet of Things market in 2023?
IoT hardware was the dominant product type of the IoT market in 2023.
-
Which vertical dominated the IoT market in 2023?
The government sector was the leading adopter of the IoT market in 2023.
-
Which region accommodated the highest share of the IoT market in 2023?
Asia-Pacific was the leading regional segment of the IoT market in 2023.
-
Which enterprise size segment was leading the Internet of Things market in 2023?
Very large enterprises accounted for the highest share of the IoT market in 2023.
-
Which consumer products segment held the largest IoT market share in 2023?
The automated homes segment held the largest IoT market share in 2023.
-
Which are the leading Internet of Things companies?
The leading IoT companies are Microsoft Corp, Alphabet Inc, International Business Machines Corp, and Samsung Electronics Co Ltd among others.
-
Is there a third level of segmentation in the report?
GlobalData’s focus is on providing reliable and accurate data that is supported by robust research methodology. Our reports undergo rigorous quality checks and are based on primary and secondary research sources, ensuring that the numbers and insights provided are trustworthy. However, despite the best efforts to gather comprehensive data, there could be instances where the available data is limited, making it challenging to provide third-level segmentation. In such cases, GlobalData may choose to provide high-level insights and general trends rather than forcing segmentation that may not be backed by sufficient data. This approach ensures that the report’s overall quality and credibility are maintained.
Get in touch to find out about multi-purchase discounts
reportstore@globaldata.com
Tel +44 20 7947 2745
Every customer’s requirement is unique. With over 220,000 construction projects tracked, we can create a tailored dataset for you based on the types of projects you are looking for. Please get in touch with your specific requirements and we can send you a quote.
Sample Report
We are confident about Internet of Things (IoT) Market Trends and Analysis by End-User, Product, Enterprise Size, Vertical, Region, and Segment Forecast to 2027 report's unique quality. However, we want you to make the most beneficial decision for your business, so we offer free sample pages to help you:
- Assess the relevance of the report
- Evaluate the quality of the report
- Justify the cost
Download your copy of the sample report and make an informed decision about whether the full report will provide you with the insights and information you need.