LNG Liquefaction Terminals Capacity and Capital Expenditure Forecast by Region, Key Countries, Companies and Projects, 2023-2027

Powered by

All the vital news, analysis, and commentary curated by our industry experts.

LNG Liquefaction Terminals Report Overview

The global liquefied natural gas (LNG) liquefaction capacity was 487.3 million tons per annum (mtpa) in 2022. North America is likely to lead the global LNG liquefaction capacity by 2027 with the US leading globally in terms of liquefaction capacity additions, followed by Russia and Qatar.

The LNG liquefaction terminals capacity and capital expenditure market research report provides historical LNG liquefaction capacities data from 2017 to 2022, outlook up to 2027. The report will help to obtain the most up-to-date information available on the LNG liquefaction projects globally and identify growth segments and opportunities in the global LNG industry. This will facilitate decision-making based on strong historical and outlook of LNG liquefaction capacity data.

Market Size, 2022(million tons per annum) 487.3 mtpa
Key Regions ·       North America

·       Asia

·       Europe

·       Africa

·       Middle East

·       Oceania

·       South America

·       Former Soviet Union

·       Caribbean

Key Countries ·       The US

·       Russia

·       Qatar

·       Canada

·       Mexico

·       Australia

·       Iran

Key Companies ·       Novatek

·        QatarEnergy

·        Venture Global Partners LLC

·        Tellurian Investments Inc

·        Sempra

Enquire & Decide Discover the perfect solution for your business needs. Enquire now and let us help you make an informed decision before making a purchase.

LNG Liquefaction Market Segmentation by Regions

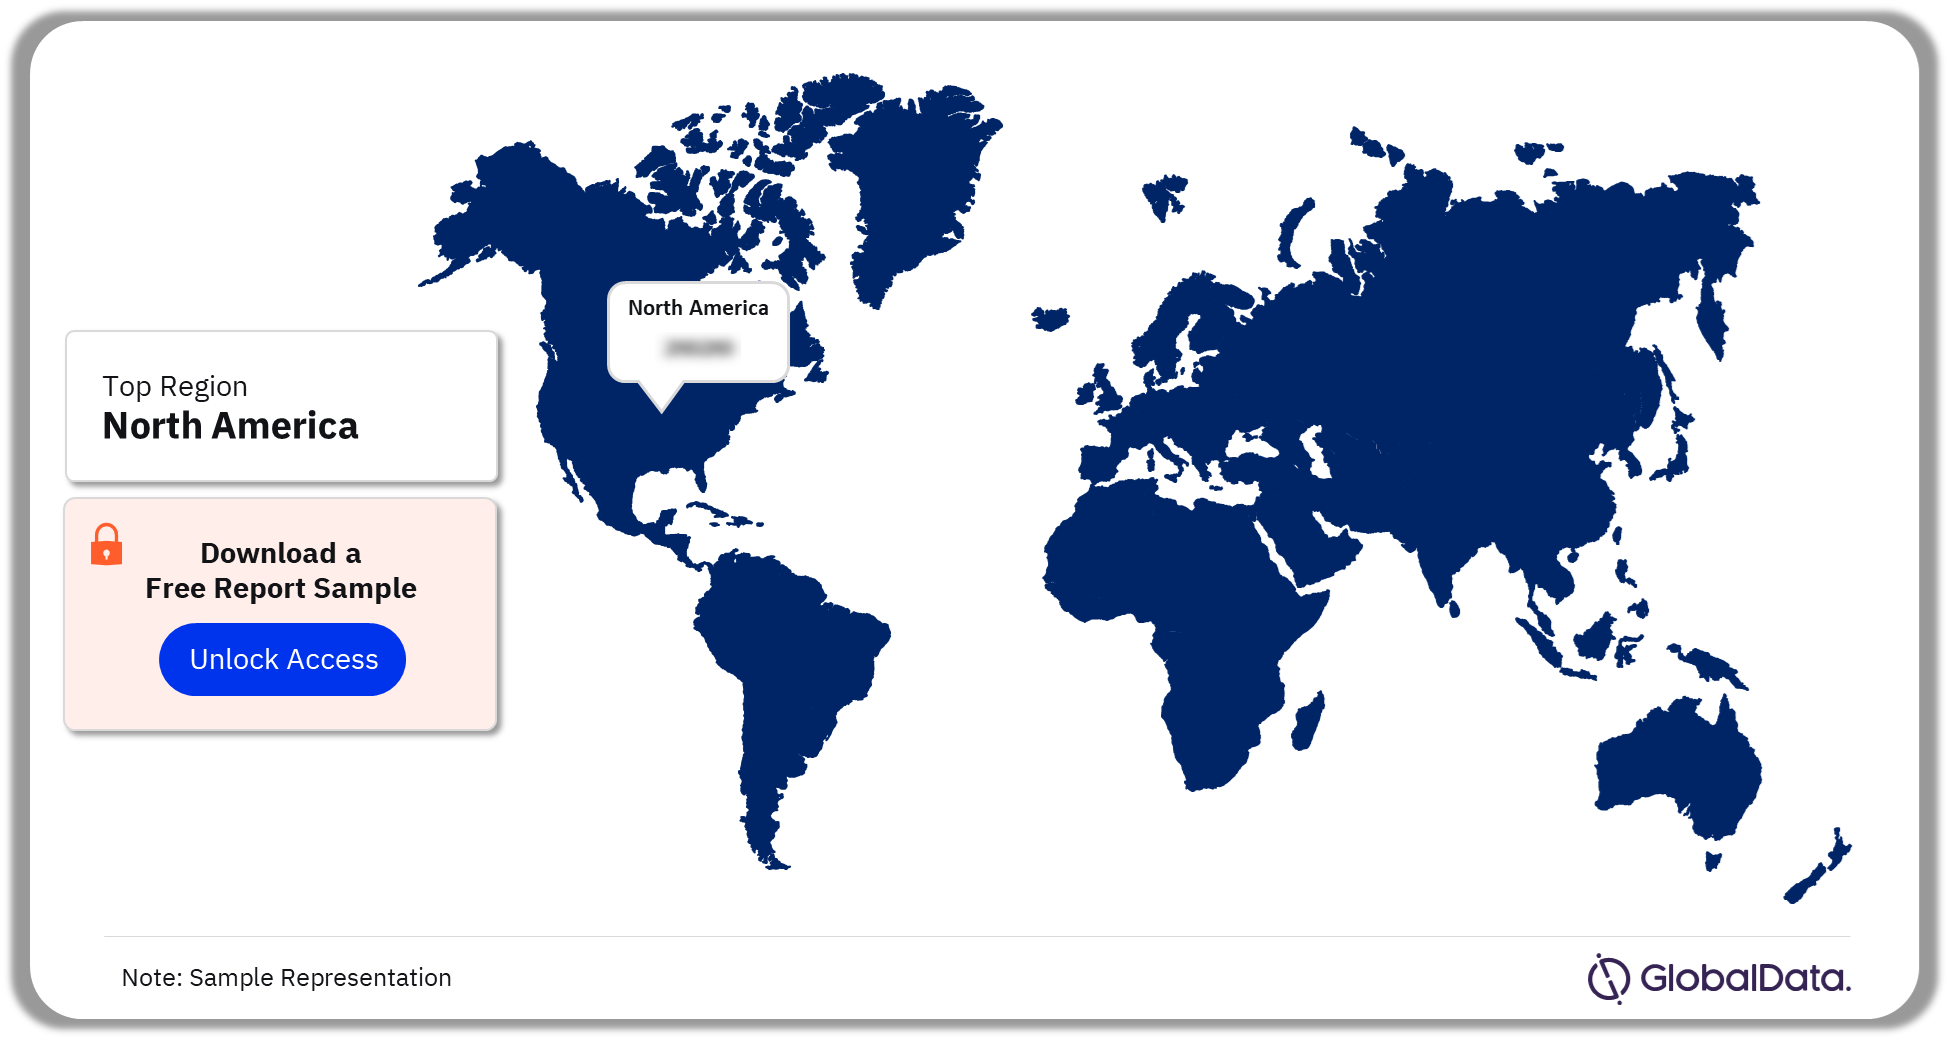
The key regions in the global LNG liquefaction market are Asia, Europe, Africa, the Middle East, North America, Oceania, South America, the Former Soviet Union, and the Caribbean. North America leads the global LNG liquefaction market in 2022. The market in North America is led by the US.

New projects are announced in the US. For instance, Grand Isle Floating is an announced offshore LNG liquefaction terminal proposed in Louisiana, US. To be owned and operated by Grand Isle LNG Holding Co LLC, the terminal is expected to commence operations in 2026.

Global LNG Liquefaction Market Analysis, by Regions, 2022 (%)

Global LNG Liquefaction Market Analysis, by Regions, 2022 (%)

For more regional insights into the global LNG liquefaction market, download a free report sample

LNG Liquefaction Market Segmentation, by Countries

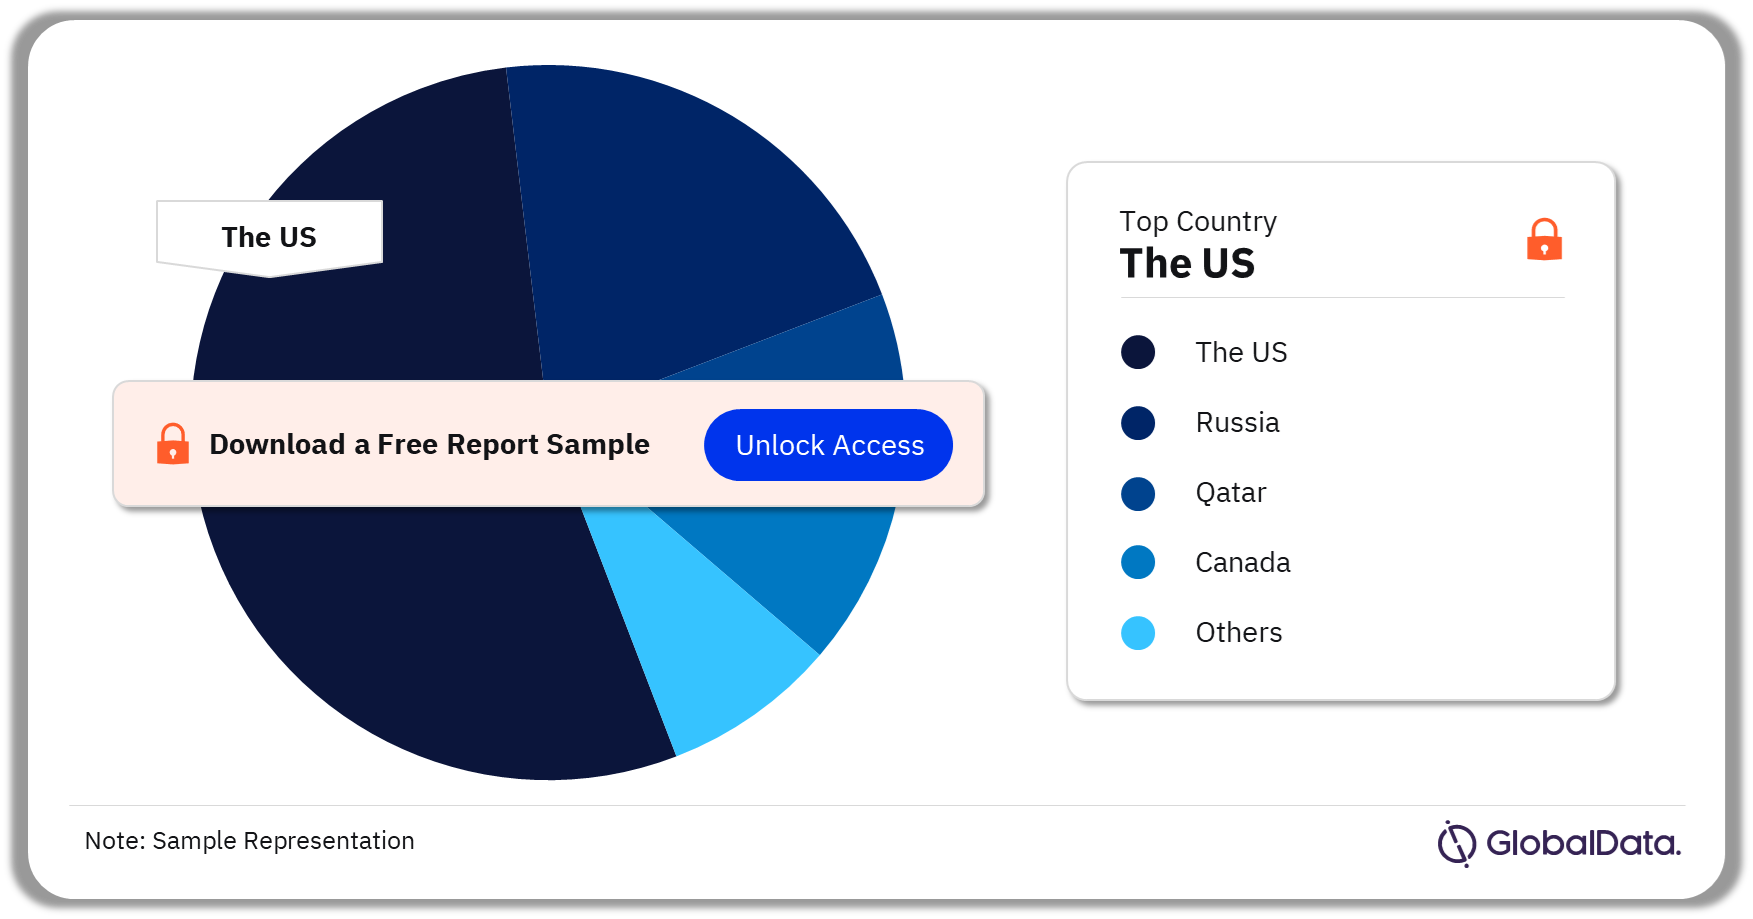
The key countries in the global LNG liquefaction market are the US, Russia, Qatar, Canada, Mexico, Australia, and Iran. The US leads among all the countries with the highest capacity additions in 2022.

Global LNG Liquefaction Market Analysis, By Countries, 2022 (%)

Global LNG Liquefaction Market Analysis, By Countries, 2022 (%)

For more regional insights into the global LNG liquefaction market, download a free report sample

Competitive Landscape - LNG Liquefaction Market

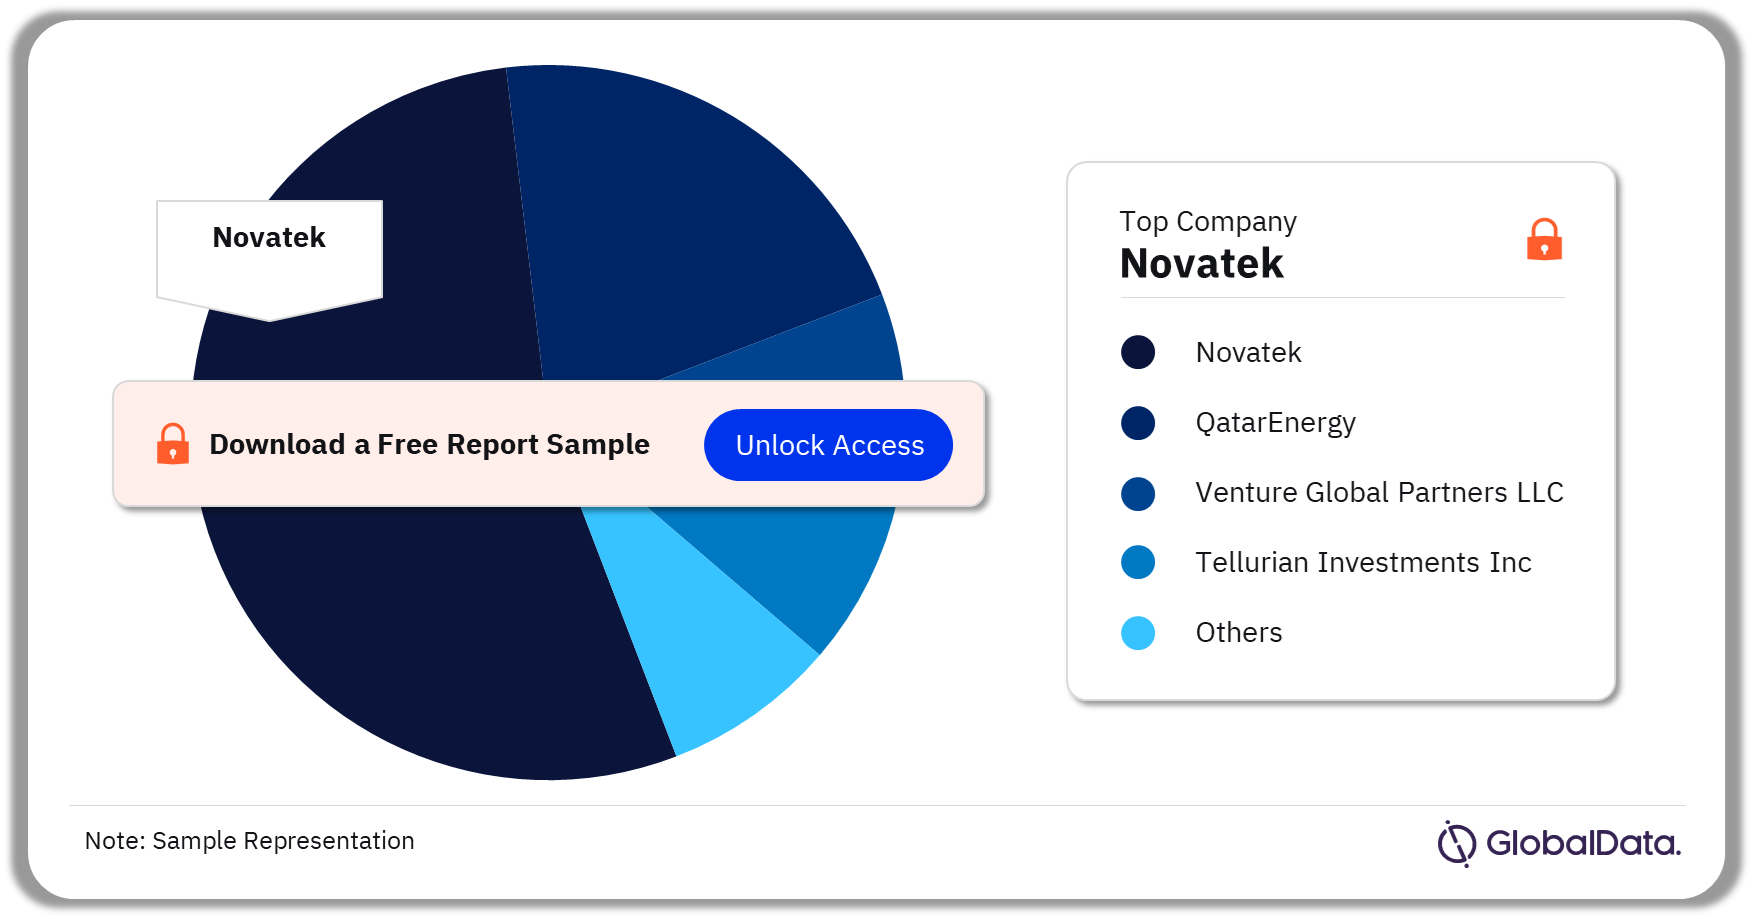
The key companies in the global LNG liquefaction market are Novatek, QatarEnergy, Venture Global Partners LLC, Tellurian Investments Inc, and Sempra among others. Among companies, Novatek leads in terms of total capex on new-build and expansion liquefaction projects during 2023–2027. It is followed by QatarEnergy and Venture Global Partners LLC.

Global LNG Liquefaction Market Analysis, By Companies, 2023-2027 (%)

Global LNG Liquefaction Market Analysis, By Companies, 2023-2027 (%)

To know more about companies in the global LNG liquefaction market, download a free report sample

Segments Covered in this Report

LNG Liquefaction Market Regional Outlook (2017-2027)

  • Asia
  • Europe
  • Africa
  • Middle East
  • North America
  • Oceania
  • South America
  • Former Soviet Union
  • Caribbean

LNG Liquefaction Market Countries Outlook (2017-2027)

  • US
  • Russia
  • Qatar
  • Canada
  • Mexico
  • Australia
  • Iran

Scope

  • Historical LNG liquefaction capacities data from 2017 to 2022, outlook up to 2027
  • New build and expansion LNG liquefaction capacity additions by key countries
  • New build and expansion capital expenditure outlook by key countries and companies globally
  • Total capex of new build and expansion LNG liquefaction projects by region, key countries, and companies
  • Details of major planned and announced LNG liquefaction projects globally up to 2027.

Reasons to Buy

  • Obtain the most up to date information available on the LNG liquefaction projects globally.
  • Identify growth segments and opportunities in the global LNG industry.
  • Facilitate decision making based on strong historical and outlook of LNG liquefaction capacity data.
  • Develop business strategies with the help of specific insights about LNG liquefaction projects globally.
  • Keep abreast of key planned and announced LNG liquefaction projects globally.
  • Assess your competitor’s planned and announced LNG liquefaction projects and capacities.

Table of Contents

  • 1. Global LNG Liquefaction Industry Outlook to 2027

    • 1.1. Key Highlights

  • 2. Key Projects Announcements and Cancelations

    • 2.1. Key Project Announcements
    • 2.2. Project Cancelations
    • 2.3. Stalled Projects

  • 3. Global LNG Liquefaction Capacity and Capex Outlook

    • 3.1. Total LNG Liquefaction Capacity by Region
    • 3.2. Global New Build and Expansion Capacity Outlook by Key Countries
    • 3.3. Global New Build and Expansion Liquefaction Capex Outlook by Region
    • 3.4. Global New Build and Expansion Liquefaction Capex Outlook by Key Countries
    • 3.5. Global New Build and Expansion Liquefaction Capex Outlook by Key Companies

  • 4. Regional Capex Outlook by Country and Company

    • 4.1. Africa – New Build and Expansion Capex Outlook of Liquefaction Terminals by Key Countries
    • 4.2. Africa – New Build and Expansion Capex Outlook of Liquefaction Terminals by Key Companies
    • 4.3. Asia – New Build and Expansion Capex Outlook of Liquefaction Terminals by Key Countries
    • 4.4. Asia – New Build Capex on Planned and Announced Hydrogen Pipelines by Key Companies
    • 4.5. FSU – New Build and Expansion Capex Outlook of Liquefaction Terminals by Key Countries
    • 4.6. FSU – New Build and Expansion Capex Outlook of Liquefaction Terminals by Key Companies
    • 4.7. Middle East – New Build and Expansion Capex Outlook of Liquefaction Terminals by Key Companies
    • 4.8. Middle East – New Build and Expansion Capex Outlook of the Liquefaction Terminals by Key Companies
    • 4.9. North America – New Build and Expansion Capex Outlook of Liquefaction Terminals by Key Countries
    • 4.10. North America – New Build and Expansion Capex Outlook of Liquefaction Terminals by Key Companies
    • 4.11. Oceania – New Build and Expansion Capex Outlook of Liquefaction Terminals by Key Countries
    • 4.12. Oceania – New Build and Expansion Capex Outlook of Liquefaction Terminals by Key Companies
    • 4.13. South America – New Build and Expansion Capex Outlook of Liquefaction Terminals by Key Countries
    • 4.14. South America – New Build and Expansion Capex Outlook of Liquefaction Terminals by Key Companies

  • 5. Global Planned and Announced LNG Liquefaction Terminals
  • 6. Appendix

    • 6.1. Abbreviations
    • 6.2. Important Definitions
    • 6.3. Market Definition
    • 6.4. Methodology

  • 7. Coverage
  • 8. Secondary Research
  • 9. About GlobalData
  • 10. Contact Us

Table

Table 1: Total LNG liquefaction capacity by region, 2017–2027 (mtpa) 9

Table 2: Global new build and expansion LNG liquefaction capacity by key countries, 2023–2027 (mtpa) 10

Table 3: Global new build and expansion liquefaction capex outlook by region, 2023–2027 ($M)* 11

Table 4: Global new build and expansion liquefaction capex outlook by key countries, 2023–2027 ($M) * 12

Table 5: Global new build and expansion liquefaction capex outlook by key companies, 2023–2027 ($M)* 13

Table 6: New build and expansion capex outlook of Africa’s liquefaction terminals by key countries, 2023–2027 ($M)* 14

Table 7: New build and expansion capex outlook of Africa’s liquefaction terminals by key companies, 2023–2027 ($M)* 15

Table 8: New build and expansion capex outlook of Asia’s liquefaction terminals by country, 2023–2027 ($M)* 16

Table 9: New build and expansion capex outlook of Asia’s liquefaction terminals by key companies, 2023–2027 ($M)* 17

Table 10: New build and expansion capex outlook of FSU’s liquefaction terminals by country, 2023–2027 ($B)* 18

Table 11: New build and expansion capex outlook of FSU’s liquefaction terminals by key companies, 2023–2027 ($M)* 19

Table 12: New build and expansion capex outlook of the Middle East’s liquefaction terminals by country, 2023–2027 ($M)* 20

Table 13: New build and expansion capex outlook of the Middle East’s liquefaction terminals by key companies, 2023–2027 ($M) 21

Table 14: New build and expansion capex outlook of North America’s liquefaction terminals by country, 2023–2027 ($M)* 22

Table 15: New build and expansion capex outlook of North America’s liquefaction terminals by key companies, 2023–2027 ($M) 23

Table 16: New build and expansion capex outlook of Oceania’s liquefaction terminals by country, 2023–2027 ($M)* 24

Table 17: New build and expansion capex outlook of Oceania’s liquefaction terminals by key companies, 2023–2027 ($M)* 25

Table 18: New build capex outlook of South America’s liquefaction terminals by country, 2023–2027 ($M)* 26

Table 19: New build capex outlook of South America’s liquefaction terminals by key companies, 2023–2027 ($M)* 27

Table 20: Global planned and announced (new-build) liquefaction terminals, 2023–2027 28

Figures

Figure 1: Total LNG liquefaction capacity by region, 2017–2027 (mtpa) 9

Figure 2: Global new build and expansion LNG liquefaction capacity by key countries, 2023–2027 (mtpa) 10

Figure 3: Global new build and expansion liquefaction capex outlook by region, 2023–2027 ($M)* 11

Figure 4: Global new build and expansion liquefaction capex outlook by key countries, 2023–2027 ($M) 12

Figure 5: Global new build and expansion liquefaction capex outlook by key companies, 2023–2027 ($M) 13

Figure 6: New build and expansion capex outlook of Africa’s liquefaction terminals by key countries, 2023–2027 ($M) 14

Figure 7: New build and expansion capex outlook of Africa’s liquefaction terminals by key companies, 2023–2027 ($M) 15

Figure 8: New build and expansion capex outlook of Asia’s liquefaction terminals by country, 2023–2027 ($M) 16

Figure 9: New build and expansion capex outlook of Asia’s liquefaction terminals by key companies, 2023–2027 ($M) 17

Figure 10: New build and expansion capex outlook of FSU’s liquefaction terminals by country, 2023–2027 ($B) 18

Figure 11: New build and expansion capex outlook of FSU’s liquefaction terminals by key companies, 2023–2027 ($M) 19

Figure 12: New build and expansion capex outlook of the Middle East’s liquefaction terminals by country, during 2023–2027 ($M) 20

Figure 13: New build and expansion capex outlook of the Middle East’s liquefaction terminals by key companies, 2023–2027 ($M) 21

Figure 14: New build and expansion capex outlook of North America’s liquefaction terminals by country, 2023–2027 ($M) 22

Figure 15: New build and expansion capex outlook of North America’s liquefaction terminals by key companies, 2023–2027 ($M) 23

Figure 16: New build and expansion capex outlook of Oceania’s liquefaction terminals by country, 2023–2027 ($M) 24

Figure 17: New build and expansion capex outlook of Oceania’s liquefaction terminals by key companies, 2023–2027 ($M) 25

Figure 18: New build capex outlook of South America’s liquefaction terminals by country, 2023–2027 ($M)* 26

Figure 19: New build capex outlook of South America’s liquefaction terminals by key companies, 2023–2027 ($M)* 27

Frequently asked questions

LNG Liquefaction Terminals Capacity and Capital Expenditure Forecast by Region, Key Countries, Companies and Projects, 2023-2027 standard reports
Currency USD
$3,000

Can be used by individual purchaser only

$9,000

Can be shared globally by unlimited users within the purchasing corporation e.g. all employees of a single company


Undecided about purchasing this report?

Enquire Before Buying Request a Free Sample

Get in touch to find out about multi-purchase discounts

reportstore@globaldata.com
Tel +44 20 7947 2745

Every customer’s requirement is unique. With over 220,000 construction projects tracked, we can create a tailored dataset for you based on the types of projects you are looking for. Please get in touch with your specific requirements and we can send you a quote.

Sample Report

LNG Liquefaction Terminals Capacity and Capital Expenditure Forecast by Region, Key Countries, Companies and Projects, 2023-2027 was curated by the best experts in the industry and we are confident about its unique quality. However, we want you to make the most beneficial decision for your business, so we offer free sample pages to help you:

  • Assess the relevance of the report
  • Evaluate the quality of the report
  • Justify the cost

Download your copy of the sample report and make an informed decision about whether the full report will provide you with the insights and information you need.

Below is a sample report to understand what you are buying

See what our customers are saying

“The GlobalData platform is our go-to tool for intelligence services. GlobalData provides an easy way to access comprehensive intelligence data around multiple sectors, which essentially makes it a one-for-all intelligence platform, for tendering and approaching customers.

GlobalData is very customer orientated, with a high degree of personalised services, which benefits everyday use. The highly detailed project intelligence and forecast reports can be utilised across multiple departments and workflow scopes, from operational to strategic level, and often support strategic decisions. GlobalData Analytics and visualisation solutions has contributed positively when preparing management presentations and strategic papers.”

Business Intelligence & Marketing Manager, SAL Heavy Lift

“COVID-19 has caused significant interference to our business and the COVID-19 intelligence from GlobalData has helped us reach better decisions around strategy. These two highlights have helped enormously to understand the projections into the future concerning our business units, we also utilise the project database to source new projects for Liebherr-Werk to use as an additional source to pitch for new business.”

Market Analyst & Management, Liebherr-Werk

Your daily news has saved me a lot of time and keeps me up-to-date with what is happening in the market, I like that you almost always have a link to the source origin. We also use your market data in our Strategic Business Process to support our business decisions. By having everything in one place on the Intelligence Center it has saved me a lot of time versus looking on different sources, the alert function also helps with this.

Head of Key Accounts, Saab AB

Having used several other market research companies, I find that GlobalData manages to provide that ‘difficult-to-get’ market data that others can’t, as well as very diverse and complete consumer surveys.

Marketing Intelligence Manager, Portugal Foods

Our experience with GlobalData has been very good, from the platform itself to the people. I find that the analysts and the account team have a high level of customer focus and responsiveness and therefore I can always rely on. The platform is more holistic than other providers. It is convenient and almost like a one stop shop. The pricing suite is highly competitive and value for our organisation.

I like reports that inform new segments such as the analysis on generation Z, millennials, the impact of COVID 19 to our banking customers and their new channel habits. Secondly the specialist insight on affluent sector significantly increases our understanding about this group of customers. The combination of those give us depth and breadth of the evolving market.

I’m in the business of answering and helping people make decisions so with the intelligence center I can do that, effectively and efficiently. I can share quickly key insights that answer and satisfy our country stakeholders by giving them many quality studies and primary research about competitive landscape beyond the outlook of our bank. It helps me be seen as an advisory partner and that makes a big difference. A big benefit of our subscription is that no one holds the whole data and because it allows so many people, so many different parts of our organisation have access, it enables all teams to have the same level of knowledge and decision support.

Head of Customer Insight and Research, Standard Chartered

“I know that I can always rely on Globaldata’s work when I’m searching for the right consumer and market insights. I use Globaldata insights to understand the changing market & consumer landscape and help create better taste & wellbeing solutions for our customers in food, beverage and healthcare industries.

Globaldata has the right data and the reports are of very high quality compared to your competitors. Globaldata not only has overall market sizes & consumer insights on food & beverages but also provides insights at the ingredient & flavour level. That is key for B2B companies like Givaudan. This way we understand our customers’ business and also gain insight to our unique industry”

Head of Consumer Sensory Insights, Givaudan

GlobalData provides a great range of information and reports on various sectors that is highly relevant, timely, easy to access and utilise.  The reports and data dashboards help engagement with clients; they provide valuable industry and market insights that can enrich client conversations and can help in the shaping of value propositions. Moreover, using GlobalData products has helped increase my knowledge of the finance sector, the players within it, and the general threats and opportunities.

I find the consumer surveys that are carried out to be extremely beneficial and not something I have seen anywhere else. They provided an insightful view of why and which consumers take (or don’t) particular financial products. This can help shape conversations with clients to ensure they make the right strategic decisions for their business.

One of the challenges I have found is that data in the payments space is often piecemeal. With GD all of the data I need is in one place, but it also comes with additional market reports that provide useful extra context and information. Having the ability to set-up alerts on relevant movements in the industry, be it competitors or customers, and have them emailed directly to me, ensures I get early sight of industry activity and don’t have to search for news.

Senior Account Manager, TSYS
Go even deeper with GlobalData Intelligence Center

Every Company Report we produce is powered by the GlobalData Intelligence Center.

Subscribing to our intelligence platform means you can monitor developments at LNG Liquefaction Terminals Capacity and Capital Expenditure Forecast by Region, Key Countries, Companies and Projects, 2023-2027 in real time.

  • Access a live LNG Liquefaction Terminals Capacity and Capital Expenditure Forecast by Region, Key Countries, Companies and Projects, 2023-2027 dashboard for 12 months, with up-to-the-minute insights.
  • Fuel your decision making with real-time deal coverage and media activity.
  • Turn insights on financials, deals, products and pipelines into powerful agents of commercial advantage.