LNG Regasification Market Size and Forecast by Region, Trade Movements and Price 2021-2025

Powered by

All the vital news, analysis, and commentary curated by our industry experts.

The global regasification capacity in 2020 was 46,458 bcf (billion cubic feet) and is forecast to record an AAGR of more than 4% during 20212025. Asia represented the largest region for the global LNG regasification market, in 2020, followed by North America and Europe.

Japan, the US, South Korea, China, and Spain are the major countries that accounted for over 60% of the total regasification capacity of the world in 2020. Incheon (South Korea), Pyeongtaek (South Korea), and Sodegaura (Japan) are the largest regasification terminals globally.

Global LNG regasification market overview

Global LNG regasification market overview

For more insights on this report, download the free report sample

What are the segments in the LNG regasification market?

The LNG regasification market is segmented into planned projects and announced projects for each region and for the key countries. Among regions, Asia leads with the largest capacity additions for the new-build and expansion of the existing LNG regasification projects by 2025. Europe and Africa follow next for the new-build projects by 2025.

Among the countries, China leads with the largest capacity additions, through new-build and expansion for regasification terminals.

Global LNG regasification market, by segments

Global LNG regasification market, by segments

For more insights, download the free report sample

What are the top regions and countries for the LNG regasification market?

Asia represented the largest region for the global LNG regasification market, in 2020, followed by North America and Europe. Japan, the US, South Korea, China, and Spain are the major countries globally that accounted for over 60% of the total regasification capacity of the world in 2020. Incheon (South Korea), Pyeongtaek (South Korea) and Sodegaura (Japan) are the largest regasification terminals in the world.

Global LNG regasification market, by region

Global LNG regasification market, by region

For more regional insights, download the free report sample

Which are the key companies in the LNG regasification market?

Some of the key companies from the top planned and announced regasification terminals include Desfa SA, Caofeidian Xintian LNG Co Ltd, Korea Gas Corp, Yantai LNG Group, and PTT Public Co Ltd.

Global LNG regasification market, by key companies

Global LNG regasification market, by key companies

To know more about key companies, download the free report sample

Market report scope

Market size (Year – 2020) 46,458 bcf (billion Cubic Feet)
Growth rate AAGR of >4% from 2021 to 2025
Base year for estimation 2020
Market segmentation Planned projects, announced projects
Regional coverage Africa, Asia, Caribbean, Europe, Former Soviet Union, Middle East, North America, Oceania, and South America.
Forecast period 2021-2025
Key companies Desfa SA, Caofeidian Xintian LNG Co Ltd, Korea Gas Corp, Yantai LNG Group, and PTT Public Co Ltd.

The report provides updated information on all active, planned, and announced LNG Market terminals globally with start year up to 2025.

What else is contained:

  • Provides capacity data by liquefaction and regasification terminals from 2015 to 2020, outlook up to 2025.
  • Provides key details such as terminal name, operator name, terminal status for all active, planned, and announced LNG terminals globally.
  • Provides capital expenditure outlook at global as well as regional level by year and by key countries for planned and announced (new-build) LNG terminals till 2025.
  • Latest developments and contracts related to LNG terminals, wherever available.

Reasons to Buy

  • Obtain the most up-to-date information available on active, planned, and announced regasification terminals globally.
  • Identify growth segments and opportunities in the industry.
  • Facilitate decision-making on the basis of strong historic and outlook of capacity data.
  • Assess key regasification terminals data of your competitors.

Table of Contents

| About GlobalData 2

1. Introduction 12

1.1. What is this Report About? 12

1.2. Market Definition 12

2. Global LNG Regasification Industry 13

2.1. Global LNG Regasification Industry, Snapshot 13

2.2. Global LNG Regasification Industry, Regional Comparisons 15

2.3. Global LNG Regasification Industry, Trade Movements and Price 18

2.4. Global LNG Regasification Industry, Planned and Announced Regasification Capacity 21

2.5. Global LNG Regasification Industry, New Regasification Terminals and Capacity Expansions by Region 24

3. Africa LNG Regasification Industry 26

3.1. Africa LNG Regasification Industry, Overview of LNG Regasification Terminals Data 26

3.2. Africa LNG Regasification Industry, Country Comparisons 28

3.3. Africa LNG Regasification Industry, Planned and Announced Regasification Terminals 29

3.4. Africa LNG Regasification Industry, New Regasification Terminals and Capacity Expansions by Country 32

3.5. Africa LNG Regasification Industry, Capacity by Country 33

4. Asia LNG Regasification Industry 35

4.1. Asia LNG Regasification Industry, Overview of LNG Regasification Terminals Data 35

4.2. Asia LNG Regasification Industry, Country Comparisons 37

4.3. Asia LNG Regasification Industry, Planned and Announced Regasification Terminals 38

4.4. Asia LNG Regasification Industry, New Regasification Terminals and Capacity Expansions by Country 44

4.5. Asia LNG Regasification Industry, Capacity by Country 46

5. Caribbean LNG Regasification Industry 58

5.1. Caribbean LNG Regasification Industry, Overview of LNG Regasification Terminals Data 58

5.2. Caribbean LNG Regasification Industry, Country Comparisons 60

5.3. Caribbean LNG Regasification Industry, Annual New-Build Capital Expenditure Outlook for Regasification Terminals 61

5.4. Caribbean LNG Regasification Industry, Capacity by Country 63

6. Central America LNG Regasification Industry 65

6.1. Central America LNG Regasification Industry, Overview of Regasification LNG Terminals Data 65

6.2. Central America LNG Regasification Industry, Country Comparisons 67

6.3. Central America LNG Regasification Industry, Planned and Announced Regasification Terminals 68

6.4. Central America LNG Regasification Industry, New Regasification Terminals and Capacity Expansions by Country 71

6.5. Central America LNG Regasification Industry, Capacity by Country 72

7. Europe LNG Regasification Industry 73

7.1. Europe LNG Regasification Industry, Overview of LNG Regasification Terminals Data 73

7.2. Europe LNG Regasification Industry, Country Comparisons 75

7.3. Europe LNG Regasification Industry, Planned and Announced Regasification Terminals 76

7.4. Europe LNG Regasification Industry, New Regasification Terminals and Capacity Expansions by Country 79

7.5. Europe LNG Regasification Industry, Capacity by Country 81

8. Former Soviet Union LNG Regasification Industry 88

8.1. Former Soviet Union LNG Regasification Industry, Overview of LNG Regasification Terminals Data 88

8.2. Former Soviet Union LNG Regasification Industry, Country Comparisons 90

8.3. Former Soviet Union LNG Regasification Industry, Capacity by Country 91

9. Middle East LNG Regasification Industry 92

9.1. Middle East LNG Regasification Industry, Overview of LNG Regasification Terminals Data 92

9.2. Middle East LNG Regasification Industry, Country Comparisons 94

9.3. Middle East LNG Regasification Industry, Planned and Announced Regasification Terminals 95

9.4. Middle East LNG Regasification Industry, New Regasification Terminals and Capacity Expansions by Country 98

9.5. Middle East LNG Regasification Industry, Capacity by Country 99

10. North America LNG Regasification Industry 102

10.1. North America LNG Regasification Industry, Overview of LNG Regasification Terminals Data 102

10.2. North America LNG Regasification Industry, Country Comparisons 104

10.3. North America LNG Regasification Industry, Planned and Announced Regasification Terminals 105

10.4. North America LNG Regasification Industry, New Regasification Terminals by Country 108

10.5. North America LNG Regasification Industry, Capacity by Country 109

11. Oceania LNG Regasification Industry 111

11.1. Oceania LNG Regasification Industry, Capacity by Country, 2015–2025 111

11.2. Oceania LNG Regasification Industry, Planned and Announced Regasification Terminals 111

11.3. Oceania LNG Regasification Industry, New Regasification Terminals and Capacity Expansions by Country 114

11.4. Oceania LNG Regasification Industry, Capacity by Country 114

12. South America LNG Regasification Industry 115

12.1. South America LNG Regasification Industry, Overview of LNG Regasification Terminals Data 115

12.2. South America LNG Regasification Industry, Country Comparisons 117

12.3. South America LNG Regasification Industry, Planned and Announced Regasification Terminals 118

12.4. South America LNG Regasification Industry, New Regasification Terminals and Capacity Expansions by Country 121

12.5. South America LNG Regasification Industry, Capacity by Country 122

13. Global LNG Regasification Industry, Recent News and Contracts 125

13.1. Recent Developments 125

13.2. Recent Contracts 136

14. Appendix 144

14.1. Abbreviations 144

14.2. Important Definitions 144

14.3. Methodology 144

| Contact Us 146

Table

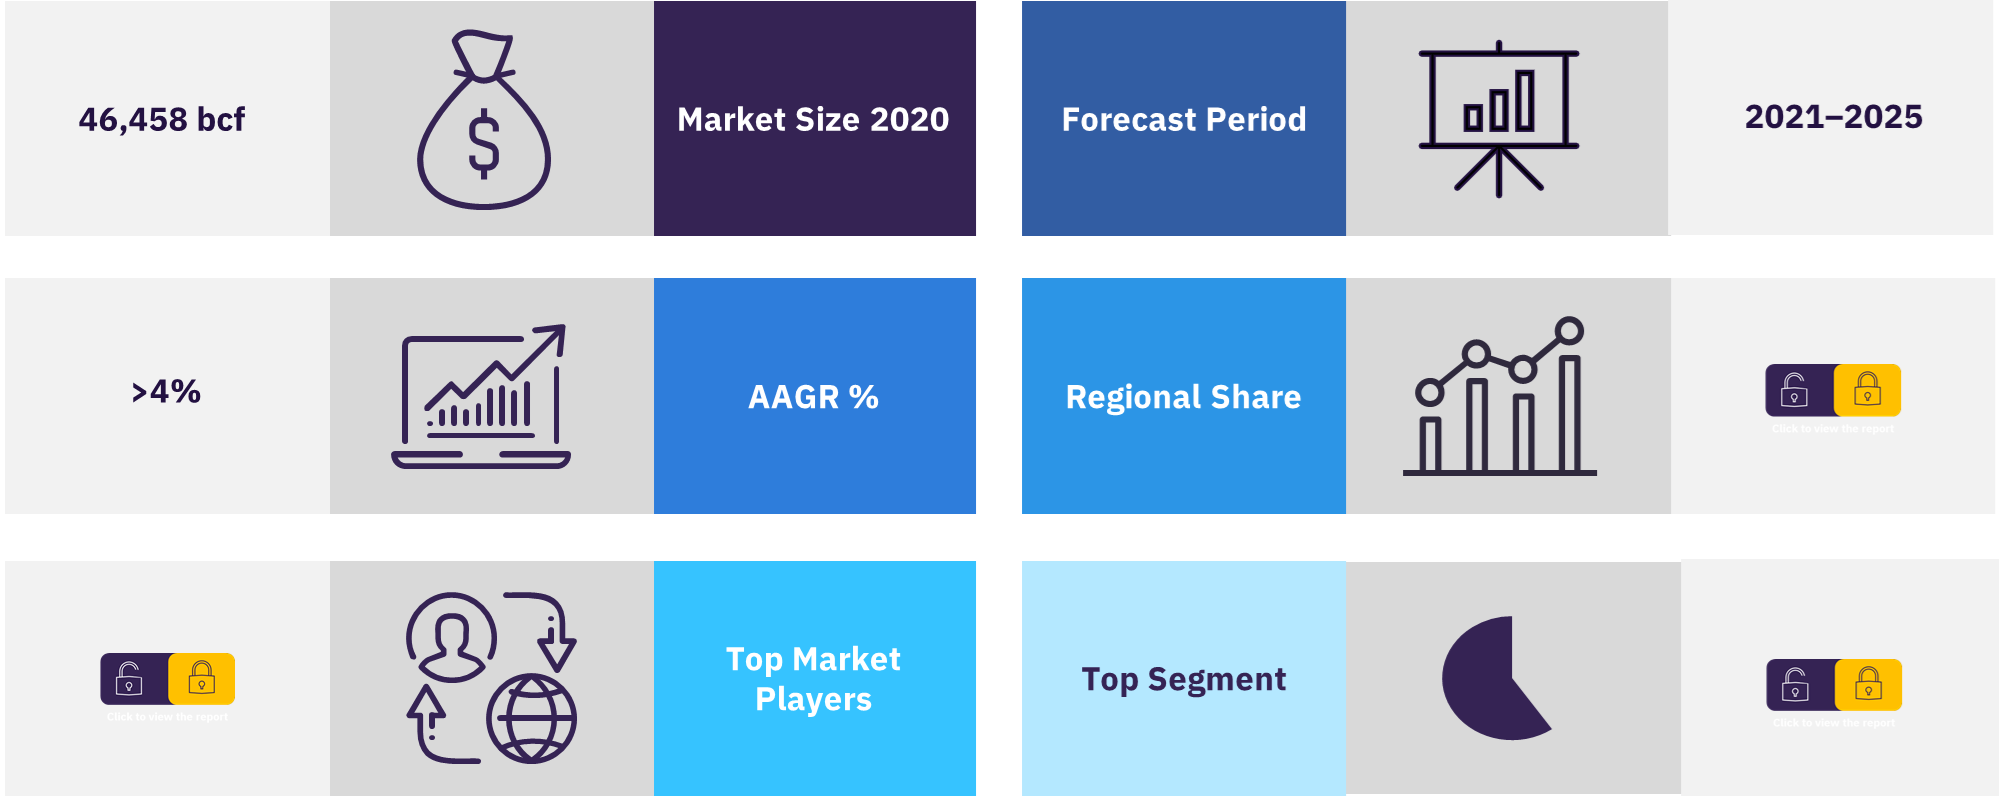
Table 1: LNG Regasification Industry, Global, Key Statistics, 2020 13

Table 2: LNG Regasification Industry, Global, Capacity by Key Countries (bcf), 2015-2025 14

Table 3: LNG Regasification Industry, Global, Contribution to Total Regasification Capacity by Region (%), 2020 15

Table 4: LNG Regasification Industry, Global, Capacity Growth by Region, 2015–2025* 16

Table 5: LNG Regasification Industry, Global, LNG Imports by Region (bcf), 2015–2020 17

Table 6: LNG Regasification Industry, Global, Top Five LNG Exporting Countries by Volume (mtpa), 2015–2020 18

Table 7: LNG Regasification Industry, Global, Top Five LNG Importing Countries by Volume (mtpa), 2015–2020 19

Table 8: LNG Regasification Industry, Global, Top Five LNG Importers by Average LNG Import Price (US$/Tonne), 2020 20

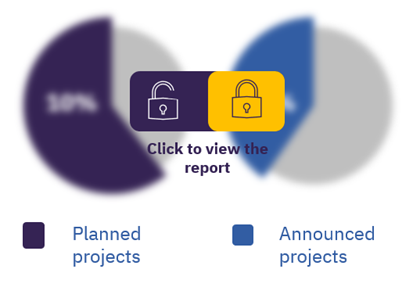
Table 9: LNG Regasification Industry, Global, Top 10 Planned and Announced Regasification Terminals, 2021–2025 21

Table 10: LNG Regasification Industry, Global, Annual New-Build and Expansion Capital Expenditure Outlook for Regasification Terminals (US$ bil), 2021–2025 22

Table 11: LNG Regasification Industry, Global, Annual New-Build and Expansion Capital Expenditure Outlook for Regasification Terminals by Key Countries (US$ mil), 2021–2025 23

Table 12: LNG Regasification Industry, Global, Regasification Capacity Additions Through New and Existing Terminal Expansions by Region (bcf), 2021–2025 24

Table 13: LNG Regasification Industry, Global, Regasification Capacity Additions Through New Terminals by Region (bcf), 2021–2025 24

Table 14: Global LNG Regasification Industry, Regasification Capacity Additions Through Existing Terminals Expansions by Region (bcf), 2021–2025 25

Table 15: LNG Regasification Industry, Africa, LNG Key Statistics, 2020 26

Table 16: LNG Regasification Industry, Africa, Capacity by Key Countries (bcf), 2015-2025 26

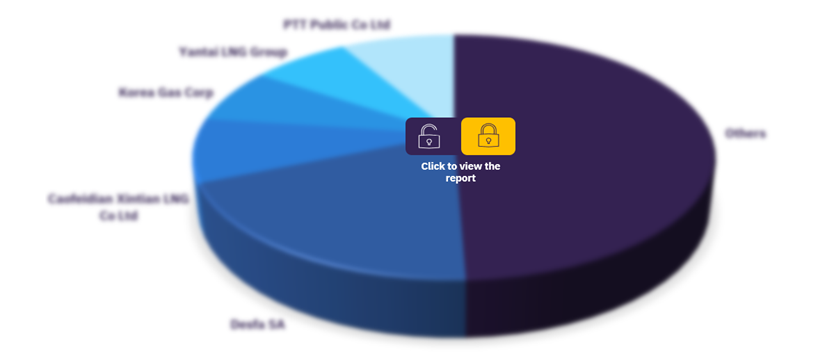
Table 17: LNG Regasification Industry, Africa, Contribution to Regional Regasification Capacity by Country (%), 2020 28

Table 18: LNG Regasification Industry, Africa, Planned and Announced Regasification Terminals, 2021–2025 29

Table 19: LNG Regasification Industry, Africa, Annual New-Build and Expansion Capital Expenditure Outlook for Regasification Terminals (US$ mil), 2021–2025 30

Table 20: LNG Regasification Industry, Africa, Annual New-Build and Expansion Capital Expenditure Outlook for Regasification Terminals by Country (US$ mil), 2021–2025 31

Table 21: LNG Regasification Industry, Africa, Capacity Additions Through New Terminals by Country (bcf), 2021–2025 32

Table 22:LNG Regasification Industry, Egypt, Regasification Capacity (bcf), 2015–2025 33

Table 23:LNG Regasification Industry, Morocco, Regasification Capacity (bcf), 2015–2025 33

Table 24:LNG Regasification Industry, Cote d’Ivoire, Regasification Capacity (bcf), 2015–2025 33

Table 25:LNG Regasification Industry, Ghana, Regasification Capacity (bcf), 2015–2025 34

Table 26:LNG Regasification Industry, Benin, Regasification Capacity (bcf), 2015–2025 34

Table 27:LNG Regasification Industry, Mozambique, Regasification Capacity (bcf), 2015–2025 34

Table 28: LNG Regasification Industry, Asia, LNG Key Statistics, 2020 35

Table 29: LNG Regasification Industry, Asia, Capacity by Key Countries (bcf), 2015-2025 36

Table 30: LNG Regasification Industry, Asia, Contribution to Regional Regasification Capacity by Country (%), 2020 37

Table 31: LNG Regasification Industry, Asia, Planned and Announced Regasification Terminals, 2021–2025 38

Table 32: LNG Regasification Industry, Asia, Annual New-Build and Expansion Capital Expenditure Outlook for Regasification Terminals (US$ mil), 2021–2025 42

Table 33: LNG Regasification Industry, Asia, Annual New-Build and Expansion Capital Expenditure Outlook for Regasification Terminals by Key Countries (US$ mil), 2021–2025 43

Table 34: LNG Regasification Industry, Asia, Capacity Additions Through New and Existing Terminal Expansions by Country (bcf), 2021–2025 44

Table 35: LNG Regasification Industry, Asia, Capacity Additions Through New Terminals by Country (bcf), 2021–2025 44

Table 36: Asia LNG Regasification Industry, Capacity Additions Through Existing Terminals Expansions by Country (bcf), 2021–2025 45

Table 37: LNG Regasification Industry, Japan, Regasification Capacity (bcf), 2015–2025 46

Table 38: LNG Regasification Industry, South Korea, Regasification Capacity (bcf), 2015–2025 48

Table 39: LNG Regasification Industry, China, Regasification Capacity (bcf), 2015–2025 49

Table 40: LNG Regasification Industry, India, Regasification Capacity (bcf), 2015–2025 51

Table 41: LNG Regasification Industry, Taiwan, Regasification Capacity (bcf), 2015–2025 52

Table 42: LNG Regasification Industry, Thailand, Regasification Capacity (bcf), 2015–2025 53

Table 43: LNG Regasification Industry, Singapore, Regasification Capacity (bcf), 2015–2025 53

Table 44: LNG Regasification Industry, Pakistan, Regasification Capacity (bcf), 2015–2025 53

Table 45: LNG Regasification Industry, Indonesia, Regasification Capacity (bcf), 2015–2025 54

Table 46: LNG Regasification Industry, Bangladesh, Regasification Capacity (bcf), 2015–2025 55

Table 47: LNG Regasification Industry, Malaysia, Regasification Capacity (bcf), 2015–2025 55

Table 48: LNG Regasification Industry, Myanmar, Regasification Capacity (bcf), 2015–2025 56

Table 49: LNG Regasification Industry, Vietnam, Regasification Capacity (bcf), 2015–2025 56

Table 50: LNG Regasification Industry, Sri Lanka, Regasification Capacity (bcf), 2015–2025 57

Table 51: LNG Regasification Industry, Philippines, Regasification Capacity (bcf), 2015–2025 57

Table 52: LNG Regasification Industry, Caribbean, LNG Key Statistics, 2020 58

Table 53: LNG Regasification Industry, Caribbean, Capacity by Key Countries (bcf), 2015-2025 58

Table 54: LNG Regasification Industry, Caribbean, Contribution to Regional Regasification Capacity by Country (%), 2020 60

Table 55: LNG Regasification Industry, Caribbean, Annual New-Build Capital Expenditure Outlook for Regasification Terminals (US$ mil), 2021–2025 61

Table 56: LNG Regasification Industry, Caribbean, Annual New-Build Capital Expenditure Outlook for Regasification Terminals by Country (US$ mil), 2021–2025 62

Table 57: LNG Regasification Industry, Jamaica, Regasification Capacity (mtpa), 2015–2025 63

Table 58: LNG Regasification Industry, Puerto Rico, Regasification Capacity (mtpa), 2015–2025 63

Table 59: LNG Regasification Industry, Dominican Republic, Regasification Capacity (mtpa), 2015–2025 64

Table 60: LNG Regasification Industry, Central America, LNG Key Statistics, 2020 65

Table 61: LNG Regasification Industry, Central America, Capacity by Key Countries (bcf), 2015-2025 65

Table 62: LNG Regasification Industry, Central America, Contribution to Regional Regasification Capacity by Country (%), 2020 67

Table 63: LNG Regasification Industry, Central America, Planned and Announced Regasification Terminals, 2021–2025 68

Table 64: LNG Regasification Industry, Central America, Annual New-Build Capital Expenditure Outlook for Regasification Terminals (US$ mil), 2021–2025 69

Table 65: LNG Regasification Industry, Central America, Annual New-Build Capital Expenditure Outlook for Regasification Terminals by Country (US$ bil), 2021–2025 70

Table 66: LNG Regasification Industry, Central America, Capacity Additions Through New Terminals by Country (bcf), 2021–2025 71

Table 67: LNG Regasification Industry, Panama, Regasification Capacity (mtpa), 2015–2025 72

Table 68: LNG Regasification Industry, El Salvador, Regasification Capacity (mtpa), 2015–2025 72

Table 69: LNG Regasification Industry, Europe, LNG Key Statistics, 2020 73

Table 70: LNG Regasification Industry, Europe, Capacity by Key Countries (bcf), 2015-2025 73

Table 71: LNG Regasification Industry, Europe, Contribution to Regional Regasification Capacity by Country (%), 2020 75

Table 72: LNG Regasification Industry, Europe, Planned and Announced Regasification Terminals, 2021–2025 76

Table 73: LNG Regasification Industry, Europe, Annual New-Build and Expansion Capital Expenditure Outlook for Regasification Terminals (US$ mil), 2021–2025 77

Table 74: LNG Regasification Industry, Europe, Annual New-Build and Expansion Capital Expenditure Outlook for Regasification Terminals by Key Countries (US$ mil), 2021–2025 78

Table 75: LNG Regasification Industry, Europe, Capacity Additions Through New and Existing Terminal Expansions by Key Countries (bcf), 2021–2025 79

Table 76: LNG Regasification Industry, Europe, Capacity Additions Through New Terminals by Country (bcf), 2021–2025 79

Table 77: Europe LNG Regasification Industry, Capacity Additions Through Existing Terminals Expansions by Key Countries (bcf), 2021–2025 80

Table 78: LNG Regasification Industry, Spain, Regasification Capacity (bcf), 2015–2025 81

Table 79: LNG Regasification Industry, United Kingdom, Regasification Capacity (bcf), 2015–2025 81

Table 80: LNG Regasification Industry, France, Regasification Capacity (bcf), 2015–2025 82

Table 81: LNG Regasification Industry, Italy, Regasification Capacity (bcf), 2015–2025 82

Table 82: LNG Regasification Industry, Netherlands, Regasification Capacity (bcf), 2015–2025 83

Table 83: LNG Regasification Industry, Belgium, Regasification Capacity (bcf), 2015–2025 83

Table 84: LNG Regasification Industry, Portugal, Regasification Capacity (bcf), 2015–2025 84

Table 85: LNG Regasification Industry, Greece, Regasification Capacity (bcf), 2015–2025 84

Table 86: LNG Regasification Industry, Poland, Regasification Capacity (bcf), 2015–2025 85

Table 87: LNG Regasification Industry, Sweden, Regasification Capacity (bcf), 2015–2025 85

Table 88: LNG Regasification Industry, Malta, Regasification Capacity (bcf), 2015–2025 85

Table 89: LNG Regasification Industry, Finland, Regasification Capacity (bcf), 2015–2025 86

Table 90: LNG Regasification Industry, Gibraltar, Regasification Capacity (bcf), 2015–2025 86

Table 91: LNG Regasification Industry, Ireland, Regasification Capacity (bcf), 2015–2025 86

Table 92: LNG Regasification Industry, Germany, Regasification Capacity (bcf), 2015–2025 87

Table 93: LNG Regasification Industry, Croatia, Regasification Capacity (bcf), 2015–2025 87

Table 94: LNG Regasification Industry, Former Soviet Union, LNG Key Statistics, 2020 88

Table 95: LNG Regasification Industry, Former Soviet Union, Capacity by Country (bcf), 2015-2025 88

Table 96: LNG Regasification Industry, Former Soviet Union, Contribution to Regional Regasification Capacity by Country (%), 2020 90

Table 97: LNG Regasification Industry, Lithuania, Regasification Capacity (bcf), 2015–2025 91

Table 98: LNG Regasification Industry, Russia, Regasification Capacity (bcf), 2015–2025 91

Table 99: LNG Regasification Industry, Middle East, LNG Key Statistics, 2020 92

Table 100: LNG Regasification Industry, Middle East, Capacity by Key Countries (bcf), 2015-2025 92

Table 101: LNG Regasification Industry, Middle East, Contribution to Regional Regasification Capacity by Country (%), 2020 94

Table 102: LNG Regasification Industry, Middle East, Planned and Announced Regasification Terminals, 2021–2025 95

Table 103: LNG Regasification Industry, Middle East, Annual New-Build Capital Expenditure Outlook for Regasification Terminals (US$ mil), 2021–2025 96

Table 104: LNG Regasification Industry, Middle East, Annual New-Build Capital Expenditure Outlook for Regasification Terminals by Country (US$ mil), 2021–2025 97

Table 105: LNG Regasification Industry, Middle East, Capacity Additions Through New and Existing Terminal Expansions by Country (bcf), 2021–2025 98

Table 106: LNG Regasification Industry, Middle East, Capacity Additions Through New Terminals by Country (bcf), 2021–2025 98

Table 107: LNG Regasification Industry, Middle East, Capacity Additions Through Existing Terminal Expansions by Country (bcf), 2021–2025 98

Table 108: LNG Regasification Industry, Turkey, Regasification Capacity (bcf), 2015–2025 99

Table 109: LNG Regasification Industry, United Arab Emirates, Regasification Capacity (bcf), 2015–2025 99

Table 110: LNG Regasification Industry, Bahrain, Regasification Capacity (bcf), 2015–2025 100

Table 111: LNG Regasification Industry, Kuwait, Regasification Capacity (bcf), 2015–2025 100

Table 112: LNG Regasification Industry, Jordan, Regasification Capacity (bcf), 2015–2025 101

Table 113: LNG Regasification Industry, Israel, Regasification Capacity (bcf), 2015–2025 101

Table 114: LNG Regasification Industry, North America, LNG Key Statistics, 2020 102

Table 115: LNG Regasification Industry, North America, Capacity by Country (bcf), 2015-2025 102

Table 116: LNG Regasification Industry, North America, Contribution to Regional Regasification Capacity by Country (%), 2020 104

Table 117: LNG Regasification Industry, North America, Planned and Announced Regasification Terminals, 2021–2025 105

Table 118: LNG Regasification Industry, North America, Annual New-Build Capital Expenditure Outlook for Regasification Terminals (US$ mil), 2021–2025 106

Table 119: LNG Regasification Industry, North America, Annual New-Build Capital Expenditure Outlook for Regasification Terminals by Country (US$ mil), 2021–2025 107

Table 120: LNG Regasification Industry, North America, Capacity Additions Through New Terminals by Country (bcf), 2021–2025 108

Table 121: LNG Regasification Industry, The US, Regasification Capacity (bcf), 2015–2025 109

Table 122: LNG Regasification Industry, Mexico, Regasification Capacity (bcf), 2015–2025 110

Table 123: LNG Industry, Canada, Regasification Capacity (bcf), 2015–2025 110

Table 124: LNG Regasification Industry, Oceania, Capacity by Country (bcf), 2015-2025 111

Table 125: LNG Regasification Industry, Oceania, Planned and Announced Regasification Terminals, 2021–2025 111

Table 126: LNG Regasification Industry, Oceania, Annual New-Build and Expansion Capital Expenditure Outlook for Regasification Terminals (US$ mil), 2021–2025 112

Table 127: LNG Regasification Industry, Oceania, Annual New-Build and Expansion Capital Expenditure Outlook for Regasification Terminals by Country (US$ mil), 2021–2025 113

Table 128: LNG Regasification Industry, Oceania, Capacity Additions Through New Terminals by Country (bcf), 2021–2025 114

Table 129: LNG Regasification Industry, Australia, Regasification Capacity (bcf), 2015–2025 114

Table 130: LNG Regasification Industry, South America, LNG Key Statistics, 2020 115

Table 131: LNG Regasification Industry, South America, Capacity by Country (bcf), 2015-2025 115

Table 132: LNG Regasification Industry, South America, Contribution to Regional Regasification Capacity by Country (%), 2020 117

Table 133: LNG Regasification Industry, South America, Planned and Announced Regasification Terminals, 2021–2025 118

Table 134: LNG Regasification Industry, South America, Annual New-Build and Expansion Capital Expenditure Outlook for Regasification Terminals (US$ mil), 2021–2025 119

Table 135: LNG Regasification Industry, South America, Annual New-Build and Expansion Capital Expenditure Outlook for Regasification Terminals by Country (US$ mil), 2021–2025 120

Table 136: LNG Regasification Industry, South America, Capacity Additions Through New and Existing Terminal Expansions by Country (bcf), 2021–2025 121

Table 137: LNG Regasification Industry, South America, Capacity Additions Through New Terminals by Country (bcf), 2021–2025 121

Table 138: LNG Industry, South America, Regasification Capacity Additions Through Existing Terminal Expansions by Country (bcf), 2021–2025 121

Table 139: LNG Regasification Industry, Brazil, Regasification Capacity (bcf), 2015–2025 122

Table 140: LNG Regasification Industry, Argentina, Regasification Capacity (bcf), 2015–2025 122

Table 141: LNG Regasification Industry, Chile, Regasification Capacity (bcf), 2015–2025 123

Table 142: LNG Regasification Industry, Colombia, Regasification Capacity (bcf), 2015–2025 123

Table 143: LNG Regasification Industry, Ecuador, Regasification Capacity (bcf), 2015–2025 124

Figures

Figure 1: LNG Regasification Industry, Global, Capacity Share vis-à-vis Growth by Key Countries, 2015–2020 14

Figure 2: LNG Regasification Industry, Global, Contribution to Total Regasification Capacity by Region (%), 2020 15

Figure 3: LNG Regasification Industry, Global, Capacity Growth by Region, 2015–2025 16

Figure 4: LNG Regasification Industry, Global, LNG Imports by Region (bcf), 2015–2020 17

Figure 5: LNG Regasification Industry, Global, LNG Exports Share vis-à-vis Growth by Top Five LNG Exporting Countries, 2015–2020 18

Figure 6: LNG Regasification Industry, Global, LNG Imports Share vis-à-vis Growth by Top Five LNG Importing Countries, 2015–2020 19

Figure 7: LNG Regasification Industry, Global, Top Five LNG Importers by Average LNG Import Price (US$/Tonne), 2020 20

Figure 8: LNG Regasification Industry, Global, Annual New-Build and Expansion Capital Expenditure Outlook for Regasification Terminals (US$ bil), 2021–2025 22

Figure 9: LNG Regasification Industry, Global, Annual New-Build and Expansion Capital Expenditure Outlook for Regasification Terminals by Key Countries (US$ mil), 2021–2025 23

Figure 10: LNG Regasification Industry, Africa, Capacity Share vis-à-vis Growth by Country, 2015–2020 27

Figure 11: LNG Regasification Industry, Africa, Contribution to Regional Regasification Capacity by Country (%), 2020 28

Figure 12: LNG Regasification Industry, Africa, Annual New-Build and Expansion Capital Expenditure Outlook for Regasification Terminals (US$ mil), 2021–2025 30

Figure 13: LNG Regasification Industry, Africa, Annual New-Build and Expansion Capital Expenditure Outlook for Regasification Terminals by Country (US$ mil), 2021–2025 31

Figure 14: LNG Regasification Industry, Asia, Capacity Share vis-à-vis Growth by Key Countries, 2015–2020 36

Figure 15: LNG Regasification Industry, Asia, Contribution to Regional Regasification Capacity by Country (%), 2020 37

Figure 16: LNG Regasification Industry, Asia, Annual New-Build and Expansion Capital Expenditure Outlook for Regasification Terminals (US$ mil), 2021–2025 42

Figure 17: LNG Regasification Industry, Asia, Annual New-Build and Expansion Capital Expenditure Outlook for Regasification Terminals by Key Countries (US$ mil), 2021–2025 43

Figure 18: LNG Regasification Industry, Caribbean, Capacity Share vis-à-vis Growth by Key Countries, 2015–2020 59

Figure 19: LNG Regasification Industry, Caribbean, Contribution to Regional Regasification Capacity by Country (%), 2020 60

Figure 20: LNG Regasification Industry, Caribbean, Annual New-Build Capital Expenditure Outlook for Regasification Terminals (US$ mil), 2021–2025 61

Figure 21: LNG Regasification Industry, Caribbean, Annual New-Build Capital Expenditure Outlook for Regasification Terminals by Country (US$ mil), 2021–2025 62

Figure 22: LNG Regasification Industry, Central America, Capacity Share vis-à-vis Growth by Key Countries, 2015–2020 66

Figure 23: LNG Regasification Industry, Central America, Contribution to Regional Regasification Capacity by Country (%), 2020 67

Figure 24: LNG Regasification Industry, Central America, Annual New-Build Capital Expenditure Outlook for Regasification Terminals (US$ mil), 2021–2025 69

Figure 25: LNG Regasification Industry, Central America, Annual New-Build Capital Expenditure Outlook for Regasification Terminals by Country (US$ mil), 2021–2025 70

Figure 26: LNG Regasification Industry, Europe, Capacity Share vis-à-vis Growth by Key Countries, 2015–2020 74

Figure 27: LNG Regasification Industry, Europe, Contribution to Regional Regasification Capacity by Country (%), 2020 75

Figure 28: LNG Regasification Industry, Europe, Annual New-Build and Expansion Capital Expenditure Outlook for Regasification Terminals (US$ mil), 2021–2025 77

Figure 29: LNG Regasification Industry, Europe, Annual New-Build and Expansion Capital Expenditure Outlook for Regasification Terminals (US$ mil), 2021–2025 78

Figure 30: LNG Regasification Industry, Former Soviet Union, Capacity Share vis-à-vis Growth by Country, 2015–2020 89

Figure 31: LNG Regasification Industry, Former Soviet Union, Contribution to Regional Regasification Capacity by Country (%), 2020 90

Figure 32: LNG Regasification Industry, Middle East, Capacity Share vis-à-vis Growth by Key Countries, 2015–2020 93

Figure 33: LNG Regasification Industry, Middle East, Contribution to Regional Regasification Capacity by Country (%), 2020 94

Figure 34: LNG Regasification Industry, Middle East, Annual New-Build Capital Expenditure Outlook for Regasification Terminals (US$ mil), 2021–2025 96

Figure 35: LNG Regasification Industry, Middle East, Annual New-Build Capital Expenditure Outlook for Regasification Terminals by Country (US$ mil), 2021–2025 97

Figure 36: LNG Regasification Industry, North America, Capacity Share vis-à-vis Growth by Country, 2015–2020 103

Figure 37: LNG Regasification Industry, North America, Contribution to Regional Regasification Capacity by Country (%), 2020 104

Figure 38: LNG Regasification Industry, North America, Annual New-Build Capital Expenditure Outlook for Regasification Terminals (US$ mil), 2021–2025 106

Figure 39: LNG Regasification Industry, North America, Annual New-Build Capital Expenditure Outlook for Regasification Terminals by Country (US$ mil), 2021–2025 107

Figure 40: LNG Regasification Industry, Oceania, Annual New-Build and Expansion Capital Expenditure Outlook for Regasification Terminals (US$ mil), 2021–2025 112

Figure 41: LNG Regasification Industry, Oceania, Annual New-Build and Expansion Capital Expenditure Outlook for Regasification Terminals by Country (US$ mil), 2021–2025 113

Figure 42: LNG Regasification Industry, South America, Capacity Share vis-à-vis Growth by Country, 2015–2020 116

Figure 43: LNG Regasification Industry, South America, Contribution to Regional Regasification Capacity by Country (%), 2020 117

Figure 44: LNG Regasification Industry, South America, Annual New-Build and Expansion Capital Expenditure Outlook for Regasification Terminals (US$ mil), 2021–2025 119

Figure 45: LNG Regasification Industry, South America, Annual New-Build and Expansion Capital Expenditure Outlook for Regasification Terminals by Country (US$ mil), 2021–2025 120

Frequently asked questions

LNG Regasification Market Size and Forecast by Region, Trade Movements and Price 2021-2025 standard reports
Currency USD
$5,000

Can be used by individual purchaser only

$15,000

Can be shared globally by unlimited users within the purchasing corporation e.g. all employees of a single company


Undecided about purchasing this report?

Enquire Before Buying Request a Free Sample

Get in touch to find out about multi-purchase discounts

reportstore@globaldata.com
Tel +44 20 7947 2745

Every customer’s requirement is unique. With over 220,000 construction projects tracked, we can create a tailored dataset for you based on the types of projects you are looking for. Please get in touch with your specific requirements and we can send you a quote.

Sample Report

LNG Regasification Market Size and Forecast by Region, Trade Movements and Price 2021-2025 was curated by the best experts in the industry and we are confident about its unique quality. However, we want you to make the most beneficial decision for your business, so we offer free sample pages to help you:

  • Assess the relevance of the report
  • Evaluate the quality of the report
  • Justify the cost

Download your copy of the sample report and make an informed decision about whether the full report will provide you with the insights and information you need.

Below is a sample report to understand what you are buying

See what our customers are saying

“The GlobalData platform is our go-to tool for intelligence services. GlobalData provides an easy way to access comprehensive intelligence data around multiple sectors, which essentially makes it a one-for-all intelligence platform, for tendering and approaching customers.

GlobalData is very customer orientated, with a high degree of personalised services, which benefits everyday use. The highly detailed project intelligence and forecast reports can be utilised across multiple departments and workflow scopes, from operational to strategic level, and often support strategic decisions. GlobalData Analytics and visualisation solutions has contributed positively when preparing management presentations and strategic papers.”

Business Intelligence & Marketing Manager, SAL Heavy Lift

“COVID-19 has caused significant interference to our business and the COVID-19 intelligence from GlobalData has helped us reach better decisions around strategy. These two highlights have helped enormously to understand the projections into the future concerning our business units, we also utilise the project database to source new projects for Liebherr-Werk to use as an additional source to pitch for new business.”

Market Analyst & Management, Liebherr-Werk

Your daily news has saved me a lot of time and keeps me up-to-date with what is happening in the market, I like that you almost always have a link to the source origin. We also use your market data in our Strategic Business Process to support our business decisions. By having everything in one place on the Intelligence Center it has saved me a lot of time versus looking on different sources, the alert function also helps with this.

Head of Key Accounts, Saab AB

Having used several other market research companies, I find that GlobalData manages to provide that ‘difficult-to-get’ market data that others can’t, as well as very diverse and complete consumer surveys.

Marketing Intelligence Manager, Portugal Foods

Our experience with GlobalData has been very good, from the platform itself to the people. I find that the analysts and the account team have a high level of customer focus and responsiveness and therefore I can always rely on. The platform is more holistic than other providers. It is convenient and almost like a one stop shop. The pricing suite is highly competitive and value for our organisation.

I like reports that inform new segments such as the analysis on generation Z, millennials, the impact of COVID 19 to our banking customers and their new channel habits. Secondly the specialist insight on affluent sector significantly increases our understanding about this group of customers. The combination of those give us depth and breadth of the evolving market.

I’m in the business of answering and helping people make decisions so with the intelligence center I can do that, effectively and efficiently. I can share quickly key insights that answer and satisfy our country stakeholders by giving them many quality studies and primary research about competitive landscape beyond the outlook of our bank. It helps me be seen as an advisory partner and that makes a big difference. A big benefit of our subscription is that no one holds the whole data and because it allows so many people, so many different parts of our organisation have access, it enables all teams to have the same level of knowledge and decision support.

Head of Customer Insight and Research, Standard Chartered

“I know that I can always rely on Globaldata’s work when I’m searching for the right consumer and market insights. I use Globaldata insights to understand the changing market & consumer landscape and help create better taste & wellbeing solutions for our customers in food, beverage and healthcare industries.

Globaldata has the right data and the reports are of very high quality compared to your competitors. Globaldata not only has overall market sizes & consumer insights on food & beverages but also provides insights at the ingredient & flavour level. That is key for B2B companies like Givaudan. This way we understand our customers’ business and also gain insight to our unique industry”

Head of Consumer Sensory Insights, Givaudan

GlobalData provides a great range of information and reports on various sectors that is highly relevant, timely, easy to access and utilise.  The reports and data dashboards help engagement with clients; they provide valuable industry and market insights that can enrich client conversations and can help in the shaping of value propositions. Moreover, using GlobalData products has helped increase my knowledge of the finance sector, the players within it, and the general threats and opportunities.

I find the consumer surveys that are carried out to be extremely beneficial and not something I have seen anywhere else. They provided an insightful view of why and which consumers take (or don’t) particular financial products. This can help shape conversations with clients to ensure they make the right strategic decisions for their business.

One of the challenges I have found is that data in the payments space is often piecemeal. With GD all of the data I need is in one place, but it also comes with additional market reports that provide useful extra context and information. Having the ability to set-up alerts on relevant movements in the industry, be it competitors or customers, and have them emailed directly to me, ensures I get early sight of industry activity and don’t have to search for news.

Senior Account Manager, TSYS
Go even deeper with GlobalData Intelligence Center

Every Company Report we produce is powered by the GlobalData Intelligence Center.

Subscribing to our intelligence platform means you can monitor developments at LNG Regasification Market Size and Forecast by Region, Trade Movements and Price 2021-2025 in real time.

  • Access a live LNG Regasification Market Size and Forecast by Region, Trade Movements and Price 2021-2025 dashboard for 12 months, with up-to-the-minute insights.
  • Fuel your decision making with real-time deal coverage and media activity.
  • Turn insights on financials, deals, products and pipelines into powerful agents of commercial advantage.