Methane – The Low-Hanging Fruit of Emissions Reduction
Powered by ![]()
All the vital news, analysis, and commentary curated by our industry experts.

Methane has 84-86 times the global warming potential of CO2 on a 20-year basis. On a 100-year basis, it decreases to 28-36 times. This decrease is due to methane’s relatively short lifespan in the atmosphere. However, its high short-term potency means that emission reductions can have a large and immediate effect on reducing the impacts of climate change. Methane emission intensities vary among O&G producing countries due to inefficiencies along the value chain or lack of abatement measures.
Data from the EPA Greenhouse Gas Reporting Program has allowed GlobalData to analyze methane emissions at the operator level through 2020. For the third year in a row, Hilcorp Energy is the largest methane emitter among O&G producers, while Energy Transfer is the largest methane emitter overall. The US has the second-highest methane emissions from O&G operations but ranks among the bottom third of countries for emission intensity. By industry segment, onshore production was responsible for nearly 50% of O&G methane emissions, followed by gathering & boosting operations and natural gas distribution.
An estimated 21% of US upstream methane emissions could have been eliminated at zero or negative net cost in 2020 using existing technology. If gas prices continue to rise, this percentage will only increase. Replacing pneumatic pumps with electricity and capturing blowdown emissions are two of the most likely profitable changes.
What are the market dynamics of methane emission reduction?
The methane problem is generally larger than commonly thought due to inaccurate measurement methods. One study estimated that the EPA’s 2015 inventory underreported methane emissions by over 60%. However, companies are beginning to use techniques like aerial and satellite measurements to improve accuracy. The US oil & gas industry emits far more methane than almost any other single country, however, it is in the bottom third globally for emissions intensity per barrel of oil equivalent (boe). Emission intensities vary widely, highlighting both the large potential to decrease methane emissions as well as the inconsistencies in emissions reporting.
O&G contributes just 25% of methane emissions, the technological solutions for reduction are mature and sometimes inexpensive. Globally, an estimated over 42% of methane emissions can be eliminated at no net cost or even net profit. Agricultural emissions are difficult to capture or reduce and are distributed over a wide area. Pneumatic pumps and devices are gas-powered, leading to direct emissions. The cost to swap this equipment for electricity, among other solutions, is shown on the right. Within equipment types, costs vary depending on the production source. Offshore oil & gas and onshore oil have the lowest-cost abatement potential. Onshore gas and downstream segments have higher average abatement costs.
Globally, Russia is the top methane emission country followed by the US, the UAE, Turkmenistan, Iraq, China, Iran, Egypt, Saudi Arabia, Canada, Algeria, Venezuela, Nigeria, Mexico, Qatar, and Kazakhstan. The US oil & gas industry emits far more methane than almost any other single country, however, it is in the bottom third globally for emissions intensity per boe. The top 16 countries are responsible for 2.6 bcf methane emissions from oil & gas, 80% of the global total. Additionally, these countries account for over 74% of global oil & gas production.
Methane market, by methane emitting countries
 For more regional insights, download a free report sample
Which are the top methane emitting companies?
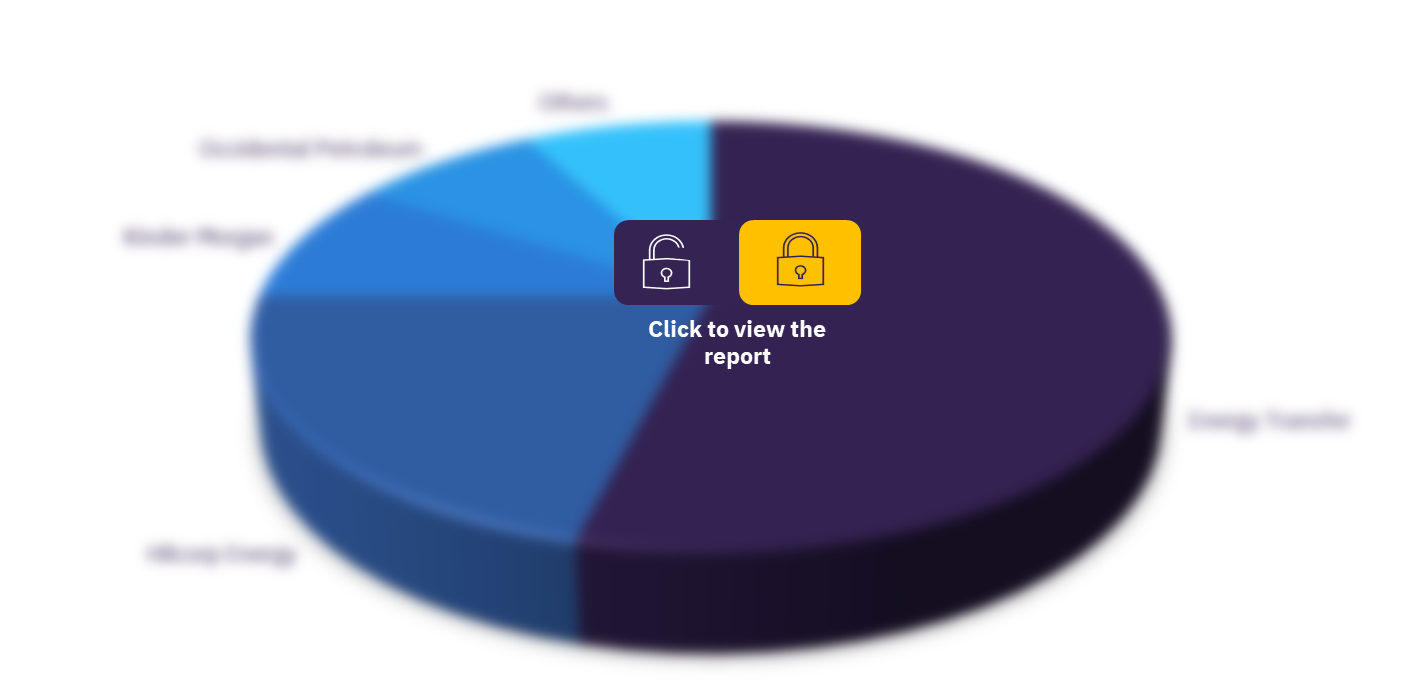
Major methane emitter companies for upstream activities are Hilcorp Energy, Occidental Petroleum, ExxonMobil, BP America, and others. Top methane emitting companies in the US are Energy Transfer, Hilcorp Energy, Kinder Morgan, Occidental Petroleum, ExxonMobil, BP America, ConocoPhillips, Sempra Energy, Dominion Energy, and Chesapeake Energy.
The top methane emitters in the US are a mix of upstream and midstream operators. Midstream companies engage in a variety of activities, and thus main emission sources vary between them. Generally, gas processing and transmission result in large amounts of vented methane, while emissions from gas distribution activities are mainly the result of equipment leaks.
Methane market, by methane emitting companies
To know more about key companies, download a free report sample
Market report scope
| Total CH4 Emission (Year – 2019) | ~8,000 kt |
| Companies Mentioned | Energy Transfer, Hilcorp Energy, Kinder Morgan, Occidental Petroleum, ExxonMobil, BP America, ConocoPhillips, Sempra Energy, Dominion Energy, Chesapeake Energy, Diversified Gas & Oil Corp, SF Holding Corp, Scout Energy, Fourpoint Energy, National Grid USA, Loews Corp, Atmos Corp, Targa Resources, Enable Midstream Partners, and The Williams Companies |
The report will allow you to
- Analyze the status of methane emissions from oil & gas, globally and in the US.
- Analyze the sources of US methane emissions, by industry segment, emission process, and equipment.
- Review proposed policies to regulate US methane emissions.
- Profile top US methane emitting companies.
Reasons to Buy
- Understand where methane emissions are highest along the oil & gas value chain.
- Learn which steps can be taken to economically reduce methane emissions.
- Review proposed EPA methane regulations.
- View profiles of top methane emitting companies, including emissions breakdown and emission reduction steps being taken.
Hilcorp Energy
Kinder Morgan
Occidental Petroleum
ExxonMobil
BP America
ConocoPhillips
Sempra Energy
Dominion Energy
Chesapeake Energy
Diversified Gas & Oil Corp
SF Holding Corp
Scout Energy
Fourpoint Energy
National Grid USA
Loews Corp
Atmos Corp
Targa Resources
Enable Midstream Partners
The Williams Companies
Table of Contents
Table
Figures
Frequently asked questions
-
What was the total CH4 emission in 2019?
The total CH4 emission in 2019 was valued at ~8,000 kt.
-
Which are the top methane emitting countries?
Globally, Russia is the top methane emission country followed by the US, the UAE, Turkmenistan, Iraq, China, Iran, Egypt, Saudi Arabia, Canada, Algeria, Venezuela, Nigeria, Mexico, Qatar, and Kazakhstan.
-
Which are the major CH4 emitting companies in the US?
Top methane emitting companies in the US are Energy Transfer, Hilcorp Energy, Kinder Morgan, Occidental Petroleum, ExxonMobil, BP America, ConocoPhillips, Sempra Energy, Dominion Energy, and Chesapeake Energy.
Get in touch to find out about multi-purchase discounts
reportstore@globaldata.com
Tel +44 20 7947 2745
Every customer’s requirement is unique. With over 220,000 construction projects tracked, we can create a tailored dataset for you based on the types of projects you are looking for. Please get in touch with your specific requirements and we can send you a quote.


