Netherlands Baby Food Market Size and Share by Categories, Distribution and Forecast to 2029

Powered by

All the vital news, analysis, and commentary curated by our industry experts.

Netherlands Baby Food Market Report Overview

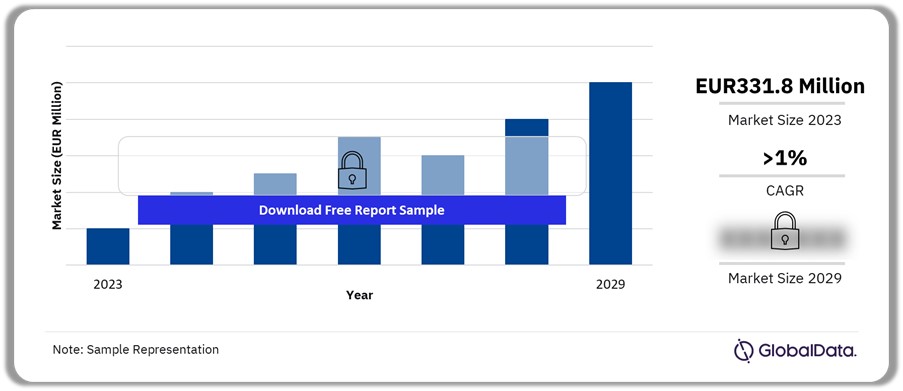
The baby food sales in the Netherlands were EUR331.8 million in 2023. However, the market will record a CAGR of more than 1% during 2023-2029. The Netherlands’ baby food market outlook includes demographic and socio-economic trends to aid clients in effective decision-making.

Netherlands Baby Food Market Outlook, 2023-2029 (EUR Million)
Netherlands Baby Food Market Outlook 2023-2029 (EUR Million)
Buy the Full Report for Netherlands Baby Food Market Revenue
Download a Free Report Sample

The Netherlands baby food market insights look at current and future trends that will impact the baby food industry. This report collates multiple data sources to offer a comprehensive baby food sector overview in the Netherlands from 2017 to 2029.

Market Size (2023) EUR166 million ($169.6 million)
CAGR (2023-2029) >1%
Historical Period 2017-2023
Forecast Period 2023-2029
Key Categories ·        Baby Milks

·        Baby Cereals & Dry Meals

·        Baby Wet Meals & Other

·        Baby Finger Food

·        Baby Drinks

Key Distribution Channels ·        Hypermarkets & Supermarkets

·        Drugstores & Pharmacies

·        Convenience Stores

·        E-retailers

Leading Manufacturers ·        Danone

·        Nestlé

·        Hero

·        The Hain Celestial Group

·        The Kraft Heinz Company

Enquire & Decide Discover the perfect solution for your business needs. Enquire now and let us help you make an informed decision before making a purchase.

Netherlands Baby Food Market Trends

High inflation affected the purchasing power of many Dutch consumers until 2023. However, convenience will remain a crucial feature with the rise in the purchasing power of women, including new mothers, entering the workforce. Although initially slow to take off, the market for organic and specialist baby foods will gain greater popularity during 2023-2029. Furthermore, increased concern about health issues among adults has already led to the introduction of foods with added vitamins and other health claims in the baby food sector. This will further create an opportunity for baby food manufacturers to launch user-friendly and natural products and drive organic infant food sales in the future.

Buy the Full Report for the Dutch Baby Food Trends Analysis, Download a Free Sample PDF

Netherlands Baby Food Market Segmentation by Categories

Baby milks recorded the highest baby food category sales in 2023

Netherlands Baby Food Market Segmentation by Categories

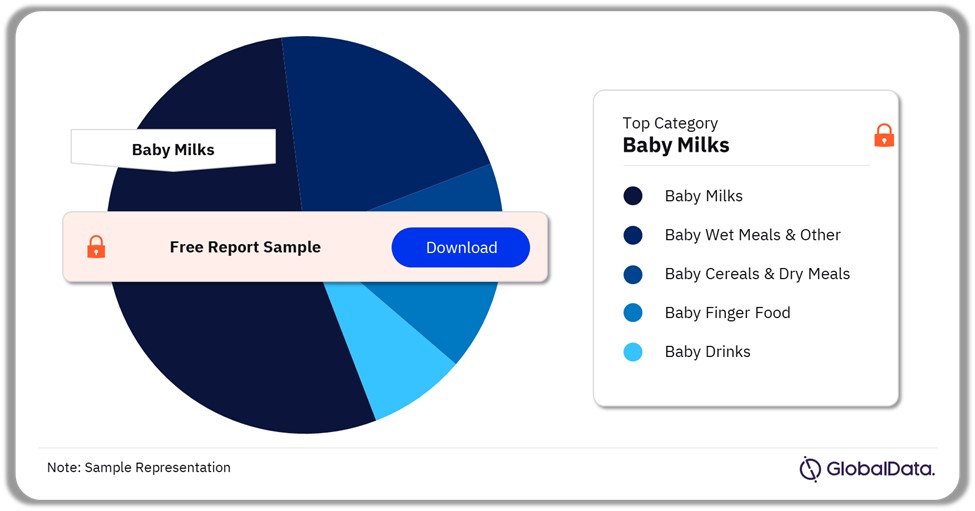
The key categories in the Netherlands baby food market are:

  • Baby Milks
  • Baby Wet Meals & Other
  • Baby Cereals & Dry Meals
  • Baby Finger Food
  • Baby Drink

The baby milk category will register marginal growth by 2029. Growing-up milk and follow-on milk among others are the key segments in this category. In the Netherlands, most baby milks available were in powdered form. Powdered milks are most prevalent in first-stage milk.

 Buy the Full Report for Categorical Netherlands Baby Food Market Outlook
Download a Free Report Sample

Segments Covered in the Report

Netherlands Baby Food Categories Outlook (Value, EUR Million, 2017-2029)

  • Baby Milks
  • Baby Wet Meals & Other
  • Baby Cereals & Dry Meals
  • Baby Drinks

Netherlands Baby Food Distribution Channel Outlook (Value, EUR Million, 2017-2029)

  • Hypermarkets and Supermarkets
  • Drugstores & Pharmacies
  • Convenience Stores
  • E-Retailers

Netherlands Baby Food Market Segmentation by Distribution Channels

Hypermarkets & supermarkets amounted to 70% of overall baby food value sales in 2023
Netherlands Baby Food Market Segmentation by Distribution Channels

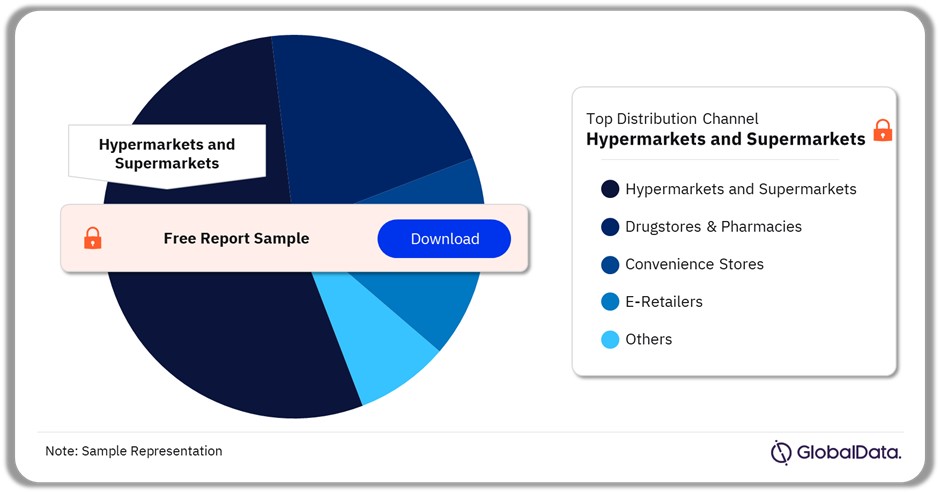
The key distribution channels in the Netherlands baby food market are:

  • Hypermarkets & Supermarkets
  • Drugstores & Pharmacies
  • Convenience Stores
  • E-retailers

Hypermarkets & supermarkets was the most preferred distribution channel for baby finger food and baby drinks category in 2023. Drugstores & pharmacies led the second-highest baby food value share in 2023.

Buy the Full Report for More Distribution Channel Insights into the Netherlands Baby Food Market
Download a Free Report Sample

Netherlands Baby Food Market - Competitive Landscape

In 2023, Danone was the leading Dutch baby food company
Netherlands Baby Food Market Analysis by Manufacturers, 2023 (%)

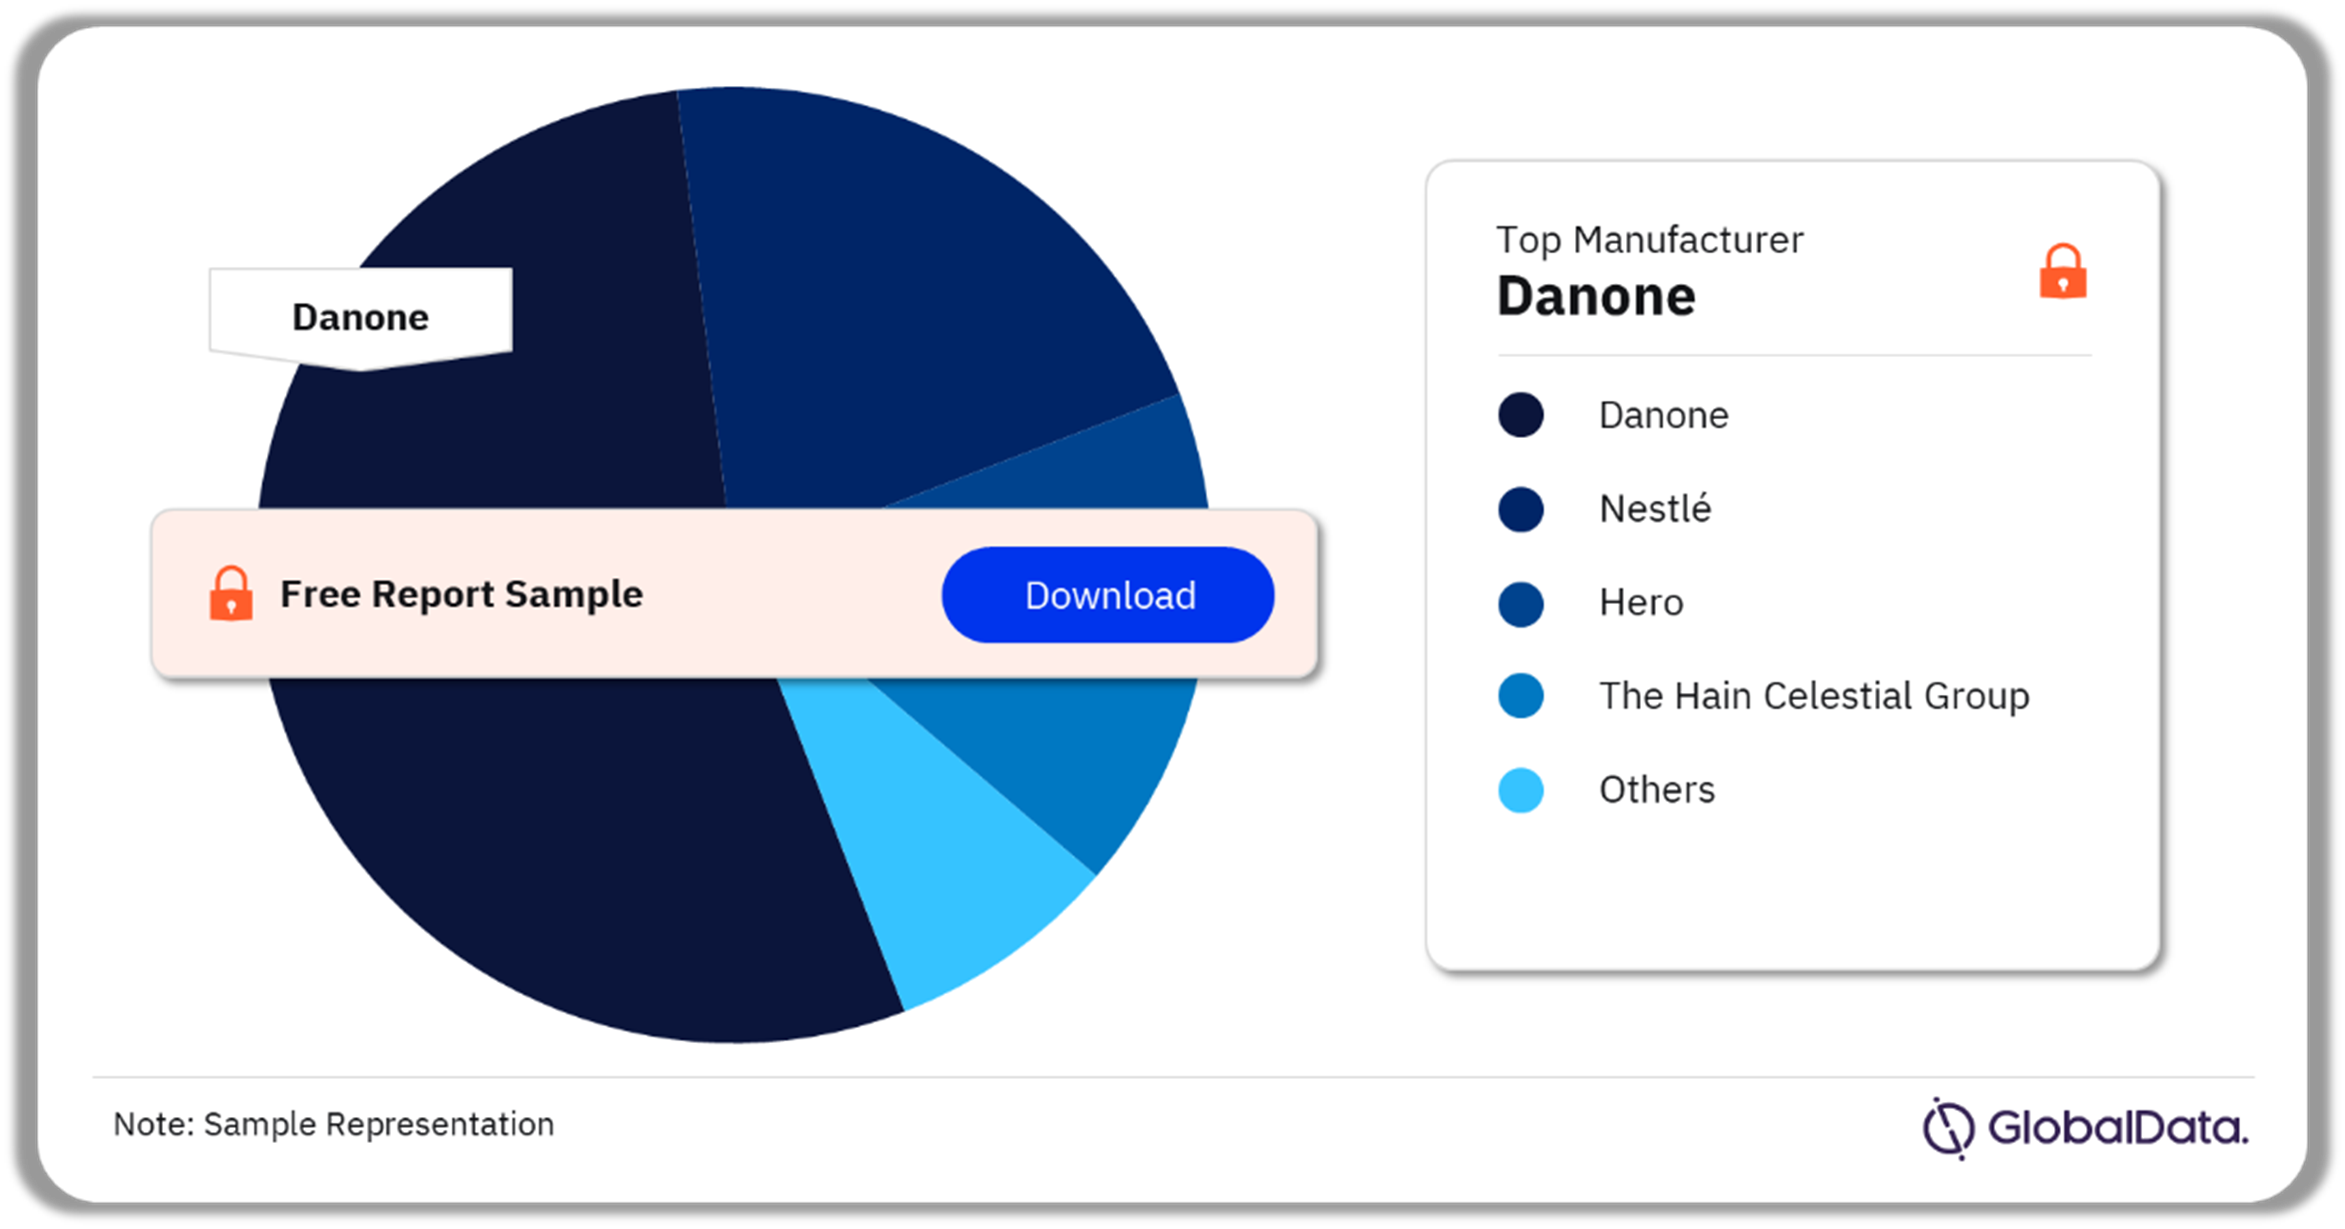
The leading baby food manufacturers in the Netherlands are:

  • Danone
  • Nestlé
  • Hero
  • The Hain Celestial Group
  • The Kraft Heinz Company
  • Others

Danone accounted for the highest baby food value and volume share across all categories in 2023. The company promoted brands, including Nutrilon, Bambix, and Olvarit among others. Hero and Nestlé followed the lead among other baby food companies.

Buy the Full Report for Leading Netherlands Baby Food Manufacturers
Download a Free Report Sample

Scope

This report provides:

  • Consumption data based on a unique combination of industry research, fieldwork, and market sizing work. In-house expertise to offer extensive trends and dynamics data affecting the industry.
  • Detailed company profiles considering their entry into the baby food industry with key product sectors.
  • Market profile of the various product sectors with their key features & developments. Extensive insights about product segmentation, per capita trends, and the various manufacturers & brands.
  • Baby food industry retailing overview with company revenues along with the distribution channel insights.
  • Future projections considering various baby food market trends that are likely to affect the industry.

Key Highlights

Value sales of baby milks increased from EUR124.6 million ($140.8 million) in 2017 to EUR166 million ($169.6 million) in 2023, at a CAGR of 4.9%.

Baby cereals & dry meals volumes increased from EUR14.8 million ($16.8 million) in 2017 to EUR18.6 million ($19 million) in 2023, at a CAGR of 3.8%.

Value sales of the baby wet meals & other category increased from EUR87.3 million ($98.6 million) in 2017 to EUR109.5 million ($111.8 million) in 2023, registering a CAGR of 3.8%.

During 2017–23, PCC of baby finger food increased by 4% to reach 2.6kg in 2023.

During 2017–23, PCC of baby drinks fell by 28.2%, totaling 5.1kg in 2023.

Reasons to Buy

  • Evaluate important changes in consumer behavior and identify profitable markets and areas for product innovation.
  • Analyse current and forecast behavior trends in each category to identify the best opportunities to exploit.
  • Understand individual product category consumption to align your sales and marketing efforts with the latest trends in the market.
  • Investigate which categories are performing the best and how this is changing market dynamics.

Nestlé
Danone
Hero
The Hain Celestial Group
The Kraft Heinz Company

Table of Contents

  • 1. Executive Summary
  • 2. Market Environment

    • 2.1. Value and Volume Growth Analysis by Region
    • 2.2. Growth Analysis of Netherlands Compared with Other Leading Countries in Western Europe
    • 2.3. PCC and PCE of Netherlands Compared with Global and Western European Markets

  • 3. Background

    • 3.1. Births
    • 3.2. The Consumer
    • 3.3. Sociodemographic Trends
    • 3.4. Working Women
    • 3.5. Breastfeeding Trends
    • 3.6. Regulations

  • 4. Overview

    • 4.1. Netherlands Baby Food Sector Snapshot
    • 4.2. Market Size Analysis
    • 4.3. Manufacturer Shares

  • 5. Category Analysis

    • 5.1. Baby Milks
    • 5.2. Baby Cereals & Dry Meals
    • 5.3. Baby Wet Meals & Other
    • 5.4. Baby Finger Food
    • 5.5. Baby Drinks

  • 6. Production and Trade

    • 6.1. Imports
    • 6.2. Exports
    • 6.3. Production

  • 7. Distribution

    • 7.1. Channel Share Analysis
    • 7.2. Baby Food Retailing

  • 8. Economic Background

    • 8.1. GDP Growth and Inflation

  • 9. Prospects and Forecasts

    • 9.1. Future Trends

  • 10. Appendix

Table

Birth & population trends, 2006–29

Live births by city & province, 2010 and 2013–22

Non-marital births, 2006 and 2010–18

Live births by age of mother, %, 2010–22

Age of mother at birth of first child, 2010–22

Number of women of childbearing age by age group, 2010 and 2016–22

Female employment trends, 2010–22

Working mothers, by age of baby and hours worked, % of mothers 2006–13

Percentage trends in exclusive breastfeeding from birth to six months, 2001, 2003, 2005, 2007, 2010, and 2015

Breastfeeding trends by age of baby, 2004–15

Breastfeeding rates by age of baby and age or educational attainment of mother, 2004–06

Trends in bottle feeding, 2001–02, 2005, 2007, 2010, and 2015

Leading categories (value and volume), 2023

Baby food: manufacturer shares, value, %, 2017–23

Baby food: manufacturer shares, volume, %, 2017–23

Baby food: manufacturer shares by category, %, 2023

Baby milks: SKUs by pack type, 2023

Baby milks: SKUs by pack size, 2023

Baby milks: brand price positioning analysis, 2023

Baby milks: manufacturer shares, value & volume, %, 2017–23

Baby milks: manufacturer & brand shares, value %, 2017–23

Baby milks: manufacturer & brand shares, volume %, 2017–23

Baby cereals & dry meals: SKUs by pack type, 2023

Baby cereals & dry meals: SKUs by pack size, 2023

Baby cereals & dry meals: brand price positioning analysis, 2023

Baby cereals & dry meals: manufacturer shares, value & volume, %, 2017–23

Baby cereals & dry meals: manufacturer & brand shares, value %, 2017–23

Baby cereals & dry meals: manufacturer & brand shares, volume %, 2017–23

Baby wet meals & other: SKUs by pack type, 2023

Baby wet meals & other: SKUs by pack size, 2023

Baby wet meals & other: brand price positioning analysis, 2023

Baby wet meals & other: manufacturer shares, value & volume, %, 2017–23

Baby wet meals & other: manufacturer & brand shares, value %, 2017–23

Baby wet meals & other: manufacturer & brand shares, volume %, 2017–23

Baby finger food: SKUs by pack type, 2023

Baby finger food: SKUs by pack size, 2023

Baby finger food: brand price positioning analysis, 2023

Baby finger food: manufacturer shares, value & volume, %, 2017–23

Baby finger food: manufacturer & brand shares, value %, 2017–23

Baby finger food: manufacturer & brand shares, volume %, 2017–23

Baby drinks: SKUs by pack type, 2023

Baby drinks: SKUs by pack size, 2023

Baby drinks: brand price positioning analysis, 2023

Baby drinks: manufacturer shares, value & volume, %, 2017–23

Baby drinks: manufacturer & brand shares, value %, 2017–23

Baby drinks: manufacturer & brand shares, volume %, 2017–23

Baby milks & cereals: trends in imports (volume), 2015–22

Baby milks & cereals: trends in imports (value), 2015–22

Imports of baby milks & cereals by country of origin (volume), 2020–22

Imports of baby milks & cereals by country of origin (value), 2020–22

Other baby food: trends in imports (volume), 2015–22

Other baby food: trends in imports (value), 2015–22

Imports of other baby food by country of origin (volume), 2020–22

Imports of other baby food by country of origin (value), 2020–22

Baby milks & cereals: trends in exports (volume), 2015–22

Baby milks & cereals: trends in exports (value), 2015–22

Exports of baby milks & cereals by country of destination (volume), 2020–22

Exports of baby milks & cereals by country of destination (value), 2020–22

Other baby food: trends in exports (volume), 2015–22

Other baby food: trends in exports (value), 2015–22

Exports of other baby food by country of destination (volume), 2020–22

Exports of other baby food by country of destination (value), 2020–22

Baby food: sales by outlet type, % value, 2017–23

Baby food: sales by type of food & outlet type, % value, 2023

Baby food: sales by channel, 2012, 2014, and 2016–17

Baby population, number of babies (’000), 2008–29

Baby food: market value, current prices ($ million), 2017–23

Baby food: market value, constant prices, 2017–23

Baby food: market volume, million kg, 2017–23

Baby food: PCE, current prices ($), 2017–23

Baby food: PCE, constant prices, 2017–23

Baby food: PCC, kg, 2017–23

Baby milks: category segmentation, value & volume, 2017–23

Baby food: market value forecasts, current prices ($ million), 2023–29

Baby food: market value forecasts, constant prices, 2023–29

Baby food: market volume forecasts, million kg, 2023–29

Baby food: PCE forecasts, current prices ($), 2023–29

Baby food: PCE forecasts, constant prices, 2023–29

Baby food: PCC forecasts, kg, 2023–29

Exchange rates: LCU per $, 2017–23

Exchange rates: LCU per $, 2024–29

SKUs allocation by product type

Category definitions

Terminology definitions

Figures

Netherlands’ value and volume shares in the global and the Western European baby food sectors, 2023–28

Netherlands compared with the other leading countries in terms of market share, growth, and competitive landscape

PCC comparison – Netherlands, Western Europe, and global, 2018–28

PCE comparison – Netherlands, Western Europe, and global, 2018–28

Purchasing criteria for baby food, 2016

Netherlands : In light of the rising cost of living, how have your shopping habits changed for baby care and child care products?

Netherlands : What is your choice of pack size in the baby care and child care products category?

Netherlands : How likely are you to trust recommendations from a virtual assistant (e.g. using artificial intelligence) to buy baby care and child care products?

Netherlands : How important are each of the following features when deciding to make a purchase?

Baby food: sector size (value), 2017–23

Baby food: sector size (volume), 2017–23

Market size and growth analysis by value and volume, baby food sector, 2017–29

Baby food: manufacturer shares, value %, 2023

Baby food: manufacturer shares, volume %, 2023

Baby food: manufacturer shares by category, % value, 2023

Market size and growth analysis by value and volume, baby milks category, 2017–29

Baby milks: PCE & PCC, 2017–23

Baby milks: PCE & PCC by age group, 2017–23

Baby milks: segmentation, value, and volume, 2017–23

Market size and growth analysis by value and volume, baby cereals & dry meals category, 2017–29

Baby cereals & dry meals: PCE & PCC, 2017–23

Market size and growth analysis by value and volume, baby wet meals & other category, 2017–29

Baby wet meals & other: PCE & PCC, 2017–23

Market size and growth analysis by value and volume, baby finger food category, 2017–29

Baby finger food: PCE & PCC, 2017–23

Market size and growth analysis by value and volume, baby drinks category, 2017–29

Baby drinks: PCE & PCC, 2017–23

Share of key distribution channels (in value terms) – baby food, 2023

Key distribution channel share by category (in value terms), 2023

GDP at current prices (EUR billion)

Real GDP growth rate (%)

Consumer price inflation (%)

Unemployment rate (%)

Frequently asked questions

Netherlands Baby Food Market Size and Share by Categories, Distribution and Forecast to 2029 standard reports
Currency USD
$2,450

Can be used by individual purchaser only

$7,350

Can be shared globally by unlimited users within the purchasing corporation e.g. all employees of a single company


Undecided about purchasing this report?

Enquire Before Buying Request a Free Sample

Get in touch to find out about multi-purchase discounts

reportstore@globaldata.com
Tel +44 20 7947 2745

Every customer’s requirement is unique. With over 220,000 construction projects tracked, we can create a tailored dataset for you based on the types of projects you are looking for. Please get in touch with your specific requirements and we can send you a quote.

Sample Report

Netherlands Baby Food Market Size and Share by Categories, Distribution and Forecast to 2029 was curated by the best experts in the industry and we are confident about its unique quality. However, we want you to make the most beneficial decision for your business, so we offer free sample pages to help you:

  • Assess the relevance of the report
  • Evaluate the quality of the report
  • Justify the cost

Download your copy of the sample report and make an informed decision about whether the full report will provide you with the insights and information you need.

Below is a sample report to understand what you are buying

See what our customers are saying

“The GlobalData platform is our go-to tool for intelligence services. GlobalData provides an easy way to access comprehensive intelligence data around multiple sectors, which essentially makes it a one-for-all intelligence platform, for tendering and approaching customers.

GlobalData is very customer orientated, with a high degree of personalised services, which benefits everyday use. The highly detailed project intelligence and forecast reports can be utilised across multiple departments and workflow scopes, from operational to strategic level, and often support strategic decisions. GlobalData Analytics and visualisation solutions has contributed positively when preparing management presentations and strategic papers.”

Business Intelligence & Marketing Manager, SAL Heavy Lift

“COVID-19 has caused significant interference to our business and the COVID-19 intelligence from GlobalData has helped us reach better decisions around strategy. These two highlights have helped enormously to understand the projections into the future concerning our business units, we also utilise the project database to source new projects for Liebherr-Werk to use as an additional source to pitch for new business.”

Market Analyst & Management, Liebherr-Werk

Your daily news has saved me a lot of time and keeps me up-to-date with what is happening in the market, I like that you almost always have a link to the source origin. We also use your market data in our Strategic Business Process to support our business decisions. By having everything in one place on the Intelligence Center it has saved me a lot of time versus looking on different sources, the alert function also helps with this.

Head of Key Accounts, Saab AB

Having used several other market research companies, I find that GlobalData manages to provide that ‘difficult-to-get’ market data that others can’t, as well as very diverse and complete consumer surveys.

Marketing Intelligence Manager, Portugal Foods

Our experience with GlobalData has been very good, from the platform itself to the people. I find that the analysts and the account team have a high level of customer focus and responsiveness and therefore I can always rely on. The platform is more holistic than other providers. It is convenient and almost like a one stop shop. The pricing suite is highly competitive and value for our organisation.

I like reports that inform new segments such as the analysis on generation Z, millennials, the impact of COVID 19 to our banking customers and their new channel habits. Secondly the specialist insight on affluent sector significantly increases our understanding about this group of customers. The combination of those give us depth and breadth of the evolving market.

I’m in the business of answering and helping people make decisions so with the intelligence center I can do that, effectively and efficiently. I can share quickly key insights that answer and satisfy our country stakeholders by giving them many quality studies and primary research about competitive landscape beyond the outlook of our bank. It helps me be seen as an advisory partner and that makes a big difference. A big benefit of our subscription is that no one holds the whole data and because it allows so many people, so many different parts of our organisation have access, it enables all teams to have the same level of knowledge and decision support.

Head of Customer Insight and Research, Standard Chartered

“I know that I can always rely on Globaldata’s work when I’m searching for the right consumer and market insights. I use Globaldata insights to understand the changing market & consumer landscape and help create better taste & wellbeing solutions for our customers in food, beverage and healthcare industries.

Globaldata has the right data and the reports are of very high quality compared to your competitors. Globaldata not only has overall market sizes & consumer insights on food & beverages but also provides insights at the ingredient & flavour level. That is key for B2B companies like Givaudan. This way we understand our customers’ business and also gain insight to our unique industry”

Head of Consumer Sensory Insights, Givaudan

GlobalData provides a great range of information and reports on various sectors that is highly relevant, timely, easy to access and utilise.  The reports and data dashboards help engagement with clients; they provide valuable industry and market insights that can enrich client conversations and can help in the shaping of value propositions. Moreover, using GlobalData products has helped increase my knowledge of the finance sector, the players within it, and the general threats and opportunities.

I find the consumer surveys that are carried out to be extremely beneficial and not something I have seen anywhere else. They provided an insightful view of why and which consumers take (or don’t) particular financial products. This can help shape conversations with clients to ensure they make the right strategic decisions for their business.

One of the challenges I have found is that data in the payments space is often piecemeal. With GD all of the data I need is in one place, but it also comes with additional market reports that provide useful extra context and information. Having the ability to set-up alerts on relevant movements in the industry, be it competitors or customers, and have them emailed directly to me, ensures I get early sight of industry activity and don’t have to search for news.

Senior Account Manager, TSYS
Go even deeper with GlobalData Intelligence Center

Every Company Report we produce is powered by the GlobalData Intelligence Center.

Subscribing to our intelligence platform means you can monitor developments at Netherlands Baby Food Market Size and Share by Categories, Distribution and Forecast to 2029 in real time.

  • Access a live Netherlands Baby Food Market Size and Share by Categories, Distribution and Forecast to 2029 dashboard for 12 months, with up-to-the-minute insights.
  • Fuel your decision making with real-time deal coverage and media activity.
  • Turn insights on financials, deals, products and pipelines into powerful agents of commercial advantage.