New Zealand Dairy & Soy Food – Market Assessment and Forecasts to 2025

Powered by

All the vital news, analysis, and commentary curated by our industry experts.

The New Zealand dairy & soy food market was valued at $1,301.2 million in 2020 and is projected to grow at a CAGR of more than 3% during the forecast period 2021-2025. Per capita consumption and per capita expenditure of dairy & soy food was higher in New Zealand than at the global and regional levels in 2020.

Milk was the largest category in 2020, while grain, nut, rice, seed milk alternatives​ are forecast to register the fastest value growth during 2020-2025. The category is also expected to gain the maximum market share in value terms during 2020-2025. Hypermarkets & supermarkets was the largest distribution channel in the New Zealand dairy & soy food sector, followed by convenience stores and food & drinks specialists.

Overview of New Zealand dairy & soy food marketOverview of New Zealand dairy & soy food market

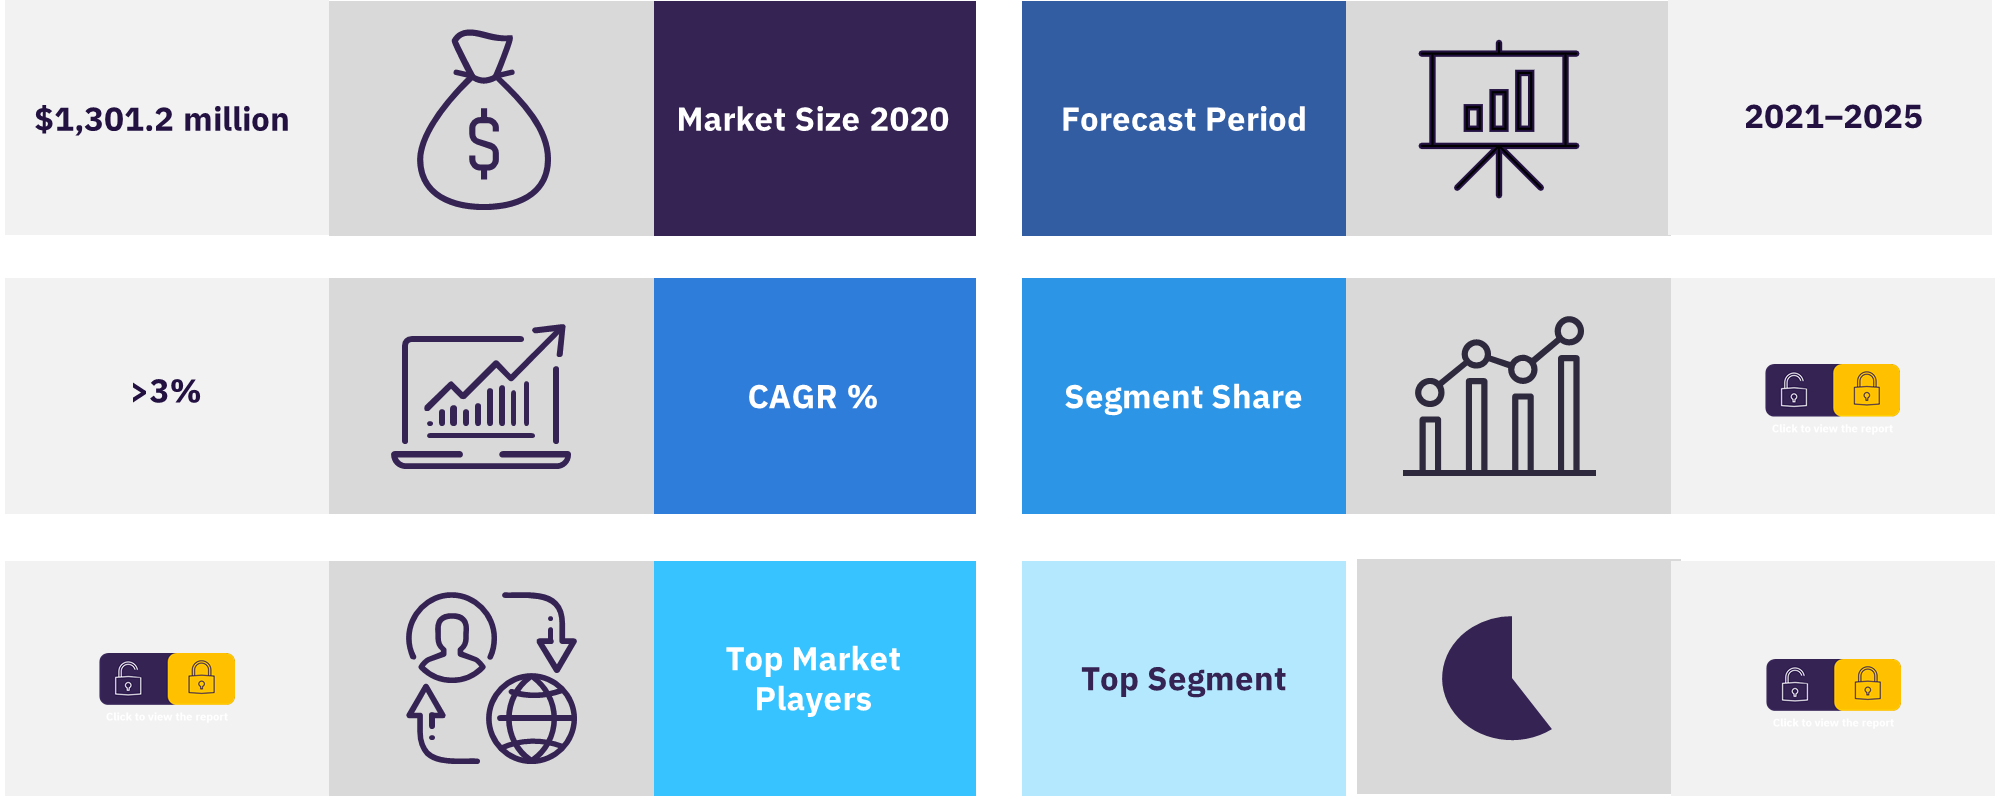
For more insights on this report, download a free report sample

What are the market dynamics in the dairy & soy food market in New Zealand?

Auckland emerged as the largest dairy & soy food market in New Zealand in 2020, followed by Wellington and Christchurch, in the same year. Milk was the leading category in volume terms across the leading cities in the New Zealand dairy & soy food sector in 2020. New Zealand ranks last in terms of fragmentation when compared to the leading countries in the region, with the top five companies accounting for a share of more than 60% in 2020.

Health & wellness attributes such as “food intolerance” and consumer benefits such as “health management” contributed the most to the growth of the health & wellness market in the New Zealand dairy & soy food sector during 2015-2020. Rigid plastics is the most used pack material in the New Zealand dairy & soy food sector, followed by paper & board and flexible packaging.

What are the different segments in the dairy & soy food market in New Zealand?

The different segments of dairy & soy food in New Zealand are butter & spreadable fats, cheese, cream, dairy-based & soy-based desserts, drinkable yogurt, grain, nut, rice, seed milk alternatives, milk, soymilk & soy drinks, and yogurt. Milk led the New Zealand dairy & soy food sector in terms of per capita consumption in 2020, followed by yogurt and butter & spreadable fats. Furthermore, the per capita consumption of butter & spreadable fats, cheese, cream, dairy-based & soy-based desserts, drinkable yogurt, grain, nut, rice, seed milk alternatives, milk, soymilk & soy drinks, and yogurt was higher in New Zealand compared to the regional and global level.

New Zealand dairy & soy food market, by segments

New Zealand dairy & soy food market, by segments

For more segment insights, download a free report sample

What are the key channels in dairy & soy food in New Zealand?

The key distribution channels in dairy & soy food market in New Zealand are hypermarkets & supermarkets, convenience stores, food & drinks specialists, e-retailers, cash & carries and warehouse club, and others. Hypermarkets & supermarkets was the leading distribution channel in the New Zealand dairy & soy food sector, with a value share of more than 60% in 2020.

New Zealand dairy & soy food market, by key distribution channelsNew Zealand dairy & soy food market, by key distribution channels

For more insights, download a free report sample

Who are the key players in the dairy & soy food market in New Zealand?

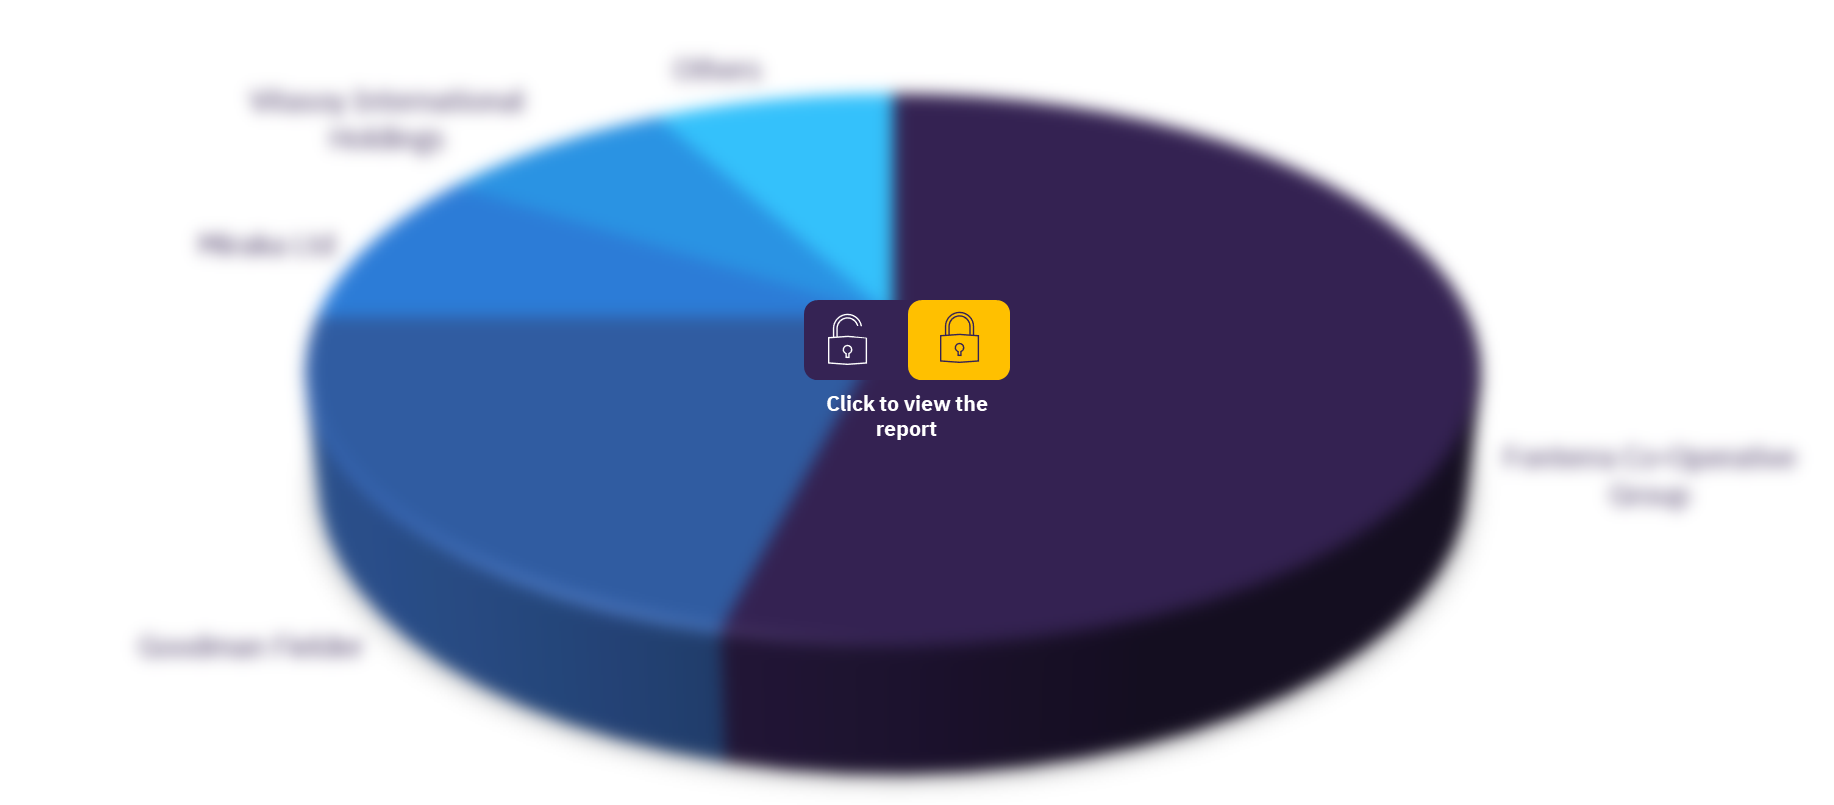
The leading key players in the market are Fonterra Co-Operative Group, Goodman Fielder, Miraka Ltd, Vitasoy International Holdings, and Dairyworks Limited. Fonterra Co-Operative Group, Goodman Fielder and Miraka Ltd. are the top three companies in the New Zealand dairy & soy food sector.

New Zealand dairy & soy food market, by key players

New Zealand dairy & soy food market, by key players

To know more about key players, download a free report sample

Market report scope

Market size (Year – 2020) $1,301.2 million
Growth rate – By Value CAGR of >3% from 2021-2025
Base year for estimation 2020
Forecast period 2021-2025
Distribution channels Hypermarkets & Supermarkets, Convenience Stores, Food & Drinks Specialists, Cash & Carries and Warehouse Club, E-Retailers, and Others
Segments Butter & Spreadable Fats, Cheese, Cream, Dairy-Based & Soy-Based Deserts, Drinkable Yogurt, Grain, Nut, Rice, Seed Milk Alternatives, Milk, Soymilk & Soy Drinks, and Yogurt
Key players Fonterra Co-Operative Group, Goodman Fielder, Miraka Ltd, Vitasoy International Holdings, and Dairyworks Limited

Scope

  • Sector data: Overall sector value and volume data with growth analysis for 2015-2025.
  • Category coverage: Value and growth analysis for butter & spreadable fats, cheese, cream, dairy-based & soy-based desserts, drinkable yogurt, fromage frais & quark, milk, soymilk & soy drinks and yogurt with inputs on individual segment share within each category and the change in their market share forecast for 2020-2025.
  • Leading players: Market share of companies (in value terms) and private labels (in value terms) in 2020.
  • Distribution data: Percentage of sales within each category through distribution channels such as cash & carries & warehouse clubs, convenience stores, department stores, food & drinks specialists, hypermarkets & supermarkets, e-retailers, “dollar stores”, variety stores & general merchandise retailers, vending machines, drug stores & pharmacies, health & beauty stores and other general retailers.
  • Packaging data: consumption breakdown for package materials and pack types in each category, in terms of percentage share of number of units sold. Pack material data for glass, flexible packaging, rigid plastics, paper & board and rigid metal; pack type for: jar, bag/sachet, tub, stand up pouch, carton – folding, can, carton – liquid, pillow pouch, bottle, cup, aerosol, tube, tray, film, wrapper, clamshell, box, foil and other pack type, closure type for: flip/snap top, screw top, prize off, twist off, plastic tie, foil, sports cap, film, cap, lever closure, crown and other closure types, primary outer types for: carton – folding, bag, sleeve and shrink wrap.

Reasons to Buy

  • Identify high potential categories and explore further market opportunities based on detailed value and volume analysis.
  • Existing and new players can analyze key distribution channels to identify and evaluate trends and opportunities.
  • Gain an understanding of the total competitive landscape based on detailed company share analysis to plan effective market positioning.
  • Our team of analysts has placed a significant emphasis on changes expected in the market that will provide a clear picture of the opportunities that can be tapped over the next five years, resulting in revenue expansion.
  • The packaging analysis report helps manufacturers, in identifying the most commonly used packaging materials in the sector.
  • Analysis on key macro-economic indicators such as real GDP, nominal GDP, consumer price index, household consumption expenditure, population (by age group, gender, rural-urban split, and employed people and unemployment rate. It also includes an economic summary of the country along with labor market and demographic trends.

Fonterra Co-Operative Group
Goodman Fielder
Miraka Ltd
Vitasoy International Holdings
Dairyworks Limited
Whitestone Cheese Ltd.
Lewis Road Creamery
Upfield
Dairyworks Limited
Mars Incorporated
Waimata Cheese Company
Tatua Corperative Daiiry Company Limited
Earth`s Own Food Company Inc.

Table of Contents

Table of Contents

Report Scope

Executive Summary

Part 1: Market Environment

Value and Volume Share of New Zealand in the Global and Asia-Pacific Markets

Growth Analysis of New Zealand Compared to Other Leading Countries in the Asia-Pacific Market

PCC and PCE of New Zealand Compared to Global and Asia-Pacific Market

Part 2: Sector Deep Dive

New Zealand Dairy & Soy Food Sector Snapshot

Market Size Analysis

Cross-Category Comparison – Value Growth Analysis and Category Winners and Losers

Cross-Category Comparison – Volume Growth Analysis and Category Winners and Losers

Part 3: Category Deep Dive

Per Capita Consumption Analysis by Category

Market Size Analysis – Category: Butter & Spreadable Fats

Segment-Level Analysis (in Value Terms) – Butter & Spreadable Fats

Segment-Level Analysis (in Volume Terms) – Butter & Spreadable Fats

Market Size Analysis – Category: Cheese

Segment-Level Analysis (in Value Terms) – Cheese

Segment-Level Analysis (in Volume Terms) – Cheese

Market Size Analysis – Category: Cream

Segment-Level Analysis (in Value Terms) – Cream

Segment-Level Analysis (in Volume Terms) – Cream

Market Size Analysis – Category: Dairy-Based & Soy-Based Desserts

Segment-Level Analysis (in Value Terms) – Dairy-Based & Soy-Based Desserts

Segment-Level Analysis (in Volume Terms) – Dairy-Based & Soy-Based Desserts

Market Size Analysis – Category: Drinkable Yogurt

Market Size Analysis – Category: Grain, Nut, Rice, Seed Milk Alternatives

Segment-Level Analysis (in Value Terms) – Grain, Nut, Rice, Seed Milk Alternatives

Segment-Level Analysis (in Volume Terms) – Grain, Nut, Rice, Seed Milk Alternatives

Market Size Analysis – Category: Milk

Segment-Level Analysis (in Value Terms) – Milk

Segment-Level Analysis (in Volume Terms) – Milk

Market Size Analysis – Category: Soymilk & Soy Drinks

Segment-Level Analysis (in Value Terms) – Soymilk & Soy Drinks

Segment-Level Analysis (in Volume Terms) – Soymilk & Soy Drinks

Market Size Analysis – Category: Yogurt

Part 4: Distribution Analysis

Channel Share Analysis

Part 5: Competitive Environment

Leading Companies – Value and Volume Shares

Brand Share Analysis of Top Five Companies

Brand Share Analysis of Top Five Companies by Category

Private Label Share Analysis by Category

Growth of Private Labels Compared to Branded Products

Degree of Consolidation/Fragmentation by Category

Part 6: Health & Wellness Analysis

Health & Wellness Analysis by Category

Health & Wellness Analysis by Product Attributes

Health & Wellness Analysis by Consumer Benefits

Cross Category Comparison – Products with H&W Claims Vs. Non-H&W Claims

Part 7: Packaging Analysis

Pack Material Growth Analysis

Pack Type Growth Analysis

Closure Type Growth Analysis

Primary Outer Type Growth Analysis

Part 8: City Deep Dive

Market Size Analysis of Top Ten Cities

Market Size Analysis of Top Ten Cities by Category

Leading Cities Contribution to Volume Growth

Part 9: Consumergraphics

Demographic Analysis

Methodology

Definitions

Appendix

Table

List of Tables

Leading Value Categories

Fastest-Growing Segments (Value), 2020

Cross-Category Comparison – By Value (2015-2025)

Cross-Category Comparison – By Volume (2015-2025)

Per Capita Consumption (by Category), New Zealand Compared to Asia-Pacific and Global Levels (in Kg), 2020

Segment-Level Analysis (in Value Terms) – Butter & Spreadable Fats

Segment-Level Analysis (in Volume Terms) – Butter & Spreadable Fats

Segment-Level Analysis (in Value Terms) – Cheese

Segment-Level Analysis (in Volume Terms) – Cheese

Segment-Level Analysis (in Value Terms) – Cream

Segment-Level Analysis (in Volume Terms) – Cream

Segment-Level Analysis (in Value Terms) – Dairy-Based & Soy-Based Desserts

Segment-Level Analysis (in Volume Terms) – Dairy-Based & Soy-Based Desserts

Segment-Level Analysis (in Value Terms) – Grain, Nut, Rice, Seed Milk Alternatives

Segment-Level Analysis (in Volume Terms) – Grain, Nut, Rice, Seed Milk Alternatives

Segment-Level Analysis (in Value Terms) – Milk

Segment-Level Analysis (in Volume Terms) – Milk

Segment-Level Analysis (in Value Terms) – Soymilk & Soy Drinks

Segment-Level Analysis (in Volume Terms) – Soymilk & Soy Drinks

Change in Distribution Share, 2015-2020

Top Five Companies Share By Brand (in Value and Volume Terms) in the Dairy & Soy Food Sector, 2020

Brand Shares of Top Five Companies (in Value and Volume Terms) by Category, 2020

Category Comparison – With H&W Claims and Non-H&W Claims, 2015-2020

Category Data, By Segment

Per Capita Consumption (in Kg), 2015-2025

Per Capita Expenditure (US$), 2015-2025

Dairy & Soy Food Sales Distribution in New Zealand – By Category (NZ$ Million), 2020

Brand Share (in Value and Volume Terms) in the Dairy & Soy Food Sector, 2020

Brand Share (in Value and Volume Terms) in the Dairy & Soy Food Sector, By Category, 2020

Key Health & Wellness Product Attributes Driving Sales in New Zealand, 2015-2025

Key Health & Wellness Consumer Benefits Driving Sales in New Zealand, 2015-2025

Pack Material (in Million Pack Units), 2015-2025

Pack Materials by Category (in Million Pack Units), 2020

Pack Type (in Million Pack Units), 2015-2025

Pack Types by Category (in Million Pack Units), 2020

Closure Type (in Million Pack Units), 2015-2025

Closure Types by Category (in Million Pack Units), 2020

Primary Outer Type (in Million Pack Units), 2015-2025

Primary Outer Types by Category (in Million Pack Units), 2020

Exchange Rates, 2015-2025

Value/Volume Change (NZ$ Million/Million Kg) At Segment Level

Figures

List of Figures

Value and Volume Share of New Zealand in the Global and Asia-Pacific Dairy & Soy Food Sector, 2020-2025

New Zealand Compared to the Other Top Countries in Terms of Market Share, Growth, and Competitive Landscape

PCC Comparison – New Zealand, Asia-Pacific, and Global, 2015-2025

PCE Comparison – New Zealand, Asia-Pacific, and Global, 2015-2025

Market Size and Growth Analysis by Value and Volume, Dairy & Soy Food Sector, 2015-2025

Cross-Category Comparison – Value Growth Analysis and Category Winners and Losers

Cross-Category Comparison – Volume Growth Analysis and Category Winners and Losers

Market Size and Growth Analysis by Value and Volume, Butter & Spreadable Fats Category, 2015-2025

Market Size and Growth Analysis by Value and Volume, Cheese Category, 2015-2025

Market Size and Growth Analysis by Value and Volume, Cream Category, 2015-2025

Market Size and Growth Analysis by Value and Volume, Dairy-Based & Soy-Based Desserts Category, 2015-2025

Market Size and Growth Analysis by Value and Volume, Drinkable Yogurt Category, 2015-2025

Market Size and Growth Analysis by Value and Volume, Grain, Nut, Rice, Seed Milk Alternatives Category, 2015-2025

Market Size and Growth Analysis by Value and Volume, Milk Category, 2015-2025

Market Size and Growth Analysis by Value and Volume, Soymilk & Soy Drinks Category, 2015-2025

Market Size and Growth Analysis by Value and Volume, Yogurt Category, 2015-2025

Share of Key Distribution Channels (in Value Terms) – Dairy & Soy Food, 2020

Key Distribution Channel Share by Category (in Value Terms), 2020

Leading Companies (in Value and Volume Terms) in the Dairy & Soy Food Sector, 2020

Private Label Penetration by Category (in Value Terms), 2020

Growth Analysis, Private Label and Brands, 2015-2020

Category-Wise Consolidation/Fragmentation (in Value Terms) – Dairy & Soy Food , 2020

Prominence of Health & Wellness Claims by Category, US$ Million, 2015-2020

Contribution of Health & Wellness by Product Attributes, US$ Million, 2015-2020

Contribution of Health & Wellness by Consumer Benefits, US$ Million, 2015-2020

Key Pack Materials in the New Zealand Dairy & Soy Food Sector by Percentage Share of Pack Units, 2020

Annual Growth Rate by Key Pack Material, 2015-2025

Use of Pack Material by Category (in Pack Units), 2020

Key Pack Types in the New Zealand Dairy & Soy Food Sector by Percentage Share of Pack Units, 2020

Annual Growth Rate by Key Pack Type, 2015-2025

Use of Pack Type by Category (in Pack Units), 2020

Key Closure Types in the New Zealand Dairy & Soy Food Sector by Percentage Share of Pack Units, 2020

Annual Growth Rate by Key Closure Type, 2015-2025

Use of Closure Type by Category (in Pack Units), 2020

Key Primary Outer Types in the New Zealand Dairy & Soy Food Sector by Percentage Share of Pack Units, 2020

Annual Growth Rate by Key Primary Outer Type, 2015-2025

Use of Primary Outer Type by Category (in Pack Units), 2020

Volume Growth Analysis of Top 10 Cities (Million Kg), 2015-2020

Leading Cities’ Contribution to Volume Change, 2015-2020

Demographic Analysis

List of 109 Countries Analyzed to Identify the High-Potential Countries in Different Regions

Frequently asked questions

New Zealand Dairy & Soy Food – Market Assessment and Forecasts to 2025 standard reports
Currency USD
$875

Can be used by individual purchaser only

$2,625

Can be shared globally by unlimited users within the purchasing corporation e.g. all employees of a single company


Undecided about purchasing this report?

Enquire Before Buying Request a Free Sample

Get in touch to find out about multi-purchase discounts

reportstore@globaldata.com
Tel +44 20 7947 2745

Every customer’s requirement is unique. With over 220,000 construction projects tracked, we can create a tailored dataset for you based on the types of projects you are looking for. Please get in touch with your specific requirements and we can send you a quote.

Sample Report

New Zealand Dairy & Soy Food – Market Assessment and Forecasts to 2025 was curated by the best experts in the industry and we are confident about its unique quality. However, we want you to make the most beneficial decision for your business, so we offer free sample pages to help you:

  • Assess the relevance of the report
  • Evaluate the quality of the report
  • Justify the cost

Download your copy of the sample report and make an informed decision about whether the full report will provide you with the insights and information you need.

Below is a sample report to understand what you are buying

See what our customers are saying

“The GlobalData platform is our go-to tool for intelligence services. GlobalData provides an easy way to access comprehensive intelligence data around multiple sectors, which essentially makes it a one-for-all intelligence platform, for tendering and approaching customers.

GlobalData is very customer orientated, with a high degree of personalised services, which benefits everyday use. The highly detailed project intelligence and forecast reports can be utilised across multiple departments and workflow scopes, from operational to strategic level, and often support strategic decisions. GlobalData Analytics and visualisation solutions has contributed positively when preparing management presentations and strategic papers.”

Business Intelligence & Marketing Manager, SAL Heavy Lift

“COVID-19 has caused significant interference to our business and the COVID-19 intelligence from GlobalData has helped us reach better decisions around strategy. These two highlights have helped enormously to understand the projections into the future concerning our business units, we also utilise the project database to source new projects for Liebherr-Werk to use as an additional source to pitch for new business.”

Market Analyst & Management, Liebherr-Werk

Your daily news has saved me a lot of time and keeps me up-to-date with what is happening in the market, I like that you almost always have a link to the source origin. We also use your market data in our Strategic Business Process to support our business decisions. By having everything in one place on the Intelligence Center it has saved me a lot of time versus looking on different sources, the alert function also helps with this.

Head of Key Accounts, Saab AB

Having used several other market research companies, I find that GlobalData manages to provide that ‘difficult-to-get’ market data that others can’t, as well as very diverse and complete consumer surveys.

Marketing Intelligence Manager, Portugal Foods

Our experience with GlobalData has been very good, from the platform itself to the people. I find that the analysts and the account team have a high level of customer focus and responsiveness and therefore I can always rely on. The platform is more holistic than other providers. It is convenient and almost like a one stop shop. The pricing suite is highly competitive and value for our organisation.

I like reports that inform new segments such as the analysis on generation Z, millennials, the impact of COVID 19 to our banking customers and their new channel habits. Secondly the specialist insight on affluent sector significantly increases our understanding about this group of customers. The combination of those give us depth and breadth of the evolving market.

I’m in the business of answering and helping people make decisions so with the intelligence center I can do that, effectively and efficiently. I can share quickly key insights that answer and satisfy our country stakeholders by giving them many quality studies and primary research about competitive landscape beyond the outlook of our bank. It helps me be seen as an advisory partner and that makes a big difference. A big benefit of our subscription is that no one holds the whole data and because it allows so many people, so many different parts of our organisation have access, it enables all teams to have the same level of knowledge and decision support.

Head of Customer Insight and Research, Standard Chartered

“I know that I can always rely on Globaldata’s work when I’m searching for the right consumer and market insights. I use Globaldata insights to understand the changing market & consumer landscape and help create better taste & wellbeing solutions for our customers in food, beverage and healthcare industries.

Globaldata has the right data and the reports are of very high quality compared to your competitors. Globaldata not only has overall market sizes & consumer insights on food & beverages but also provides insights at the ingredient & flavour level. That is key for B2B companies like Givaudan. This way we understand our customers’ business and also gain insight to our unique industry”

Head of Consumer Sensory Insights, Givaudan

GlobalData provides a great range of information and reports on various sectors that is highly relevant, timely, easy to access and utilise.  The reports and data dashboards help engagement with clients; they provide valuable industry and market insights that can enrich client conversations and can help in the shaping of value propositions. Moreover, using GlobalData products has helped increase my knowledge of the finance sector, the players within it, and the general threats and opportunities.

I find the consumer surveys that are carried out to be extremely beneficial and not something I have seen anywhere else. They provided an insightful view of why and which consumers take (or don’t) particular financial products. This can help shape conversations with clients to ensure they make the right strategic decisions for their business.

One of the challenges I have found is that data in the payments space is often piecemeal. With GD all of the data I need is in one place, but it also comes with additional market reports that provide useful extra context and information. Having the ability to set-up alerts on relevant movements in the industry, be it competitors or customers, and have them emailed directly to me, ensures I get early sight of industry activity and don’t have to search for news.

Senior Account Manager, TSYS
Go even deeper with GlobalData Intelligence Center

Every Company Report we produce is powered by the GlobalData Intelligence Center.

Subscribing to our intelligence platform means you can monitor developments at New Zealand Dairy & Soy Food – Market Assessment and Forecasts to 2025 in real time.

  • Access a live New Zealand Dairy & Soy Food – Market Assessment and Forecasts to 2025 dashboard for 12 months, with up-to-the-minute insights.
  • Fuel your decision making with real-time deal coverage and media activity.
  • Turn insights on financials, deals, products and pipelines into powerful agents of commercial advantage.