Norway Power Market Trends and Analysis by Capacity, Generation, Transmission, Distribution, Regulations, Key Players and Forecast to 2035

Powered by

All the vital news, analysis, and commentary curated by our industry experts.

Norway Power Market Report Overview

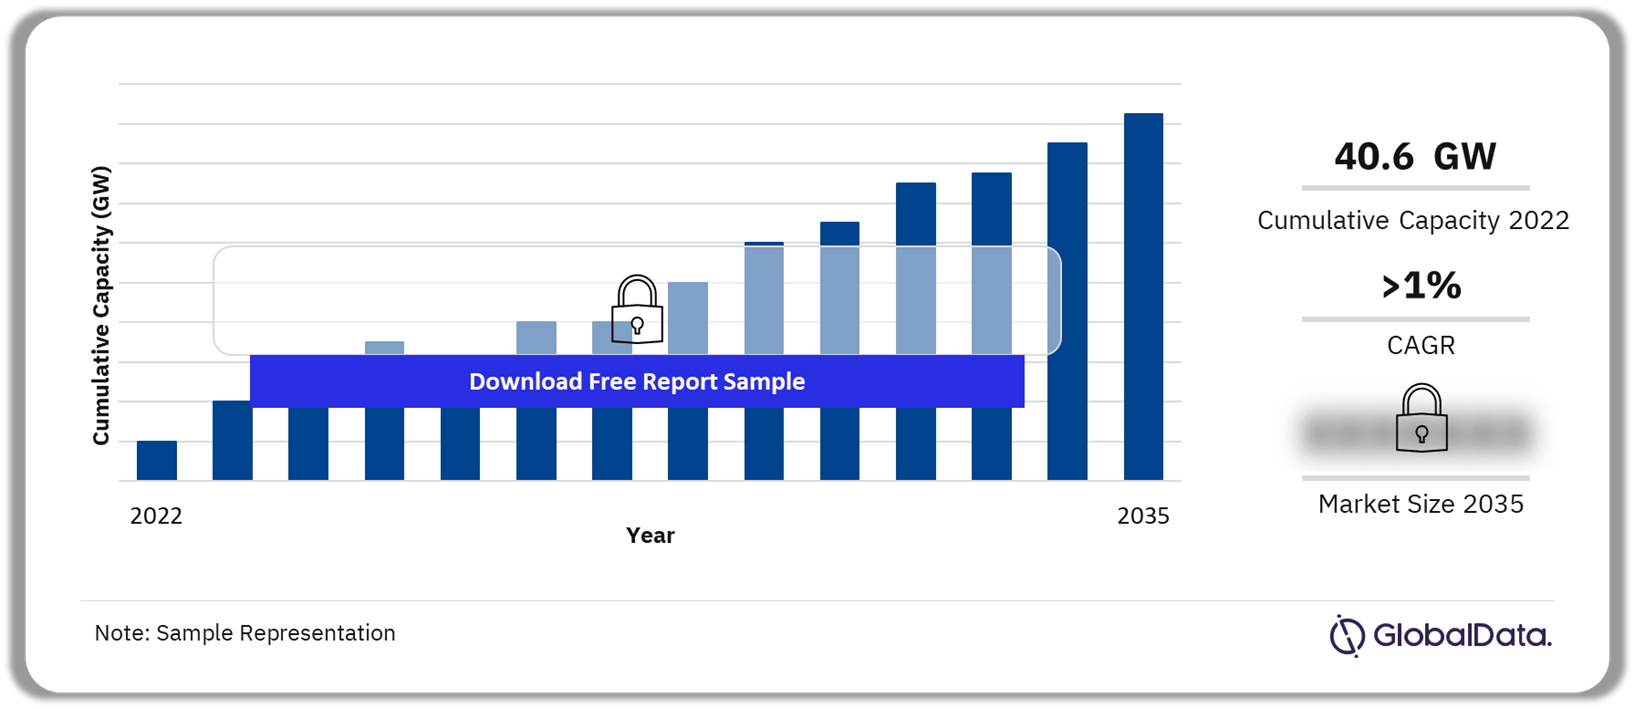
The cumulative installed capacity in the Norway power market was 40.6 GW in 2022. In 2022, hydropower dominated the capacity segment, followed by renewable and thermal power. The installed capacity is expected to grow at a CAGR of more than 1% during 2022-2035.

Norway’s electricity sector is currently self-sufficient, and the country has been able to easily maneuver through the recent global rise in energy prices due to its well-developed hydropower capacity and abundant reserves of oil and gas.

Norway Power Market Outlook, 2022-2035 (GW)

Norway Power Market Outlook, 2022-2035 (GW)

Buy the Full Report for More Insights on the Norway Power Market Forecast

Download a Free Report Sample

The Norway power market research report discusses the power market structure of Norway and provides historical and forecast numbers for capacity, generation, and consumption up to 2035. Detailed analysis of the country’s power market regulatory structure, competitive landscape, and a list of major power plants are also covered in the report. Furthermore, the report includes a snapshot of the power sector in the country on broad parameters of macroeconomics, supply security, generation infrastructure, transmission and distribution infrastructure, electricity import and export scenario, degree of competition, regulatory scenario, and future potential. Our analysts have also included data on deals in the country’s power sector in the report.

Cumulative Installed Capacity (2022) 40.6 GW
CAGR (2022-2035) >1%
Historical Period 2010-2022
Forecast Period 2023-2035
Key Sectors ·        Industrial Sector

·        Residential Sector

·        Commercial Sector

·        Transport Sector

Key Deal Types ·        Partnerships

·        Debt Offerings

·        Acquisitions

·        Venture Financing

·        Asset Transactions

Key Companies ·        Statkraft AS

·        Norsk Hydro ASA

·        Lyse AS

Enquire & Decide Discover the perfect solution for your business needs. Enquire now and let us help you make an informed decision before making a purchase.

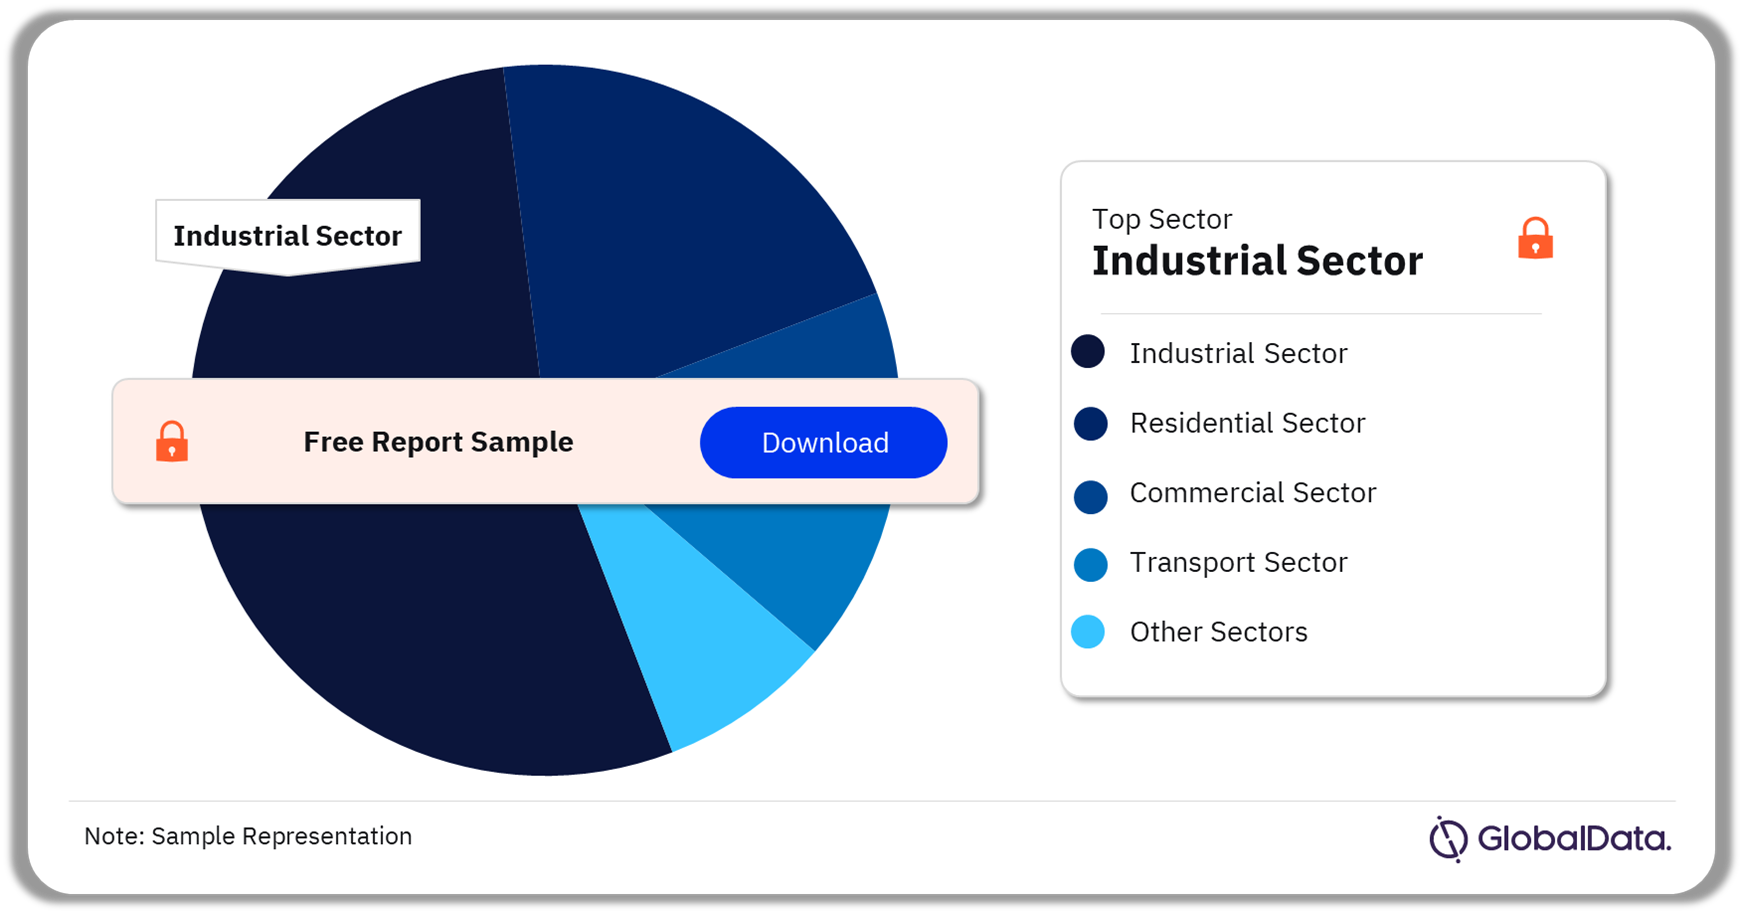
Norway Power Market Segmentation by Sectors

The key sectors in the Norway power market are the industrial sector, residential sector, commercial sector, transport sector, and other sectors. In 2022, the industrial sector accounted for the highest share of power consumption in the Norway power market, followed by the residential sector and the commercial sector.

Norway Power Generation by Sectors, 2022 (%)

Norway Power Generation by Sectors, 2022 (%)

Buy the Full Report for More Insights on Sectors in the Norway Power Market

Download a Free Report Sample

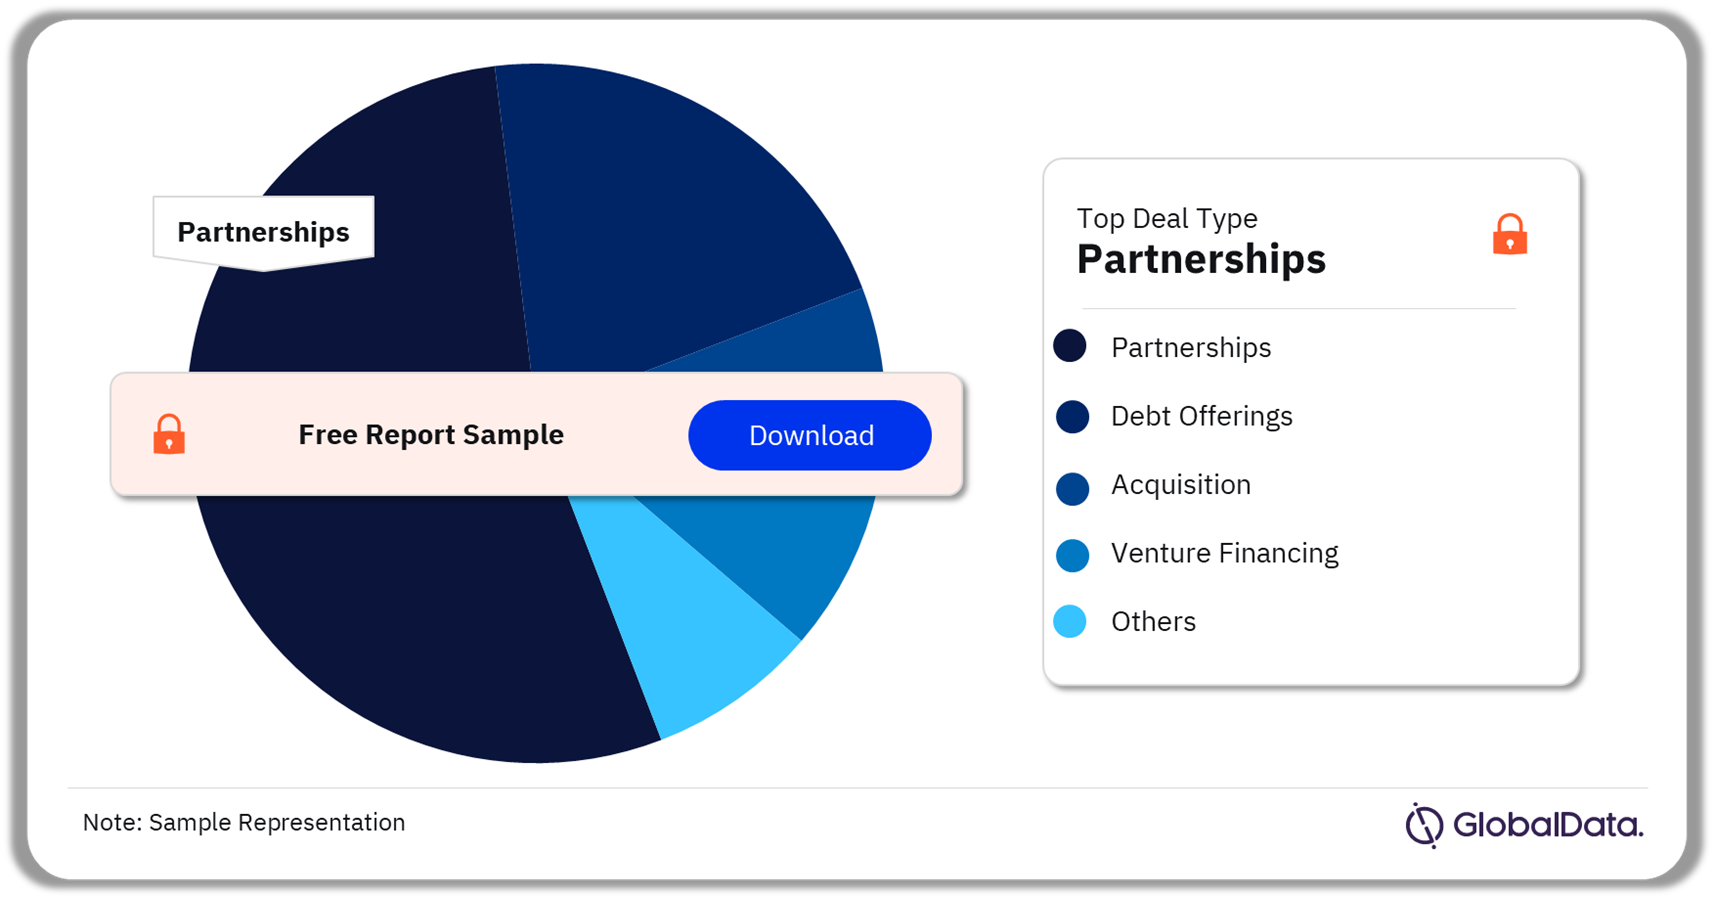
Norway Power Market Segmentation by Deal Types

The key deal types recorded in the Norway power market in 2022 are partnerships, debt offerings, acquisitions, venture financing, and asset transactions, among others. Partnerships dominated Norway’s power market deals in 2022, followed by debt offerings.

Norway Power Market Analysis by Deal Types, 2022 (%)

Norway Power Market Analysis by Deal Types, 2022 (%)

Buy the Full Report for More Insights on Deal Types in the Norway Power Market

Download a Free Report Sample

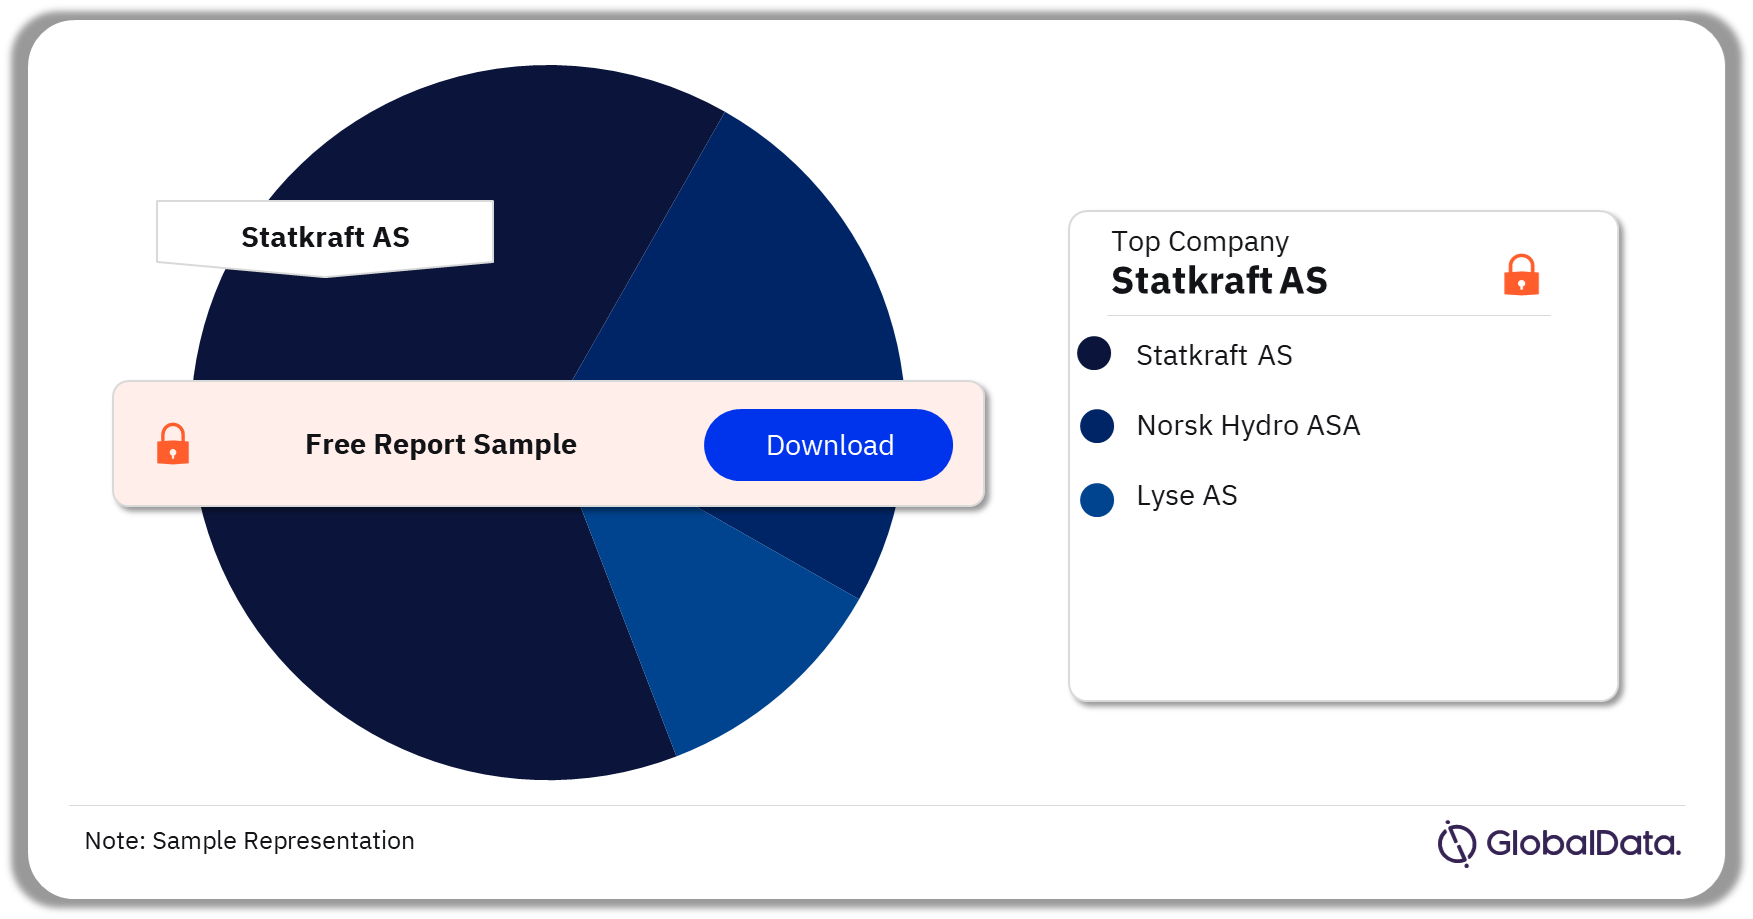
Norway Power Market – Competitive Landscape

A few of the leading companies in the Norway power market are:

  • Statkraft AS
  • Norsk Hydro ASA
  • Lyse AS

In 2022, Norway’s power generation market was dominated by Statkraft AS.

Statkraft AS: The company develops hydroelectric power plants in emerging markets outside Europe. They also plan, develop, construct, and operate energy facilities and conduct physical and financial energy trading in European energy exchanges. The company’s services include analysis and consulting services, and energy services, among others. It serves customers in Norway, Germany, Sweden, the UK, Albania, Brazil, Peru, and other countries. It is headquartered in Oslo, Norway.

Norway Power Market Analysis by Companies, 2022 (%)

Norway Power Market Analysis by Companies, 2022 (%)

Buy the Full Report for More Company Insights into the Norway Power Market

Download a Free Report Sample

Segments Covered in the Report

Norway Power Type Outlook (Value, 2010-2035, GW)

  • Industrial Sector
  • Residential Sector
  • Commercial Sector
  • Transport Sector

Norway Power Market Deal Type Outlook (Value, 2010-2035, GW)

  • Partnerships
  • Debt Offerings
  • Acquisitions
  • Venture Financing
  • Asset Transactions

Scope

The Norway power market report includes the following:

  • Snapshot of the country’s power sector across parameters, including macroeconomics, supply security, generation infrastructure, transmission infrastructure, electricity import and export scenario, degree of competition, regulatory scenario, and future potential of the power sector.
  • Statistics for installed capacity, generation, and consumption from 2010 to 2022, and forecast for the next 13 years to 2035.
  • Capacity, generation, and major power plants by technology.
  • Data on leading active and upcoming power plants.
  • Information on transmission and distribution infrastructure, and electricity imports and exports.
  • Policy and regulatory framework governing the market.
  • Detailed analysis of top market participants, including market share analysis and SWOT analysis.

Reasons to Buy

  • Identify market opportunities and business plan strategies through our comprehensive analysis of investment opportunities in the country’s power sector.
  • Identify key factors driving investment opportunities in the country’s power sector.
  • Optimize strategic decision-making through our historical and forecast data.
  • Create accurate data governance by understanding the latest regulatory events.
  • Understand the maximum advantage of the industry’s growth potential.
  • Identify key partners and business development avenues.
  • Identify key strengths and weaknesses of important market participants.
  • Respond to your competitors’ business structure, strategy, and prospects.

Statkraft AS
Hafslund E-Co AS
Norsk Hydro ASA
Lyse AS
Agder Energi AS

Table of Contents

  • 1. Table of Contents
  • 2. List of Figures
  • 3. List of Tables

    • 3.1. Executive Summary

      • 3.1.1. Norway must look to develop renewable capacity to ensure supply security in the long run
      • 3.1.2. Statkraft continues to dominate the generation market

  • 4. Introduction

    • 4.1. Norway Power Market
    • 4.2. GlobalData Report Guidance

  • 5. Norway Power Market, Snapshot

    • 5.1. Country Summary
    • 5.2. Macroeconomic Factors
    • 5.3. Supply Security
    • 5.4. Opportunities
    • 5.5. Challenges
    • 5.6. Geopolitical crisis

  • 6. Norway Power Market, Market Analysis

    • 6.1. Market Structure
    • 6.2. Key Market Players
    • 6.3. Financial Deals

      • 6.3.1. Deal Value and Volume, 2010–2022
      • 6.3.2. Deals by Type, 2022

    • 6.4. Norway Power Market, Demand Structure

      • 6.4.1. Power Consumption by Sector, 2022

  • 7. Norway Power Market, Regulatory Scenario

    • 7.1. Renewable Energy Market, Overview
    • 7.2. Policy Snapshot
    • 7.3. Renewable Energy Targets
    • 7.4. Energy Act
    • 7.5. National Climate Plan

      • 7.5.1. Norway’s long-term low-emission strategy for 2050

    • 7.6. Climate Change Act
    • 7.7. Hydrogen Energy
    • 7.8. Auctions
    • 7.9. Guarantees of Origin (GO)
    • 7.10. Energi21
    • 7.11. Watercourse Regulation Act
    • 7.12. Waterfall Rights Act
    • 7.13. Act on Offshore Renewable Energy Production (The Offshore Energy Act)
    • 7.14. Green Recovery Package
    • 7.15. Green Conversion Package

  • 8. Norway Power Market, Capacity and Generation

    • 8.1. Cumulative Capacity Share by Technology, 2022
    • 8.2. Total Power Capacity and Generation, 2010–2035
    • 8.3. Thermal Power Capacity and Generation, 2010–2035
    • 8.4. Hydropower Capacity and Generation, 2010–2035
    • 8.5. Renewable Power Capacity and Generation, 2010–2035

  • 9. Norway Power Market, Transmission and Distribution Overview

    • 9.1. Transmission Network
    • 9.2. Distribution Network
    • 9.3. Electricity Import and Export
    • 9.4. Grid Interconnection

  • 10. Norway Power Market, Major Generating Companies

    • 10.1. Statkraft AS

      • 10.1.1. Company Overview
      • 10.1.2. Business Description
      • 10.1.3. SWOT Overview

    • 10.2. Norsk Hydro ASA

      • 10.2.1. Company Overview
      • 10.2.2. Business Description
      • 10.2.3. SWOT Overview

    • 10.3. Lyse AS

      • 10.3.1. Company Overview

  • 11. Appendix

    • 11.1. Abbreviations
    • 11.2. Market Definitions

      • 11.2.1. Power
      • 11.2.2. Renewable Power
      • 11.2.3. Installed Capacity
      • 11.2.4. Electricity Generation
      • 11.2.5. Electricity Consumption

    • 11.3. Methodology

      • 11.3.1. Coverage
      • 11.3.2. Secondary Research
      • 11.3.3. Primary Research
      • 11.3.4. Modelling and Forecasting

  • 12. About GlobalData
  • 13. Contact Us

Table

Table 1: Power Market, Norway, Macroeconomic Factors, 2010–2030

Table 2: Policy Snapshot, Norway, 2022

Table 3: Power Market, Norway, Cumulative Capacity and Annual Generation, 2010–2035

Table 4: Power Market, Norway, Cumulative Capacity and Annual Generation Share by Technology, 2010–2035

Table 5: Thermal Power Market, Norway, Cumulative Capacity and Annual Generation, 2010–2035

Table 6: Thermal Power Market, Norway, Major Plants, 2022

Table 7: Hydropower Market, Norway, Cumulative Capacity and Annual Generation, 2010–2035

Table 8: Hydropower Market, Norway, Major Plants, 2022

Table 9: Renewable Power Market, Norway, Cumulative Capacity (GW), 2010–2035

Table 10: Renewable Power Market, Norway, Annual Generation (TWh), 2010–2035

Table 11: Renewable Power Market, Norway, Major Plants, 2022

Table 12: Power Market, Norway, Transmission Line Length (Ckm) by Voltage Level, 2010–2027

Table 13: Power Market, Norway, Distribution Line Length (Ckm) by Voltage Level, 2010–2025

Table 14: Power Market, Norway, Annual Electricity Import and Export (TWh), 2000–2022

Table 15: Power Market, Norway, Upcoming Interconnection Projects

Table 16: Abbreviations

Figures

Figure 1: Renewable Power Market, Norway, Cumulative Capacity, 2010–2035

Figure 2: Power Market, Norway, Market Share of Generation Companies (%), 2022

Figure 3: Power Market, Norway, Country Summary

Figure 4: Power Market, Norway, Macroeconomic Factors, 2010–2030

Figure 5: Power Market, Norway, Market Structure

Figure 6: Power Market, Norway, Market Share of Generation Companies (%), 2022

Figure 7: Power Market, Norway, Deal Value and Number of Deals, 2010–2022

Figure 8: Power Market, Norway, Deals by Type (%), 2022

Figure 9: Power Market, Norway, Annual Power Consumption, 2010–2035

Figure 10: Power Market, Norway, Power Consumption by Sector (%), 2022

Figure 11: Power Market, Norway, Cumulative Capacity Share by Technology (%), 2022

Figure 12: Power Market, Norway, Cumulative Capacity and Annual Generation, 2010–2035

Figure 13: Power Market, Norway, Capacity Share by Technology, 2010–2035

Figure 14: Power Market, Norway, Annual Generation Share by Technology, 2010–2035

Figure 15: Thermal Power Market, Norway, Cumulative Capacity and Annual Generation, 2010–2035

Figure 16: Hydropower Market, Norway, Cumulative Capacity and Annual Generation, 2010–2035

Figure 17: Renewable Power Market, Norway, Cumulative Capacity, 2010–2035

Figure 18: Renewable Power Market, Norway, Annual Generation, 2010–2035

Figure 19: Power Market, Norway, Annual Electricity Import and Export, 2000–2022

Frequently asked questions

Norway Power Market Trends and Analysis by Capacity, Generation, Transmission, Distribution, Regulations, Key Players and Forecast to 2035 standard reports
Currency USD
$2,500

Can be used by individual purchaser only

$7,500

Can be shared globally by unlimited users within the purchasing corporation e.g. all employees of a single company


Undecided about purchasing this report?

Enquire Before Buying Request a Free Sample

Get in touch to find out about multi-purchase discounts

reportstore@globaldata.com
Tel +44 20 7947 2745

Every customer’s requirement is unique. With over 220,000 construction projects tracked, we can create a tailored dataset for you based on the types of projects you are looking for. Please get in touch with your specific requirements and we can send you a quote.

Sample Report

Norway Power Market Trends and Analysis by Capacity, Generation, Transmission, Distribution, Regulations, Key Players and Forecast to 2035 was curated by the best experts in the industry and we are confident about its unique quality. However, we want you to make the most beneficial decision for your business, so we offer free sample pages to help you:

  • Assess the relevance of the report
  • Evaluate the quality of the report
  • Justify the cost

Download your copy of the sample report and make an informed decision about whether the full report will provide you with the insights and information you need.

Below is a sample report to understand what you are buying

See what our customers are saying

“The GlobalData platform is our go-to tool for intelligence services. GlobalData provides an easy way to access comprehensive intelligence data around multiple sectors, which essentially makes it a one-for-all intelligence platform, for tendering and approaching customers.

GlobalData is very customer orientated, with a high degree of personalised services, which benefits everyday use. The highly detailed project intelligence and forecast reports can be utilised across multiple departments and workflow scopes, from operational to strategic level, and often support strategic decisions. GlobalData Analytics and visualisation solutions has contributed positively when preparing management presentations and strategic papers.”

Business Intelligence & Marketing Manager, SAL Heavy Lift

“COVID-19 has caused significant interference to our business and the COVID-19 intelligence from GlobalData has helped us reach better decisions around strategy. These two highlights have helped enormously to understand the projections into the future concerning our business units, we also utilise the project database to source new projects for Liebherr-Werk to use as an additional source to pitch for new business.”

Market Analyst & Management, Liebherr-Werk

Your daily news has saved me a lot of time and keeps me up-to-date with what is happening in the market, I like that you almost always have a link to the source origin. We also use your market data in our Strategic Business Process to support our business decisions. By having everything in one place on the Intelligence Center it has saved me a lot of time versus looking on different sources, the alert function also helps with this.

Head of Key Accounts, Saab AB

Having used several other market research companies, I find that GlobalData manages to provide that ‘difficult-to-get’ market data that others can’t, as well as very diverse and complete consumer surveys.

Marketing Intelligence Manager, Portugal Foods

Our experience with GlobalData has been very good, from the platform itself to the people. I find that the analysts and the account team have a high level of customer focus and responsiveness and therefore I can always rely on. The platform is more holistic than other providers. It is convenient and almost like a one stop shop. The pricing suite is highly competitive and value for our organisation.

I like reports that inform new segments such as the analysis on generation Z, millennials, the impact of COVID 19 to our banking customers and their new channel habits. Secondly the specialist insight on affluent sector significantly increases our understanding about this group of customers. The combination of those give us depth and breadth of the evolving market.

I’m in the business of answering and helping people make decisions so with the intelligence center I can do that, effectively and efficiently. I can share quickly key insights that answer and satisfy our country stakeholders by giving them many quality studies and primary research about competitive landscape beyond the outlook of our bank. It helps me be seen as an advisory partner and that makes a big difference. A big benefit of our subscription is that no one holds the whole data and because it allows so many people, so many different parts of our organisation have access, it enables all teams to have the same level of knowledge and decision support.

Head of Customer Insight and Research, Standard Chartered

“I know that I can always rely on Globaldata’s work when I’m searching for the right consumer and market insights. I use Globaldata insights to understand the changing market & consumer landscape and help create better taste & wellbeing solutions for our customers in food, beverage and healthcare industries.

Globaldata has the right data and the reports are of very high quality compared to your competitors. Globaldata not only has overall market sizes & consumer insights on food & beverages but also provides insights at the ingredient & flavour level. That is key for B2B companies like Givaudan. This way we understand our customers’ business and also gain insight to our unique industry”

Head of Consumer Sensory Insights, Givaudan

GlobalData provides a great range of information and reports on various sectors that is highly relevant, timely, easy to access and utilise.  The reports and data dashboards help engagement with clients; they provide valuable industry and market insights that can enrich client conversations and can help in the shaping of value propositions. Moreover, using GlobalData products has helped increase my knowledge of the finance sector, the players within it, and the general threats and opportunities.

I find the consumer surveys that are carried out to be extremely beneficial and not something I have seen anywhere else. They provided an insightful view of why and which consumers take (or don’t) particular financial products. This can help shape conversations with clients to ensure they make the right strategic decisions for their business.

One of the challenges I have found is that data in the payments space is often piecemeal. With GD all of the data I need is in one place, but it also comes with additional market reports that provide useful extra context and information. Having the ability to set-up alerts on relevant movements in the industry, be it competitors or customers, and have them emailed directly to me, ensures I get early sight of industry activity and don’t have to search for news.

Senior Account Manager, TSYS
Go even deeper with GlobalData Intelligence Center

Every Company Report we produce is powered by the GlobalData Intelligence Center.

Subscribing to our intelligence platform means you can monitor developments at Norway Power Market Trends and Analysis by Capacity, Generation, Transmission, Distribution, Regulations, Key Players and Forecast to 2035 in real time.

  • Access a live Norway Power Market Trends and Analysis by Capacity, Generation, Transmission, Distribution, Regulations, Key Players and Forecast to 2035 dashboard for 12 months, with up-to-the-minute insights.
  • Fuel your decision making with real-time deal coverage and media activity.
  • Turn insights on financials, deals, products and pipelines into powerful agents of commercial advantage.