Pharmaceuticals Industry Deals and Trends in November 2021 – Partnerships, Licensing, Investments, Mergers and Acquisitions (M&A)

Powered by

All the vital news, analysis, and commentary curated by our industry experts.

The pharmaceutical and healthcare market reported 503 deals worth $47.5 billion in November 2021. The market registered an increase in the number of mergers and acquisitions (M&As) including asset purchases.  Capital raising, through equity and debt offerings, reported an increase in the number of deals and a decrease in deal values.

The Pharmaceuticals Industry Deals and Trends report provides data and trend analysis on partnerships, licensing, mergers and acquisitions (M&As), and financings in the pharmaceutical industry. The report portrays detailed comparative data on the number of deals and their value in the last six months subdivided by deal types, various therapy areas, and geographies. Additionally, the report provides information on the top financial advisory firms in the pharmaceutical industry.

Pharmaceuticals Market Segmentation by Regions

The key regions in the pharmaceuticals and healthcare market are North America, Europe, Asia Pacific, and the rest of the world. North America reported a decrease in the number of deals and deal value in November 2021.

Pharmaceuticals Market Segmentation by Deal Types

The key deal types in the pharmaceuticals and healthcare market are PE/VC, partnerships, M&A, licensing agreements, and capital raising (equity/debt offerings).  PE/VC segment recorded the highest number of deals, followed by the capital raisings (equity and debt offerings) segment.

Pharmaceuticals and Healthcare Market Analysis, by Deal Types

Pharmaceuticals and Healthcare Market Analysis, by Deal Types

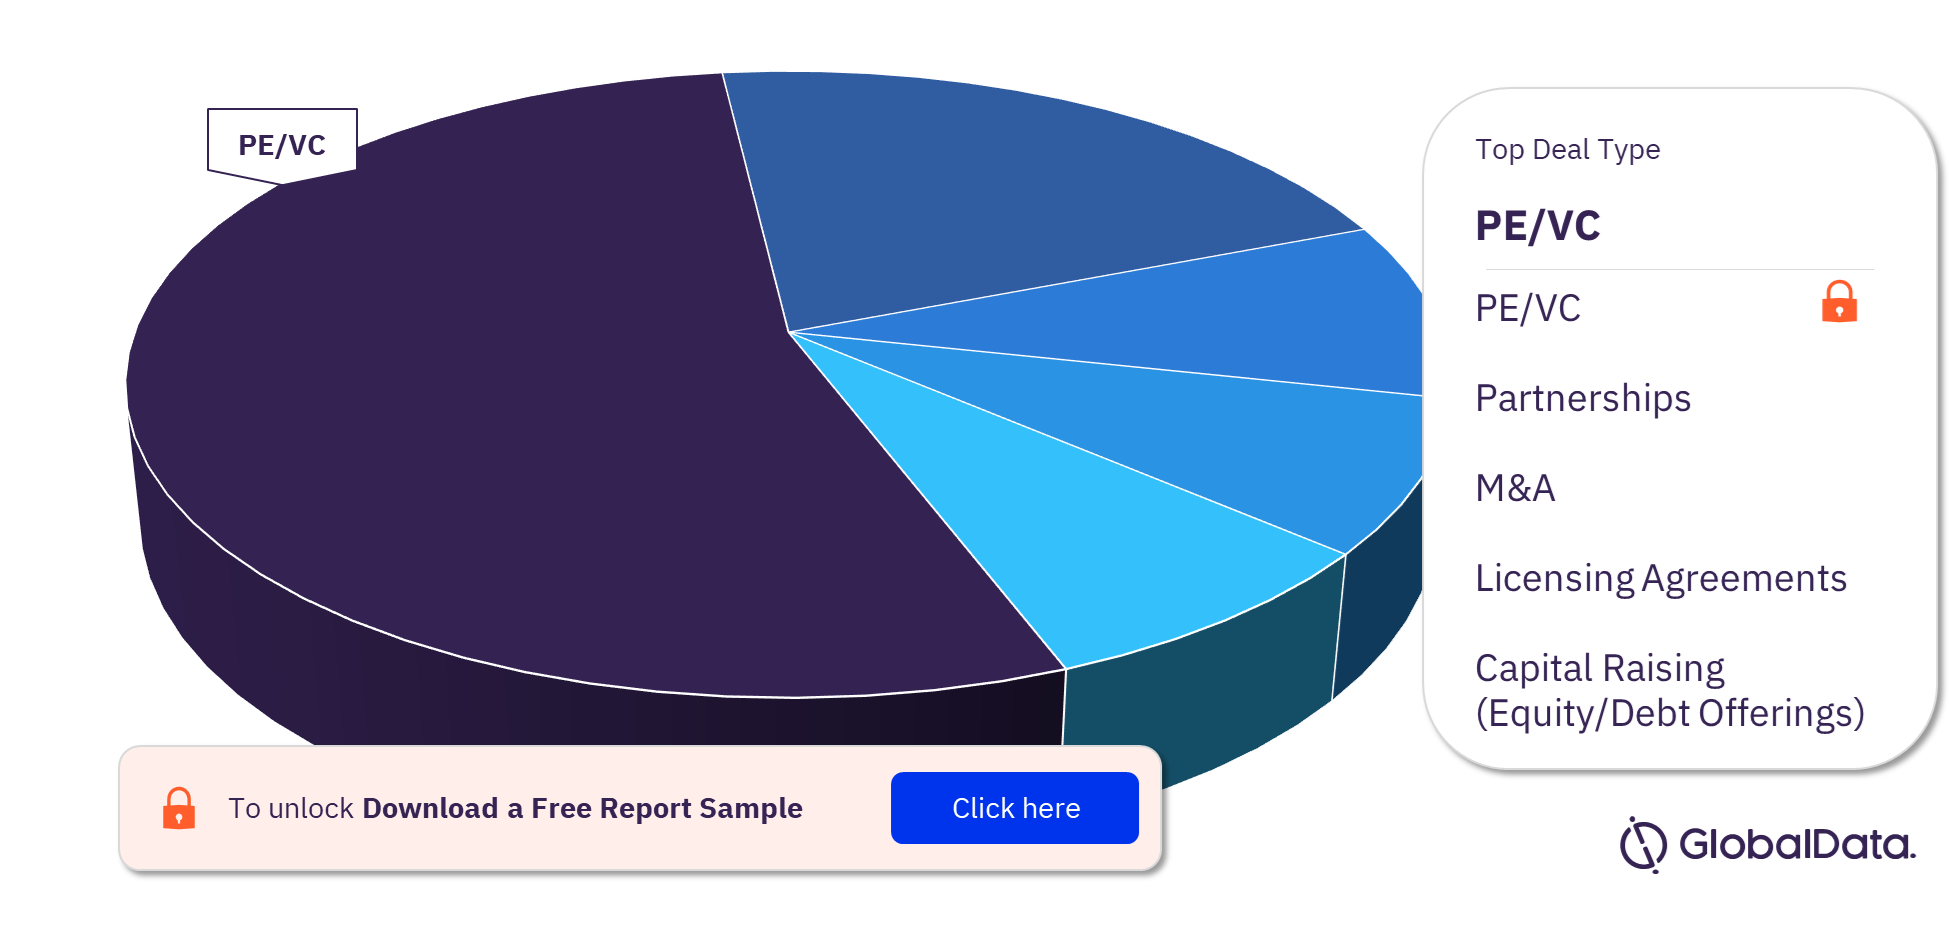
For more deal type insights into the pharmaceuticals and healthcare market, download a free report sample

Pharmaceuticals Market Segmentation by Therapy Areas

The key therapy areas in the pharmaceuticals and healthcare market are oncology, central nervous system, infectious disease, immunology, metabolic disorders, gastrointestinal, and cardiovascular. The oncology therapeutics market recorded the majority of M&A deals, followed by the central nervous system therapeutics market.

 Pharmaceuticals and Healthcare Market Analysis, by Therapy Areas

Pharmaceuticals and Healthcare Market Analysis, by Therapy Areas

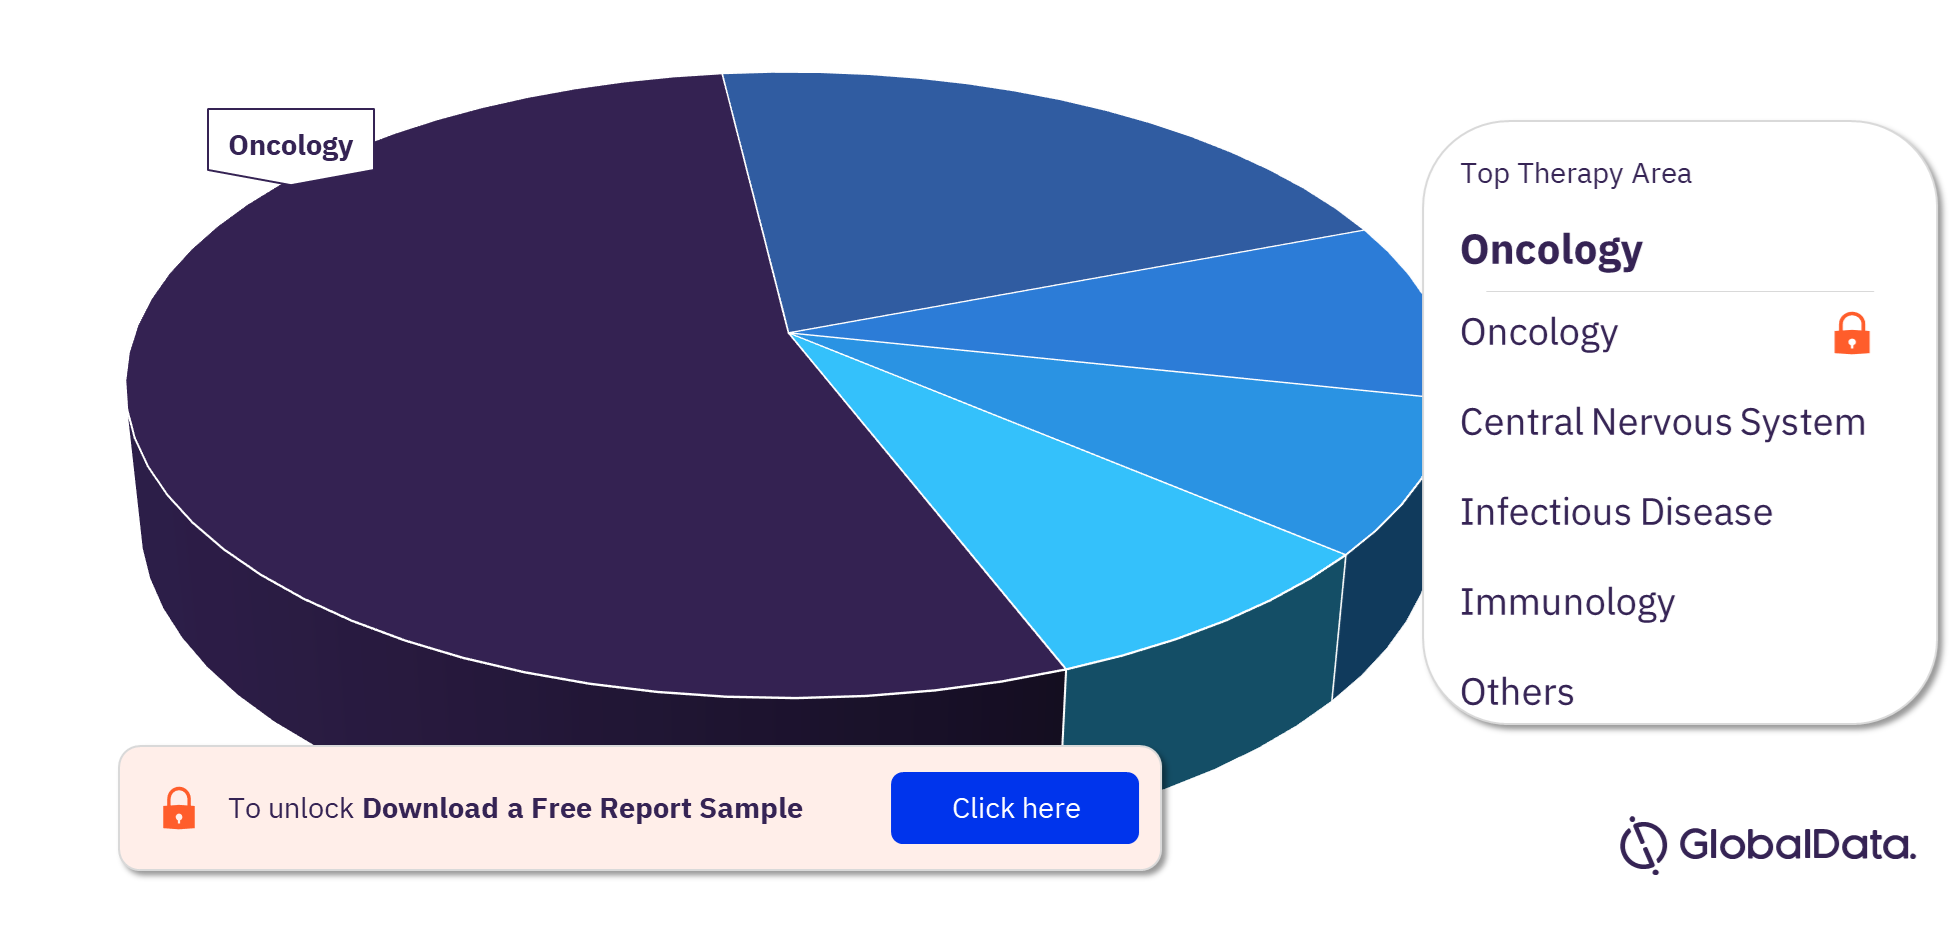
For more therapy area insights into the pharmaceuticals and healthcare market, download a free report sample

Pharmaceuticals Market - Competitive Landscape

The leading financial advisors in the pharmaceuticals and healthcare market are The Goldman Sachs Group Inc, Centerview Partners LLC, Jefferies LLC, Rothschild & Co SCA, and SVB Financial Group. The Goldman Sachs Group Inc topped the M&A financial advisory league.

Pharmaceuticals and Healthcare Market Analysis, by Financial Advisors

Pharmaceuticals and Healthcare Market Analysis, by Financial Advisors
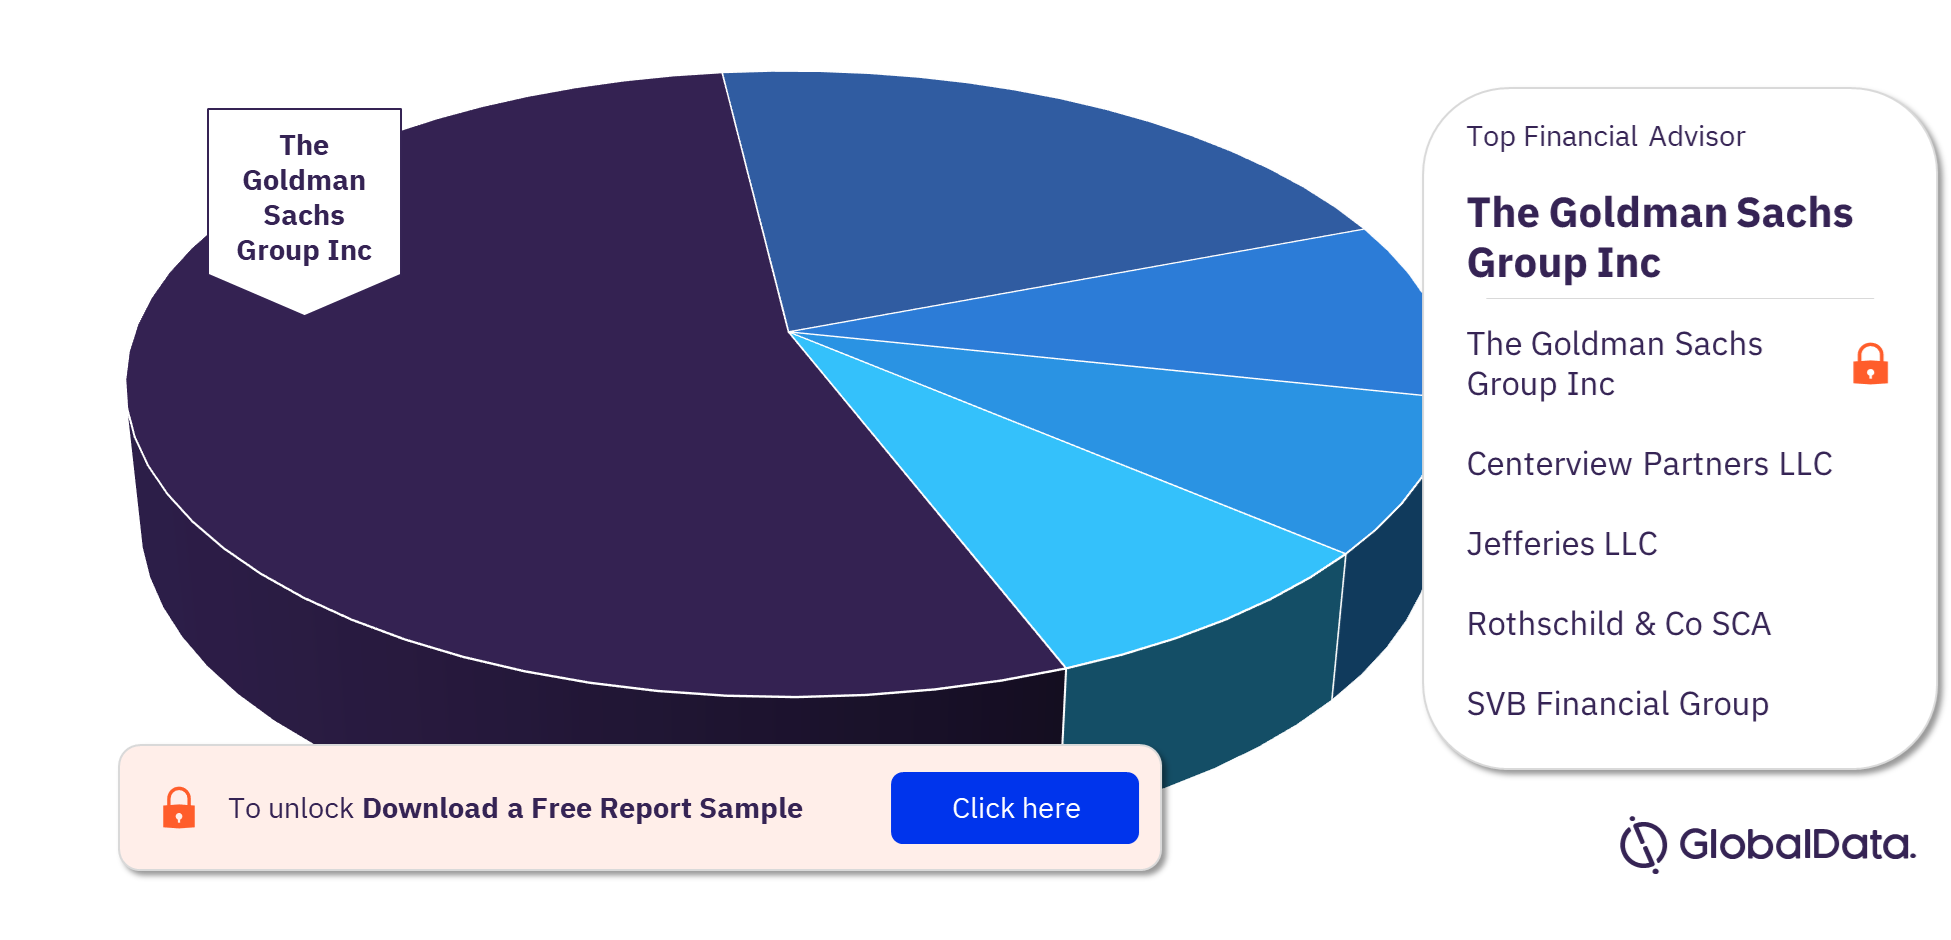
To know more about the financial advisors in the pharmaceuticals and healthcare market, download a free report sample

Pharmaceuticals Market Report Overview

Number of Deals 503
Total Worth (2021) $47.5 billion
Key Regions North America, Europe, Asia Pacific, and the Rest of the World
Key Deal Types PE/VC, Partnerships, M&A, Licensing Agreements, and Capital Raising (Equity/Debt Offerings)
Key Therapy Areas Oncology, Central Nervous System, Infectious Disease, Immunology, Metabolic Disorders, Gastrointestinal, and Cardiovascular
Leading Financial Advisors The Goldman Sachs Group Inc, Centerview Partners LLC, Jefferies LLC, Rothschild & Co SCA, and SVB Financial Group

Scope

This report provides:

  • Analysis of the market trends for the pharmaceutical industry in the global arena.
  • Reviews of deal trends in the cardiovascular, central nervous system, dermatology, ear nose throat disorders, gastrointestinal, genito-urinary system and sex hormones, hematological disorders, hormonal disorders, immunology, infectious disease, male health, metabolic disorders, mouth and dental disorders, musculoskeletal, oncology, ophthalmology, respiratory, toxicology, and women’s health segments.
  • Analysis of partnerships, licensing, M&As, equity/debt offerings, private equity, and venture financing deals in the pharmaceutical industry.
  • Analysis of therapy areas that are very active in terms of venture capital financing, partnerships, licensing agreements, equity/debt offerings, and M&As.
  • Analysis of deals based on different payment modes, including upfront and milestone payments, primarily in partnerships and licensing agreements in the pharmaceutical industry.
  • Analysis of partnership and licensing deals based on the clinical stage of development of products.
  • Summary of the pharmaceutical deals globally in the six months.
  • Information on the top deals happening in the pharmaceutical industry.
  • Geographies including North America, Europe, Asia Pacific, South & Central America, and the Middle East & Africa.
  • League tables of financial advisors in M&As and equity/debt offerings.

Reasons to Buy

  • Enhance your decision-making capability in a more rapid and time-sensitive manner
  • Find out the major deal-performing segments for investments in your industry
  • Evaluate the types of companies which are entering into partnership or licensing agreements, divesting and acquiring assets
  • Identify companies that are aggressively looking to raise capital in the market
  • Evaluate niche therapy areas that are receiving a majority of the upfront and milestone payments in the pharmaceutical industry
  • Identify the key venture capitalists, who are financing the pharmaceutical and biotech companies
  • Evaluate the clinical development stages where a majority of the partnerships and licensing agreements are happening
  • Do deals with an understanding of how competitors are financed, and the mergers and partnerships that have shaped the pharmaceutical industry
  • Identify growth segments and opportunities in each region within the industry
  • Look for key financial advisors where you are planning to raise capital from the market or for acquisitions within the industry

Table of Contents

1 Table of Contents 2

1.1 List of Tables 5

1.2 List of Figures 7

2 Pharmaceuticals & Healthcare, Global, Deal Summary, 10

2.1 Pharmaceuticals & Healthcare, Global, Deal Analysis, November 2021 10

2.2 Pharmaceuticals & Healthcare, Global, Major Deals, November 2021 12

2.2.1 BeiGene Raises USD3.5 Billion in Public Offering of Shares 12

2.2.2 Novo Nordisk Acquires Dicerna Pharma 12

2.2.3 Neurocrine Biosciences to Enter into Licensing Agreement with Sosei Group (Sosei Heptares) 13

2.2.4 Astellas Pharma Enters into Option and Licensing Agreement with Dyno Therapeutics 14

2.2.5 Novartis Enters into Licensing Agreement with Dunad Therapeutics 14

2.3 Pharmaceuticals & Healthcare, Global, by Type, Number of Deals, November 2021 15

2.4 Pharmaceuticals & Healthcare, Global, by Type, Deal Values, November 2021 16

3 Pharmaceuticals and Healthcare, Global, Deals, Summary, by Type 17

3.1 Pharmaceuticals & Healthcare, Global, M&A, November 2021 17

3.1.1 Top M&A Deals in November 2021 18

3.1.2 Pharmaceuticals & Healthcare, Global, M&A Deals by Therapy Area, June 2021 – November 2021 19

3.2 Pharmaceuticals & Healthcare, Global, Equity Offering Deals, November 2021 20

3.2.1 Top Equity Offering Deals in November 2021 21

3.2.2 Pharmaceuticals & Healthcare, Global, Equity Offering Deals by Therapy Area, June 2021 – November 2021 22

3.3 Pharmaceuticals & Healthcare, Global, Private Equity and Venture Capital Deals, November 2021 24

3.3.1 Top PE/VC Deals in November 2021 25

3.3.2 Pharmaceuticals & Healthcare, Global, PE/VC by Therapy Area, November 2021 26

3.3.3 Pharmaceuticals & Healthcare, Global, Venture Capital Deals by Stage of Financing, November 2021 27

3.3.4 Pharmaceuticals & Healthcare, Global, Top Venture Financing Firms, June 2021 –November 2021 29

3.3.5 Pharmaceuticals & Healthcare, Global, Top VC Backed Companies, June 2021–November 2021 30

3.4 Pharmaceuticals & Healthcare, Global, Partnership Deals, November 2021 31

3.5 Pharmaceuticals & Healthcare, Global, Partnership Deals by Therapy Area, June 2021 – November 2021 32

3.6 Pharmaceuticals & Healthcare, Global, Partnership Deals by Upfront and Milestone Payments and Deal Values (US$ m), November 2021 34

3.6.1 Pharmaceuticals & Healthcare, Global, Top Partnership Deals by Payment Mode, November 2021 35

3.7 Pharmaceuticals & Healthcare, Global, Partnership Deals by Therapy Area, by Upfront and Milestone Payments and Deal Values (US$ m), June 2021 – November 2021 36

3.8 Pharmaceuticals & Healthcare, Global, Partnership Deals by Phase, Number of Deals, June 2021 – November 2021 38

3.9 Pharmaceuticals & Healthcare, Global, Partnership Deals by Phase, Deal Values (US$ m), June 2021 – November 2021 39

3.10 Pharmaceuticals & Healthcare, Global, Partnership Deals by Phase, by Upfront & Milestone Payments and Deal Values (US$ m), June 2021 – November 2021 41

4 Pharmaceuticals & Healthcare, Global, Licensing Agreements, November 2021 43

4.1 Pharmaceuticals & Healthcare, Global, Licensing Agreements, November 2021 43

4.2 Pharmaceuticals & Healthcare, Global, Licensing Agreement Deals, Upfront and Milestone Payments and Deal Values (US$ m), November 2021 44

4.3 Pharmaceuticals & Healthcare, Global, Licensing Agreement Deals by Therapy Area, Total Deal Values (US$ m), June 2021 – November 2021 45

4.4 Pharmaceuticals & Healthcare, Global, Licensing Agreement Deals by Therapy Area, Upfront Payments and Milestone Payments (US$ m), June 2021 – November 2021 47

4.5 Pharmaceuticals & Healthcare, Global, Licensing Agreement Deals by Phase, Total Deal Values (US$ m), June 2021 – November 2021 49

4.6 Pharmaceuticals & Healthcare, Global, Licensing Agreement Deals by Phase, Upfront Payments and Milestone Payments (US$ m), June 2021 – November 2021 52

4.6.1 Pharmaceuticals & Healthcare, Global, Top Licensing Agreements by Deal Value, November 2021 53

4.6.2 Pharmaceuticals & Healthcare, Global, Top Licensing Agreements, by Total Upfront Payments, November 2021 54

4.6.3 Pharmaceuticals & Healthcare, Global, Top Licensing Agreements by Total Milestone Payment, November 2021 54

5 Pharmaceuticals & Healthcare, Global, Deal Summary by Therapy Area 55

5.1 Pharmaceuticals & Healthcare, Global, Oncology Deals, November 2021 55

5.1.1 Oncology – Deals of the Month 56

5.2 Pharmaceuticals & Healthcare, Global, Central Nervous System Deals, November 2021 58

5.2.1 Central Nervous System – Deals of the Month 59

5.3 Pharmaceuticals & Healthcare, Global, Infectious Disease Deals, November 2021 61

5.3.1 Infectious Diseases – Deals of the Month 62

5.4 Pharmaceuticals & Healthcare, Global, Cardiovascular Deals, November 2021 64

5.4.1 Genetic Disorders – Deals of the Month 65

5.5 Pharmaceuticals & Healthcare, Global, Immunology Deals, November 2021 67

5.5.1 Immunology – Deal of the Month 68

5.6 Pharmaceuticals & Healthcare, Global, Metabolic Disorders Deals, November 2021 70

5.6.1 Metabolic– Deals of the Month 71

5.7 Pharmaceuticals & Healthcare, Global, Gastrointestinal Disorders, Deals, November 2021 73

5.7.1 Gastrointestinal – Deals of the Month 74

6 Deal Summary by Geography 76

6.1 Pharmaceuticals & Healthcare, North America Deals, November 2021 76

6.1.1 North America – Deals of the Month 77

6.2 Pharmaceuticals & Healthcare, Europe, Deals, November 2021 79

6.2.1 Europe – Deals of the Month 80

6.3 Pharmaceuticals & Healthcare, Asia-Pacific, Deals, November 2021 82

6.3.1 Asia-Pacific – Deals of the Month 83

6.4 Pharmaceuticals & Healthcare, Rest of the World, Deals, November 2021 85

6.4.1 Rest of the World – Deals of the Month 86

7 Pharmaceuticals & Healthcare, Global, Top Financial Advisors 87

7.1 Pharmaceuticals & Healthcare, Global, Top Financial Advisors, M&A, June 2021 – November 2021 87

7.2 Pharmaceuticals & Healthcare, Global, Top Financial Advisors, Equity Offerings, June 2021 – November 2021 88

8 Further Information 89

8.1 Methodology 89

8.2 About GlobalData 90

8.3 Contact Us 90

8.4 Disclosure information 90

8.5 Disclaimer 91

Table

1.1 List of Tables

Table 1: Pharmaceuticals & Healthcare, Global, Deals Summary, Number of Deals and Deal Values (US$ m), June 2021 – November 2021 11

Table 2: Pharmaceuticals & Healthcare, Global, Major Deals, November 2021 12

Table 3: Pharmaceuticals & Healthcare, Global, Number of Deals and Deal Values (%), November 2021 16

Table 4: Pharmaceuticals & Healthcare, Global, M&A, Deals Summary, Number of Deals and Deal Values (US$ m), June 2021 – November 2021 18

Table 5: Pharmaceuticals & Healthcare, Global, Top M&A Deals, October 2021 18

Table 6: Pharmaceuticals & Healthcare, Global, M&A, Deals Summary, Number of Deals and Deal Values (US$ m), by Therapy Area, June 2021 – November 2021 19

Table 7: Pharmaceuticals & Healthcare, Global, Equity Offerings, Deals Summary, Number of Deals and Deal Values (US$ m), June 2020– November 2021 21

Table 8: Pharmaceuticals & Healthcare, Global, Top Equity Offering Deals, November 2021 21

Table 9: Pharmaceuticals & Healthcare, Global, Equity Offering Deals, Deals Summary, Number of Deals and Deal Values (US$ m), June 2021 – November 2021 23

Table 10: Pharmaceuticals & Healthcare, Global, PE/VC, Deals Summary, Number of Deals and Deal Values (US$ m), June 2021 – November 2021 25

Table 11: Pharmaceuticals & Healthcare, Global, Top PE/VC Deals, November 2021 25

Table 12: Pharmaceuticals & Healthcare, Global, PE/VC Deals by Therapy Area, Deals Summary, June 2021 – November 2021 26

Table 13: Pharmaceuticals & Healthcare, Global, Venture Capital Deals by Stage of Financing, Number of Deals and Deal Values (%), October 2021 28

Table 14: Pharmaceuticals & Healthcare, Global, Top Venture Financing Firms, Number of Deals and Deal Values (US$ m), June 2021 – November 2021 29

Table 15: Pharmaceuticals & Healthcare, Global, Top VC Backed Companies, June 2021–November 2021 30

Table 16: Pharmaceuticals & Healthcare, Global, Partnerships, Number of Deals and Deal Values (US$ m), June 2021 – November 2021 31

Table 17: Pharmaceuticals & Healthcare, Global, Partnership Deals by Therapy Area, Number of Deals and Deal Values (US$ m), June 2021 – November 2021 33

Table 18: Pharmaceuticals & Healthcare, Partnership Deals, Upfront and Milestone Payments and Deal Values (US$ m), June 2021 – November 2021 34

Table 19: Pharmaceuticals & Healthcare, Global, Partnerships, Upfront and Milestone Payments and Deal Values (US$ m), November 2021 35

Table 20: Pharmaceuticals & Healthcare, Global, Partnership Deals by Therapy Area, Upfront and Milestone Payments and Deal Values (US$ m), June 2021 – November 2021 37

Table 21: Pharmaceuticals & Healthcare, Global, Partnership Deals by Phase, June 2021 – November 2021 39

Table 22: Pharmaceuticals & Healthcare, Global, Partnership Deals by Upfront and Milestone Payment and Deal values (US$ m), June 2021 – November 2021 42

Table 23: Pharmaceuticals & Healthcare, Global, Licensing Agreement Deals, Deals Summary, Number of Deals and Deal Values (US$ m), June 2021 – November 2021 43

Table 24: Pharmaceuticals & Healthcare, Global, Licensing Agreements, Deals Summary, Upfront and Milestone Payments and Deal Values (US$ m), June 2021 – November 2021 44

Table 25: Pharmaceuticals & Healthcare, Global, Licensing Agreement Deals by Therapy Area, Number of Deals and Deal Values (US$ m), June 2021 – November 2021 46

Table 26: Pharmaceuticals & Healthcare, Global, Licensing Agreements by Therapy Area, by Upfront and Milestone Payments (US$ m), June 2021 – November 2021 48

Table 27: Pharmaceuticals & Healthcare, Global, Licensing Agreement Deals by Phase, June 2021 – November 2021 50

Table 28: Pharmaceuticals & Healthcare, Global, Licensing Agreements by Therapy Area, by Upfront and Milestone Payments and Deal Values (US$ m) June 2021 – November 2021 53

Table 29: Pharmaceuticals & Healthcare, Global, Top Licensing Agreement Deals by Value, November 2021 53

Table 30: Pharmaceuticals & Healthcare, Global, Top Licensing Agreement Deals by Total Upfront Payments, November 2021 54

Table 31: Pharmaceuticals & Healthcare, Global, Top Licensing Agreement Deals by Total Milestone Payment, November 2021 54

Table 32: Pharmaceuticals & Healthcare, Global, Oncology, Deals Summary, Number of Deals and Deal Values (US$ m), June 2021 – November 2021 56

Table 33: Pharmaceuticals & Healthcare, Global, Central Nervous System, Deals Summary, Number of Deals and Deal Values (US$ m), June 2021 – November 2021 59

Table 34: Pharmaceuticals & Healthcare, Global, Infectious Diseases, Deals Summary, Number of Deals and Deal Values (US$ m), June 2021 – November 2021 62

Table 35: Pharmaceuticals & Healthcare, Global, Cardiovascular, Deals Summary, Number of Deals and Deal Values (US$ m), June 2021 – November 2021 65

Table 36: Pharmaceuticals & Healthcare, Global, Immunology, Deals Summary, Number of Deals and Deal Values (US$ m), June 2021 – November 2021 68

Table 37: Pharmaceuticals & Healthcare, Global, Metabolic Disorders, Deals Summary, Number of Deals and Deal Values (US$ m), June 2021 – November 2021 71

Table 38: Pharmaceuticals & Healthcare, Global, Gastrointestinal, Deals Summary, Number of Deals and Deal Values (US$ m), June 2021 – November 2021 74

Table 39: Pharmaceuticals & Healthcare, North America, Deals Summary, Number of Deals and Deal Values (US$ m), June 2021 – November 2021 77

Table 40: Pharmaceuticals & Healthcare, Europe, Deals Summary, Number of Deals and Deal Values (US$ m), June 2021 – November 2021 80

Table 41: Pharmaceuticals & Healthcare, Asia-Pacific, Deals Summary, Number of Deals and Deal Values (US$ m), June 2021 – November 2021 83

Table 42: Pharmaceuticals & Healthcare, Rest of the World, Deals Summary, Number of Deals and Deal Values (US$ m), June 2021 – November 2021 86

Table 43: Pharmaceuticals & Healthcare, Top Financial Advisors, M&A, Number of Deals and Deal Values (US$ m), June 2021 – November 2021 87

Table 44: Pharmaceuticals & Healthcare, Global Top Financial Advisors, Equity Offerings, Number of Deals and Deal Values (US$ m), June 2021 – November 2021 88

Figures

1.2 List of Figures

Figure 1: Pharmaceuticals & Healthcare, Global, Number of Deals and Deal Values (US$ m), June 2021 – November 2021 10

Figure 2: Pharmaceuticals & Healthcare, Global, Number of Deals (%), November 2021 15

Figure 3: Pharmaceuticals & Healthcare, Global, Deal Values (%), November 2021 16

Figure 4: Pharmaceuticals & Healthcare, Global, M&As, Number of Deals and Deal Values (US$ m), June 2021 – November 2021 17

Figure 5: Pharmaceuticals & Healthcare, Global, M&As by Therapy Area, Number of Deals and Deal Values (US$ m), by Therapy Area, June 2021 – November 2021 19

Figure 6: Pharmaceuticals & Healthcare, Global, Equity Offering Deals, Number of Deals and Deal Values (US$ m), June 2021 – November 2021 20

Figure 7: Pharmaceuticals & Healthcare, Global, Equity Offering Deals by Therapy Area, Number of Deals and Deal Values (US$ m), June 2021 – November 2021 22

Figure 8: Pharmaceuticals & Healthcare, Global, Private Equity and Venture Capital, Number of Deals and Deal Values (US$ m), June 2021 – November 2021 24

Figure 9: Pharmaceuticals & Healthcare, Global, PE/VC Deals by Therapy Area, Number of Deals and Deal Values (US$ m), by Therapy Area, June 2021 – November 2021 26

Figure 10: Pharmaceuticals & Healthcare, Global, Venture Capital Deals by Stage of Financing, Number of Deals (%), November 2021 27

Figure 11: Pharmaceuticals & Healthcare, Global, Venture Capital Deals by Stage of Financing, Deal Values (%), November 2021 28

Figure 12: Pharmaceuticals & Healthcare, Global, Top Venture Financing Firms, Number of Deals and Deal Values (US$ m), June 2021 –November 2021 29

Figure 13: Pharmaceuticals & Healthcare, Global, Partnerships, Number of Deals and Deal Values (US$ m), June 2021 – November 2021 31

Figure 14: Pharmaceuticals & Healthcare, Global, Partnership Deals by Therapy Area, Number of Deals and Deal Values (US$ m), June 2021 – November 2021 32

Figure 15: Pharmaceuticals & Healthcare, Global, Partnership Deals, Upfront and Milestone Payments and Deal Values (US$ m), June 2021 – November 2021 34

Figure 16: Pharmaceuticals & Healthcare, Global, Partnership Deals by Therapy Area, Upfront and Milestone Payments and Deal Values (US$ m), June 2021 – November 2021 36

Figure 17: Pharmaceuticals & Healthcare, Global, Partnership Deals by Phase, June 2021 – November 2021 38

Figure 18: Pharmaceuticals & Healthcare, Global, Partnership Deals by Phase, June 2021 – November 2021 39

Figure 19: Pharmaceuticals & Healthcare, Global, Partnership Deals by Phase, by Upfront & Milestone Payments and Deal Values (US$ m), June 2021 – November 2021 41

Figure 20: Pharmaceuticals & Healthcare, Global, Licensing Agreements, Number of Deals and Deal Values (US$ m), June 2021 – November 2021 43

Figure 21: Pharmaceuticals & Healthcare, Global, Licensing Agreement Deals, Upfront and Milestone Payments and Deal Values (US$ m), June 2021 – November 2021 44

Figure 22: Pharmaceuticals & Healthcare, Global, Licensing Agreement Deals by Therapy Area, Number of Deals and Deal Values (US$ m), June 2021 – November 2021 45

Figure 23: Pharmaceuticals & Healthcare, Global, Licensing Agreement Deals by Therapy Area, Upfront and Milestone Payments and Deal Values (US$ m), June 2021 – November 2021 47

Figure 24: Pharmaceuticals & Healthcare, Global, Licensing Agreement Deals by Phase, Number of Deals, June 2021 – November 2021 49

Figure 25: Pharmaceuticals & Healthcare, Global, Licensing Agreement Deals by Phase, Deal Values (US$ m), June 2021 – November 2021 50

Figure 26: Pharmaceuticals & Healthcare, Global, Licensing Agreement Deals by Phase, by Upfront and Milestone Payments and Deal Values (US$ m) June 2021 – November 2021 52

Figure 27: Pharmaceuticals & Healthcare, Global, Oncology, Number of Deals and Deal Values (US$ m), June 2021 – November 2021 55

Figure 28: Pharmaceuticals & Healthcare, Global, Central Nervous System, Number of Deals and Deal Values (US$ m), June 2021 – November 2021 58

Figure 29: Pharmaceuticals & Healthcare, Global, Infectious Diseases, Number of Deals and Deal Values (US$ m), June 2021 – November 2021 61

Figure 30: Pharmaceuticals & Healthcare, Global, Cardiovascular, Number of Deals and Deal Values (US$ m), June 2021 – November 2021 64

Figure 31: Pharmaceuticals & Healthcare, Global, Immunology, Number of Deals and Deal Values (US$ m), June 2021 – November 2021 67

Figure 32: Pharmaceuticals & Healthcare, Global, Metabolic Disorders, Deals Summary, Number of Deals and Deal Values (US$ m), June 2021 – November 2021 70

Figure 33: Pharmaceuticals & Healthcare, Global, Gastrointestinal, Deals Summary, Number of Deals and Deal Values (US$ m), June 2021 – November 2021 73

Figure 34: Pharmaceuticals & Healthcare, North America, Number of Deals and Deal Values (US$ m), June 2021 – November 2021 76

Figure 35: Pharmaceuticals & Healthcare, Europe, Number of Deals and Deal Values (US$ m), June 2021 – November 2021 79

Figure 36: Pharmaceuticals & Healthcare, Asia-Pacific, Number of Deals and Deal Values (US$ m), June 2021 – November 2021 82

Figure 37: Pharmaceuticals & Healthcare, Rest of the World, Number of Deals and Deal Values (US$ m), June 2021 – November 2021 85

Figure 38: Pharmaceuticals & Healthcare, Global, Top Financial Advisors, M&A, Number of Deals and Deal Values (US$ m), June 2021 – November 2021 87

Figure 39: Pharmaceuticals & Healthcare, Global, Top Financial Advisors, Equity Offerings, Number of Deals and Deal Values (US$ m), June 2021 – November 2021 88

Frequently asked questions

Pharmaceuticals Industry Deals and Trends in November 2021 – Partnerships, Licensing, Investments, Mergers and Acquisitions (M&A) thematic reports
Currency USD
$1,000

Can be used by individual purchaser only

$2,000

Can be shared globally by unlimited users within the purchasing corporation e.g. all employees of a single company


Undecided about purchasing this report?

Enquire Before Buying Request a Free Sample

Get in touch to find out about multi-purchase discounts

reportstore@globaldata.com
Tel +44 20 7947 2745

Every customer’s requirement is unique. With over 220,000 construction projects tracked, we can create a tailored dataset for you based on the types of projects you are looking for. Please get in touch with your specific requirements and we can send you a quote.

Sample Report

Pharmaceuticals Industry Deals and Trends in November 2021 – Partnerships, Licensing, Investments, Mergers and Acquisitions (M&A) was curated by the best experts in the industry and we are confident about its unique quality. However, we want you to make the most beneficial decision for your business, so we offer free sample pages to help you:

  • Assess the relevance of the report
  • Evaluate the quality of the report
  • Justify the cost

Download your copy of the sample report and make an informed decision about whether the full report will provide you with the insights and information you need.

Below is a sample report to understand what you are buying

See what our customers are saying

“The GlobalData platform is our go-to tool for intelligence services. GlobalData provides an easy way to access comprehensive intelligence data around multiple sectors, which essentially makes it a one-for-all intelligence platform, for tendering and approaching customers.

GlobalData is very customer orientated, with a high degree of personalised services, which benefits everyday use. The highly detailed project intelligence and forecast reports can be utilised across multiple departments and workflow scopes, from operational to strategic level, and often support strategic decisions. GlobalData Analytics and visualisation solutions has contributed positively when preparing management presentations and strategic papers.”

Business Intelligence & Marketing Manager, SAL Heavy Lift

“COVID-19 has caused significant interference to our business and the COVID-19 intelligence from GlobalData has helped us reach better decisions around strategy. These two highlights have helped enormously to understand the projections into the future concerning our business units, we also utilise the project database to source new projects for Liebherr-Werk to use as an additional source to pitch for new business.”

Market Analyst & Management, Liebherr-Werk

Your daily news has saved me a lot of time and keeps me up-to-date with what is happening in the market, I like that you almost always have a link to the source origin. We also use your market data in our Strategic Business Process to support our business decisions. By having everything in one place on the Intelligence Center it has saved me a lot of time versus looking on different sources, the alert function also helps with this.

Head of Key Accounts, Saab AB

Having used several other market research companies, I find that GlobalData manages to provide that ‘difficult-to-get’ market data that others can’t, as well as very diverse and complete consumer surveys.

Marketing Intelligence Manager, Portugal Foods

Our experience with GlobalData has been very good, from the platform itself to the people. I find that the analysts and the account team have a high level of customer focus and responsiveness and therefore I can always rely on. The platform is more holistic than other providers. It is convenient and almost like a one stop shop. The pricing suite is highly competitive and value for our organisation.

I like reports that inform new segments such as the analysis on generation Z, millennials, the impact of COVID 19 to our banking customers and their new channel habits. Secondly the specialist insight on affluent sector significantly increases our understanding about this group of customers. The combination of those give us depth and breadth of the evolving market.

I’m in the business of answering and helping people make decisions so with the intelligence center I can do that, effectively and efficiently. I can share quickly key insights that answer and satisfy our country stakeholders by giving them many quality studies and primary research about competitive landscape beyond the outlook of our bank. It helps me be seen as an advisory partner and that makes a big difference. A big benefit of our subscription is that no one holds the whole data and because it allows so many people, so many different parts of our organisation have access, it enables all teams to have the same level of knowledge and decision support.

Head of Customer Insight and Research, Standard Chartered

“I know that I can always rely on Globaldata’s work when I’m searching for the right consumer and market insights. I use Globaldata insights to understand the changing market & consumer landscape and help create better taste & wellbeing solutions for our customers in food, beverage and healthcare industries.

Globaldata has the right data and the reports are of very high quality compared to your competitors. Globaldata not only has overall market sizes & consumer insights on food & beverages but also provides insights at the ingredient & flavour level. That is key for B2B companies like Givaudan. This way we understand our customers’ business and also gain insight to our unique industry”

Head of Consumer Sensory Insights, Givaudan

GlobalData provides a great range of information and reports on various sectors that is highly relevant, timely, easy to access and utilise.  The reports and data dashboards help engagement with clients; they provide valuable industry and market insights that can enrich client conversations and can help in the shaping of value propositions. Moreover, using GlobalData products has helped increase my knowledge of the finance sector, the players within it, and the general threats and opportunities.

I find the consumer surveys that are carried out to be extremely beneficial and not something I have seen anywhere else. They provided an insightful view of why and which consumers take (or don’t) particular financial products. This can help shape conversations with clients to ensure they make the right strategic decisions for their business.

One of the challenges I have found is that data in the payments space is often piecemeal. With GD all of the data I need is in one place, but it also comes with additional market reports that provide useful extra context and information. Having the ability to set-up alerts on relevant movements in the industry, be it competitors or customers, and have them emailed directly to me, ensures I get early sight of industry activity and don’t have to search for news.

Senior Account Manager, TSYS
Go even deeper with GlobalData Intelligence Center

Every Company Report we produce is powered by the GlobalData Intelligence Center.

Subscribing to our intelligence platform means you can monitor developments at Pharmaceuticals Industry Deals and Trends in November 2021 – Partnerships, Licensing, Investments, Mergers and Acquisitions (M&A) in real time.

  • Access a live Pharmaceuticals Industry Deals and Trends in November 2021 – Partnerships, Licensing, Investments, Mergers and Acquisitions (M&A) dashboard for 12 months, with up-to-the-minute insights.
  • Fuel your decision making with real-time deal coverage and media activity.
  • Turn insights on financials, deals, products and pipelines into powerful agents of commercial advantage.