Propylene Industry Installed Capacity and Capital Expenditure Forecast by Region and All Active and Planned Projects to 2027

Powered by

All the vital news, analysis, and commentary curated by our industry experts.

Propylene Industry Installed Capacity and Capital Expenditure Market Report Overview

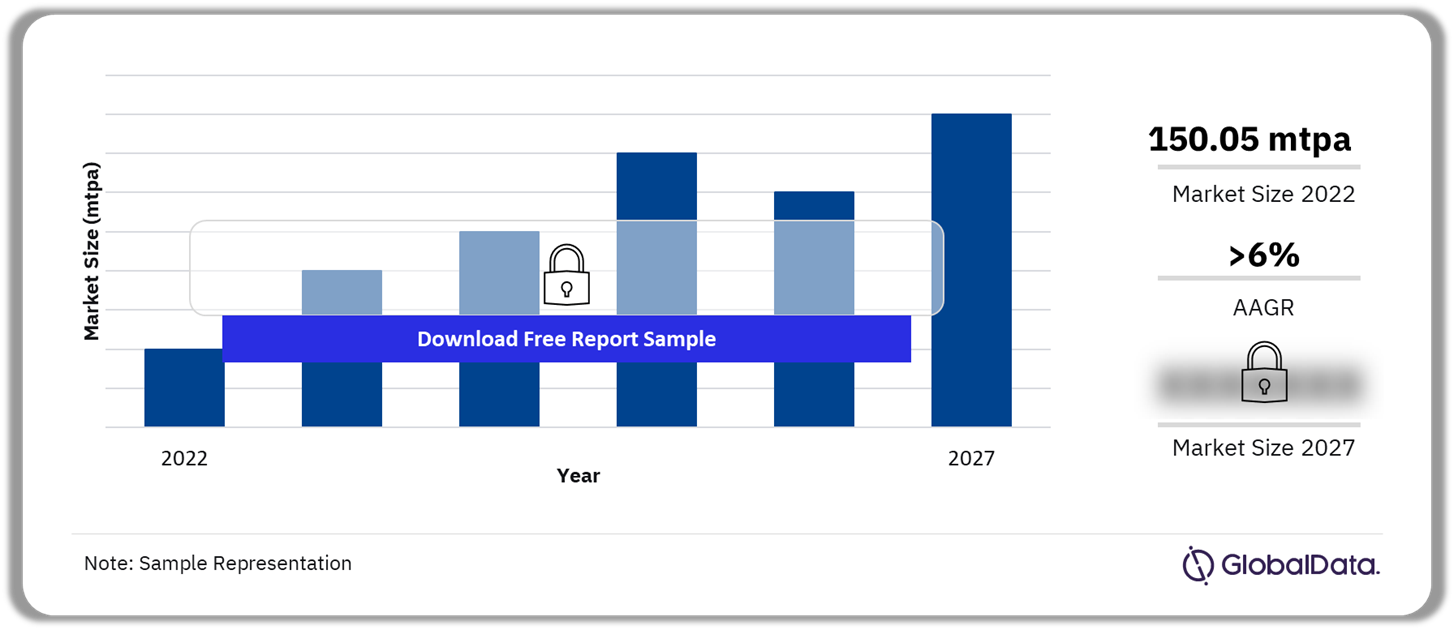
The global Propylene capacity and capital capacity was 150.05 mtpa in 2022 and is expected to grow at an AAGR of more than 6% by 2027. In 2022, China, US, South Korea, Saudi Arabia, and India were the key countries in the world accounting for more than 65% of the total Propylene capacity.

Propylene Industry Installed Capacity and CapEx Market Outlook 2022-2027 (mtpa)

Propylene Industry Installed Capacity and CapEx Market Outlook 2022-2027 (mtpa)

Buy the Full Report for Propylene Industry Installed Capacity and CapEx Forecast, Download a Free Report Sample

The Propylene industry installed capacity and CapEx report covers detailed analysis on all active and upcoming (planned and announced) plants by region and country for the period 2017-2027. It provides global and regional capital expenditure outlook forecasts up to 2027. Furthermore, the report gives a comparative analysis of key countries based on their contribution to global as well as regional propylene capacities.

Market Size, 2022 (mtpa) 150.05 mtpa
AAGR (2022-2027) >6%
Key Regions ·       Asia

·       North America

·       Europe

·       South America

·       Former Soviet Union

·       Middle East

·       Africa

Top Planned and Announced Projects ·       Shandong Yulong Petrochemical Longkou Propylene Plant 1

·       Reliance Industries Jamnagar Propylene Plant 3

·       Fujian Eversun New Material Putian Propylene plant 2

·       Oriental Energy Maoming Propylene Plant 3

·       Oriental Energy Maoming Propylene Plant 4

Key Companies ·       LyondellBasell Industries NV

·       Saudi Arabian Oil Co

·       Formosa Plastics Group

·       Shell plc

·       China Petrochemical Corp

Enquire & Decide Discover the perfect solution for your business needs. Enquire now and let us help you make an informed decision before making a purchase.

Propylene Industry Installed Capacity and CapEx by Regions

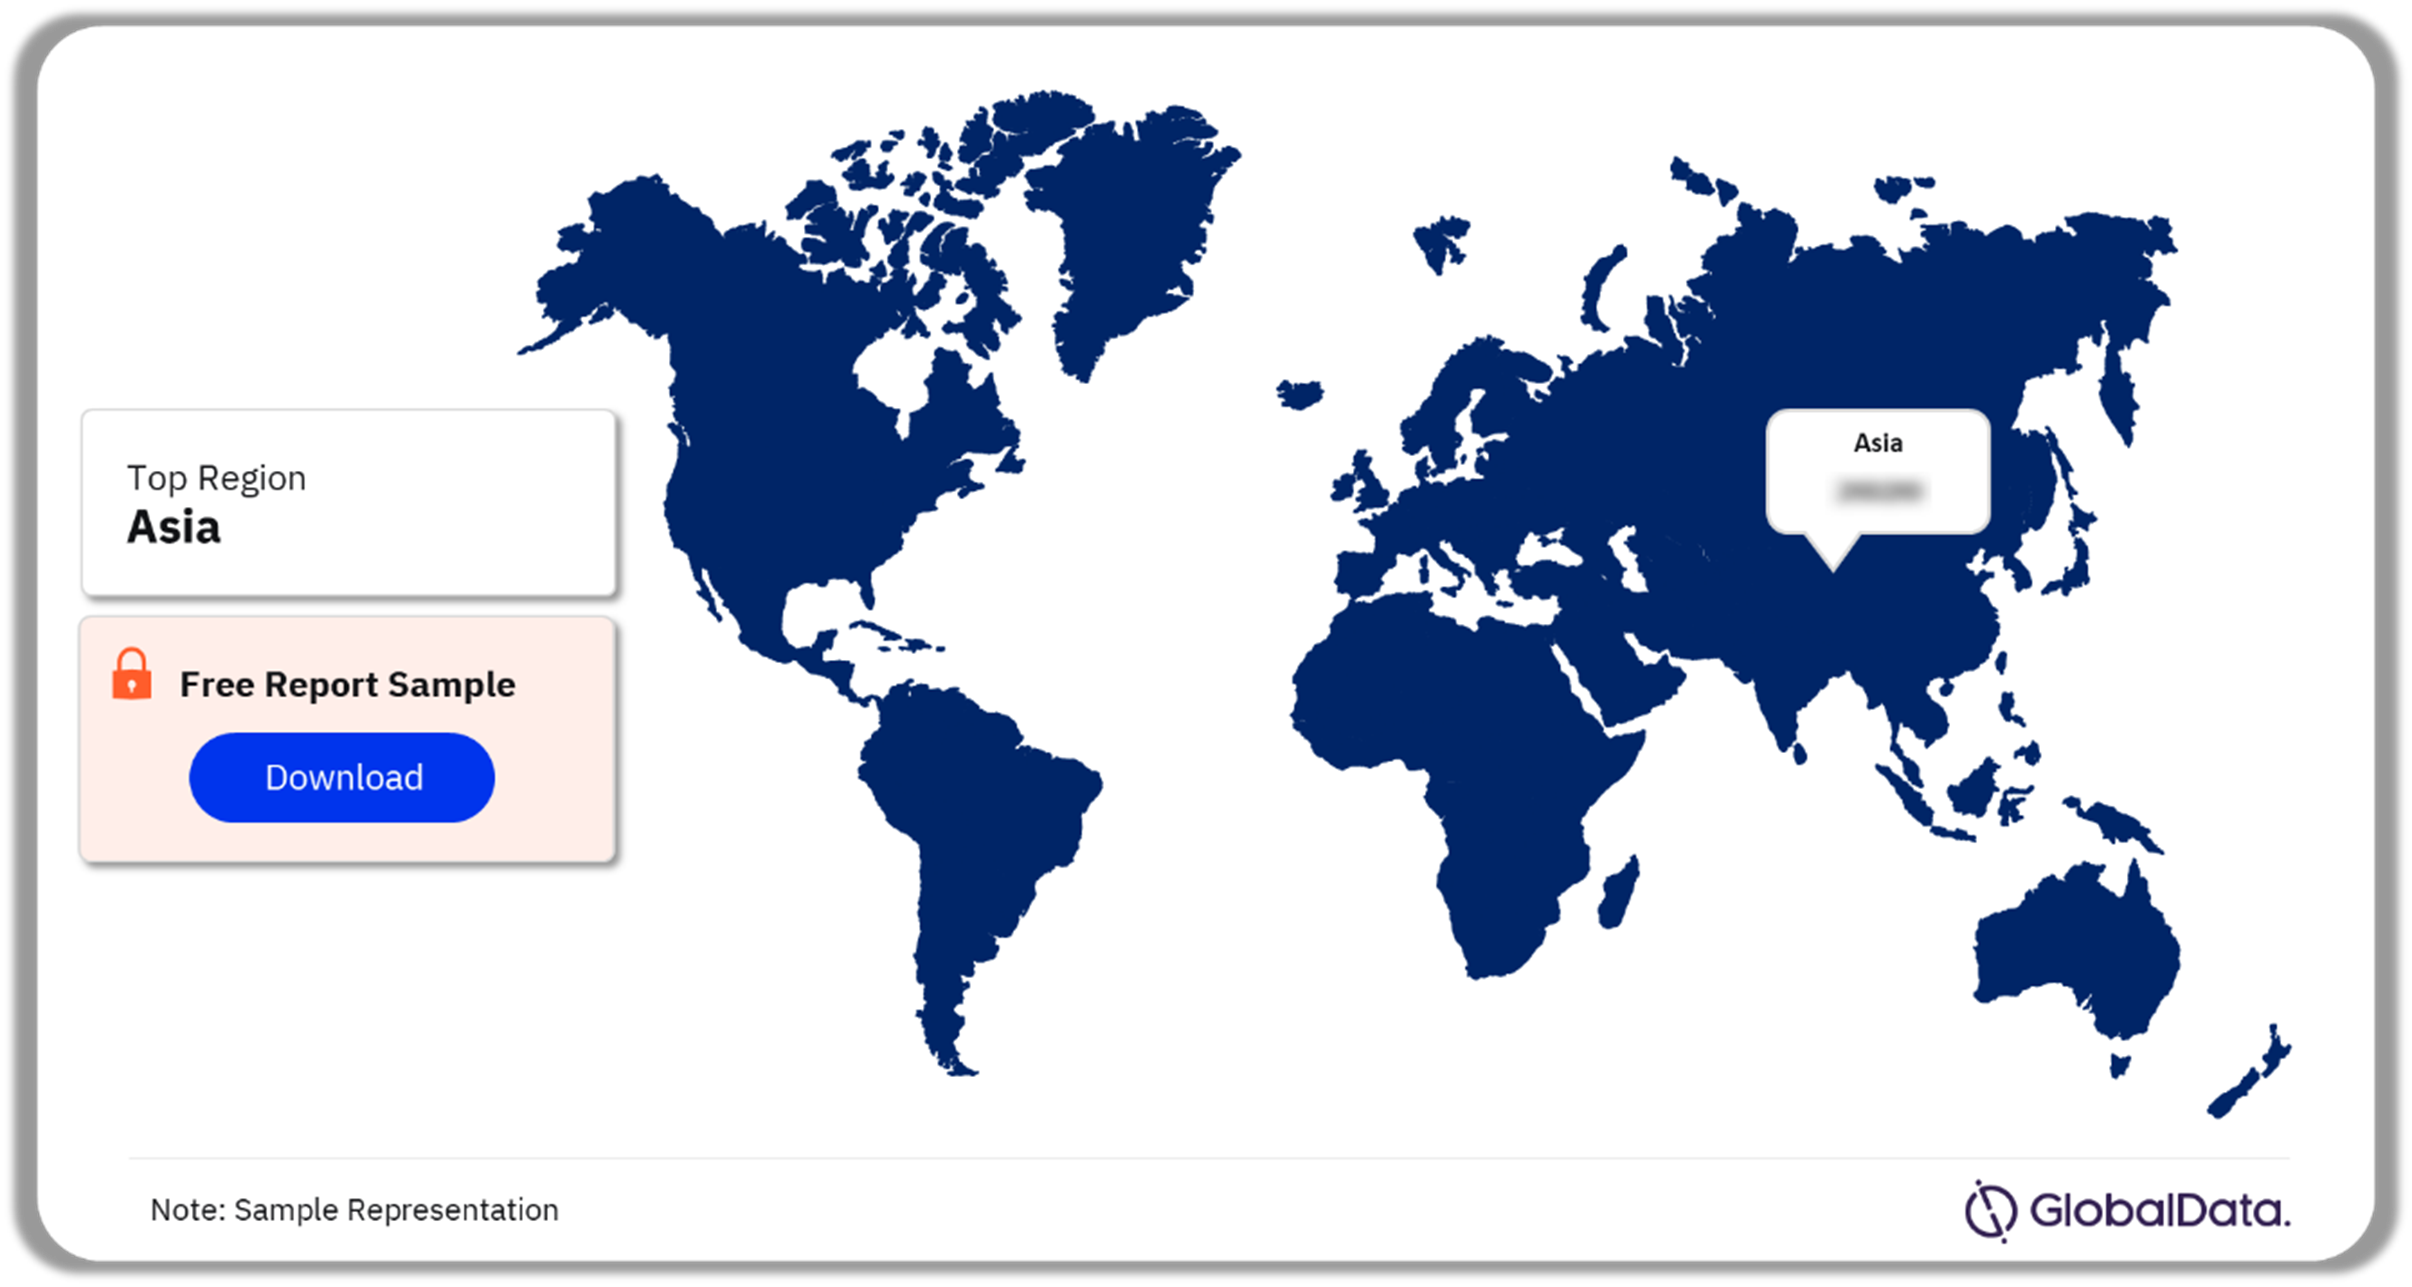
The key regions in the global Propylene industry installed capacity and CapEx are Asia, North America, Europe, South America, the Former Soviet Union, the Middle East, and Africa. Among regions, Asia led the global Propylene capacity and capital market in 2022 and is expected to continue doing so during the forecast period.

In 2022, the capacity contribution of Asia was the highest, of which China accounted for more than 53% share. North America was the second highest. Within North America, the US was the major contributor.

Propylene Industry Installed Capacity and CapEx Market Analysis by Regions, 2022 (%)

Propylene Industry Installed Capacity and CapEx Market Analysis by Regions, 2022 (%)

Buy the Full Report for More Regional Propylene Industry Installed Capacity And CapEx Outlook, Download a Free Report Sample

Propylene Market Major Planned and Announced Projects

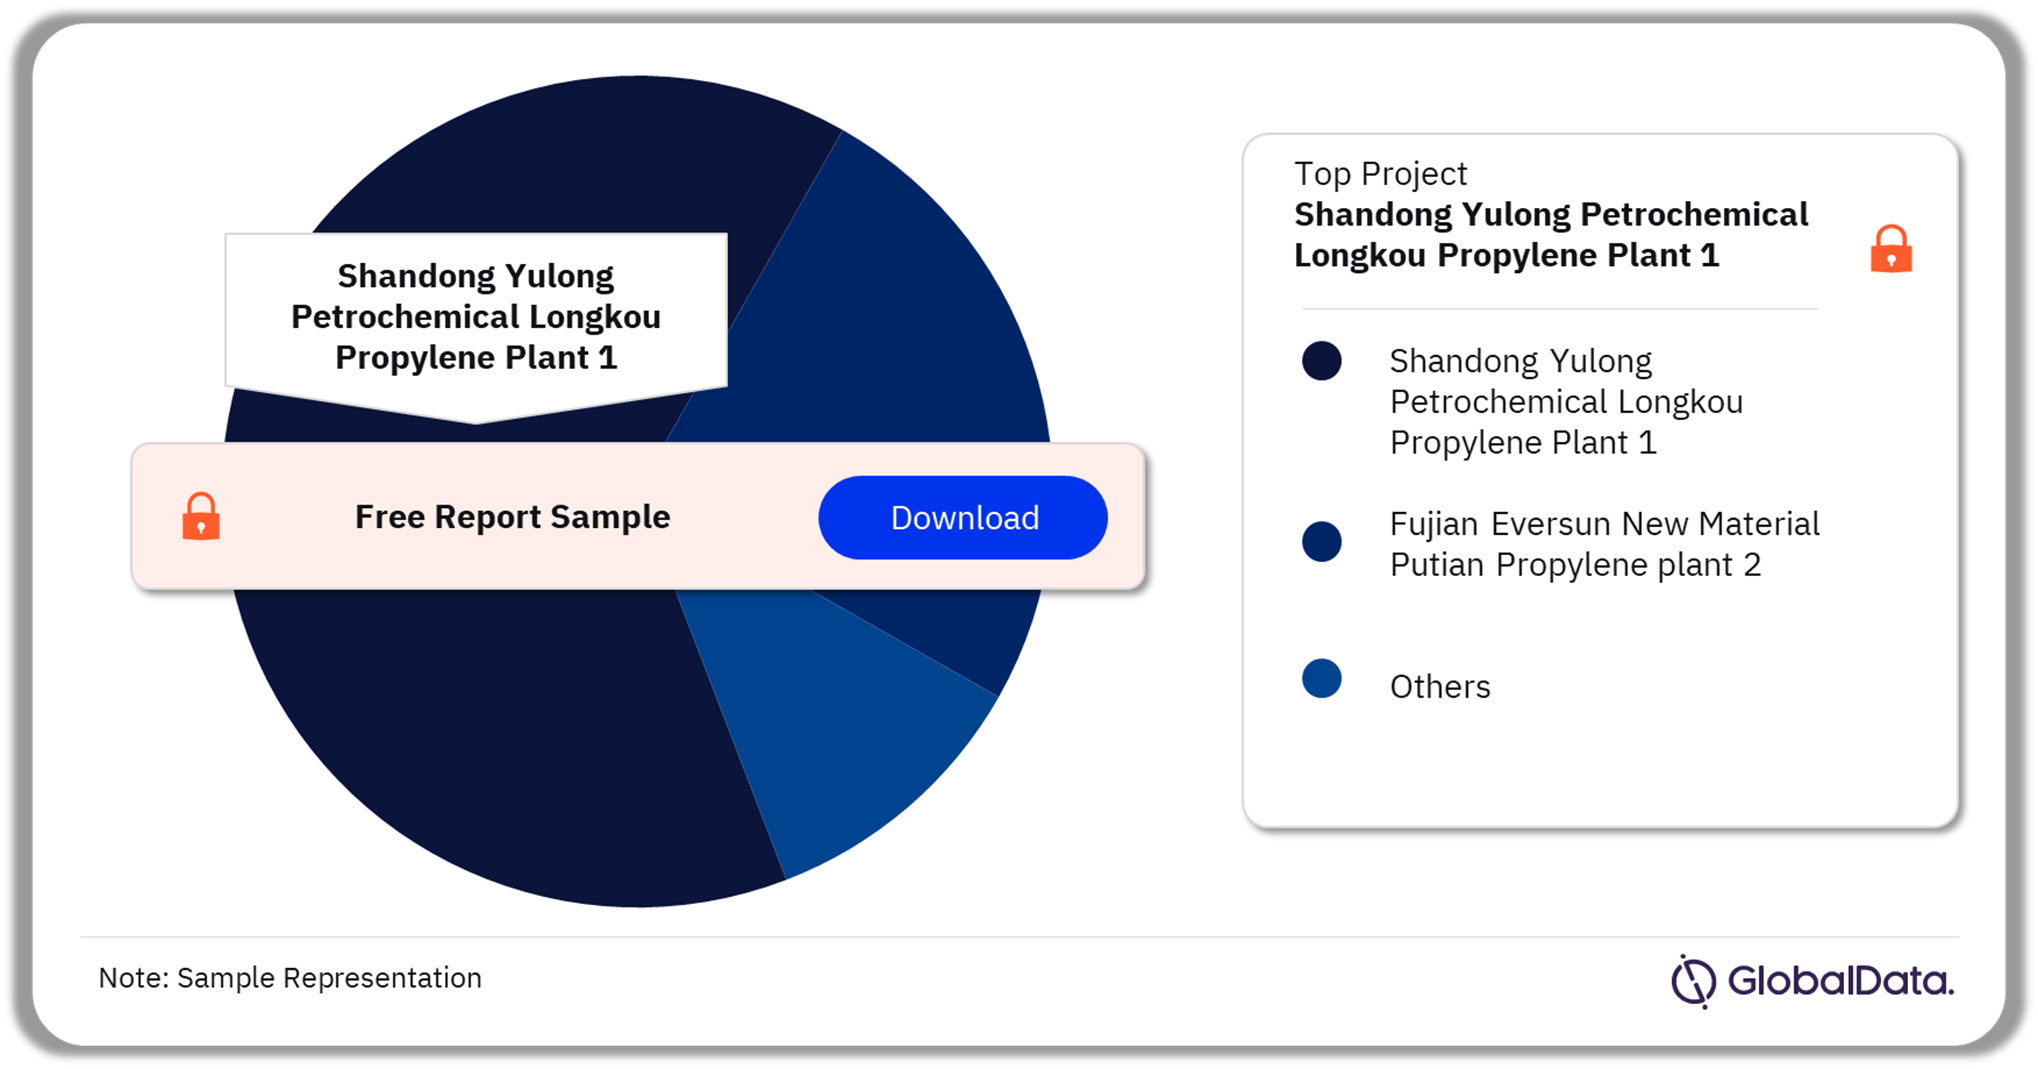
The major planned and announced projects in the propylene market are Shandong Yulong Petrochemical Longkou Propylene Plant 1, Reliance Industries Jamnagar Propylene Plant 3, Fujian Eversun New Material Putian Propylene Plant 2, Oriental Energy Maoming Propylene Plant 3, and Oriental Energy Maoming Propylene Plant 4 among others. In 2022, the Shandong Yulong Petrochemical Longkou Propylene Plant 1 had the highest valuation.

Propylene Industry Installed Capacity and CapEx Analysis by Planned and Announced Projects 2022 (%)

Propylene Industry Installed Capacity and CapEx Analysis by Planned and Announced Projects 2022 (%)

Buy the Full Report for Planned and Announced Projects with Propylene Industry Installed Capacity and CapEx Analysis, Download a Free Report Sample

Propylene Capacity and Capital Expenditure Market – Competitive Landscape

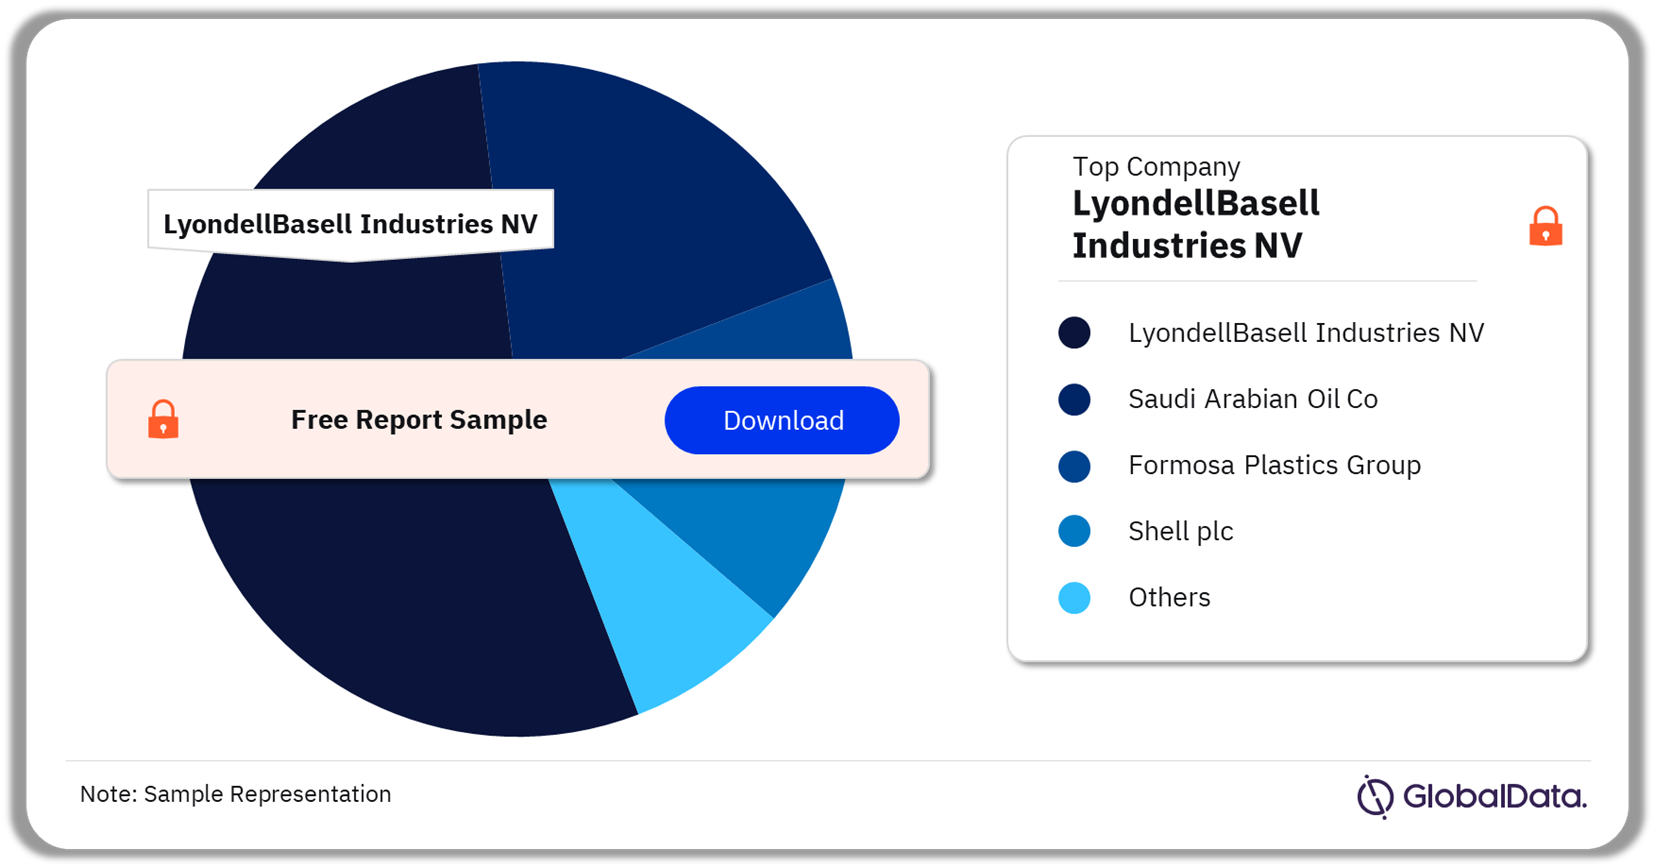
The key companies in the Propylene industry installed capacity and CapEx are LyondellBasell Industries NV, Saudi Arabian Oil Co, Formosa Plastics Group, Shell plc, and China Petrochemical Corp among others. LyondellBasell Industries NV led the industry with the highest share in 2022.

Propylene Industry Installed Capacity and CapEx By Companies, 2022 (%)

Propylene Industry Installed Capacity and CapEx By Companies, 2022 (%)

Buy the Full Report for Company-Wise Propylene Industry Installed Capacity and CapEx Insights, Download a Free Report Sample

Propylene Capacity and Capital Expenditure Market Regional Outlook (mtpa, 2022-2027)

  • Asia
  • North America
  • Europe
  • South America
  • Former Soviet Union
  • Middle East
  • Africa

Scope

The report provides

  • Global Propylene capacity outlook by region.
  • Global Propylene outlook by country.
  • Propylene planned and announced projects details.
  • Capacity share of the major Propylene producers globally.
  • Global Propylene capital expenditure outlook by region.
  • Global Propylene capital expenditure outlook by country.

Reasons to Buy

  • Obtain the most up-to-date information available on all active, planned, and announced Propylene plants globally
  • Identify opportunities in the global Propylene industry with the help of upcoming projects and capital expenditure outlook
  • Facilitate decision-making on the basis of strong historical and forecast of Propylene capacity data

Oriental Energy Co Ltd
Shandong Yulong Petrochemical Ltd
Fujian Eversun New Material Co Ltd
China National Petroleum Corp
Reliance Industries Ltd
The National Petrochemical Co
LyondellBasell Industries NV
Dow Chemical Co
Exxon Mobil Corp
Formosa Plastics Group

Table of Contents

1. Introduction 11

What is This Report About? 11

Market Definition 11

2. Global Propylene Capacity and Capital Expenditure Review 12

2.1 Global Propylene Industry, An Overview 12

2.2 Global Propylene Industry, Capacity by key countries 13

2.3 Global Propylene Industry, Capacity Share vis-à-vis Growth by Key Countries, 2017–2022 14

2.4 Global Propylene Industry, Top 10 Planned and Announced Projects 15

2.5 Global Propylene Industry, Capacity contribution by region 17

2.6 Key Companies by Propylene Capacity Contribution (% Share), 2022 18

2.7 Key Countries by Active Global Capacity Contribution to Propylene Industry 20

2.8 Key Feedstocks by Capacity Contributions to Global Propylene Industry 22

2.9 Regional Capacity Contributions to Global Propylene Industry by Feedstock 23

2.10 Regional Capacity Additions from Planned and Announced Projects 24

2.11 Global Capacity Additions from Planned and Announced Projects by Top 10 Countries 25

2.12 Global Capacity Additions from Planned and Announced Projects by Top 10 Companies 27

2.13 Regional Capex Spending on Planned and Announced Projects 29

2.14 Global Capex Spending on Planned and Announced Projects by countries 30

3. Global Planned and Announced Propylene Projects 31

4. Asia Propylene Industry 38

4.1 Asia Propylene Industry, An Overview 38

4.2 Asia Propylene Industry, Capacity by Key Countries, 2017–2027 39

4.3 Asia Propylene Industry, Capacity Share vis-à-vis Growth by Key Countries, 2017–2022 40

4.4 Asia Propylene Industry, New Build and Expansion Capital Expenditure Outlook for Planned and Announced Projects 41

4.5 Asia Propylene Industry, New Build and Expansion Capital Expenditure Outlook for Planned and Announced Projects by countries 42

4.6 Propylene Industry in China 43

4.7 Propylene Industry, South Korea 62

4.8 Propylene Industry, India 65

4.9 Propylene Industry, Japan 70

4.10 Propylene Industry, Taiwan 74

4.11 Propylene Industry, Thailand 76

4.12 Propylene Industry, Malaysia 78

4.13 Propylene Industry, Singapore 80

4.14 Propylene Industry, Indonesia 82

4.15 Propylene Industry, Vietnam 84

4.16 Propylene Industry, Philippines 85

4.17 Propylene Industry, Pakistan 86

5. North America Propylene Industry 87

5.1 North America Propylene Industry, An Overview 87

5.2 North America Propylene Industry, Capacity by Key Countries, 2017–2027 88

5.3 North America Propylene Industry, Capacity Share vis-à-vis Growth by Key Countries, 2017–2022 89

5.4 North America Propylene Industry, New Build and Expansion Capital Expenditure Outlook for Planned and Announced Projects 90

5.5 North America Propylene Industry, New Build and Expansion Capital Expenditure Outlook for Planned and Announced Projects by countries 91

5.6 Propylene Industry, United States 92

5.7 Propylene Industry, Canada 100

5.8 Propylene Industry, Mexico 101

6. Europe Propylene Industry 102

6.1 Europe Propylene Industry, An Overview 102

6.2 Europe Propylene Industry, Capacity by Key Countries, 2017–2027 103

6.3 Europe Propylene Industry, Capacity Share vis-à-vis Growth by Key Countries, 2017–2022 104

6.4 Europe Propylene Industry, Installed Plant Capacity by Production Process, 2022 105

6.5 Europe Propylene Industry, New Build and Expansion Capital Expenditure Outlook for Planned and Announced Projects 109

6.6 Europe Propylene Industry, New Build and Expansion Capital Expenditure Outlook for Planned and Announced Projects by countries 110

6.7 Propylene Industry, Germany 111

6.8 Propylene Industry, France 113

6.9 Propylene Industry, Belgium 114

6.10 Propylene Industry, Netherlands 115

6.11 Propylene Industry, Spain 116

6.12 Propylene Industry, Italy 117

6.13 Propylene Industry, United Kingdom 118

6.14 Propylene Industry, Poland 119

6.15 Propylene Industry, Austria 120

6.16 Propylene Industry, Romania 121

6.17 Propylene Industry, Hungary 122

6.18 Propylene Industry, Czech Republic 123

6.19 Propylene Industry, Finland 124

6.20 Propylene Industry, Sweden 125

6.21 Propylene Industry, Portugal 126

6.22 Propylene Industry, Slovakia 127

6.23 Propylene Industry, Greece 128

6.24 Propylene Industry, Serbia 129

6.25 Propylene Industry, Croatia 130

6.26 Propylene Industry, Norway 131

6.27 Propylene Industry, Bulgaria 132

7. Middle East Propylene Industry 133

7.1 Middle East Propylene Industry, An Overview 133

7.2 Middle East Propylene Industry, Capacity by Key Countries, 2017–2027 134

7.3 Middle East Propylene Industry, Capacity Share vis-à-vis Growth by Key Countries, 2017–2022 135

7.4 Middle East Propylene Industry, Installed Plant Capacity by Production Process, 2022 136

7.5 Middle East Propylene Industry, Installed Plant Capacity by Technology, 2022 140

7.6 Middle East Propylene Industry, New Build and Expansion Capital Expenditure Outlook for Planned and Announced Projects 143

7.7 Middle East Propylene Industry, New Build and Expansion Capital Expenditure Outlook for Planned and Announced Projects by countries 144

7.8 Propylene Industry, Saudi Arabia 145

7.9 Propylene Industry, United Arab Emirates 149

7.10 Propylene Industry, Iran 150

7.11 Propylene Industry, Oman 155

7.12 Propylene Industry, Israel 156

7.13 Propylene Industry, Turkey 157

7.14 Propylene Industry, Kuwait 158

8. Former Soviet Union (FSU) Propylene Industry 159

8.1 FSU Propylene Industry, An Overview 159

8.2 FSU Propylene Industry, Capacity by Key Countries, 2017–2027 160

8.3 FSU Propylene Industry, Capacity Share vis-à-vis Growth by Key Countries, 2017–2022 161

8.4 FSU Propylene Industry, Installed Plant Capacity by Production Process, 2022 162

8.5 FSU Propylene Industry, New Build and Expansion Capital Expenditure Outlook for Planned and Announced Projects 165

8.6 FSU Propylene Industry, New Build and Expansion Capital Expenditure Outlook for Planned and Announced Projects by countries 166

8.7 Propylene Industry, Russia 167

8.8 Propylene Industry, Kazakhstan 170

8.9 Propylene Industry, Azerbaijan 171

8.10 Propylene Industry, Ukraine 172

8.11 Propylene Industry, Uzbekistan 173

8.12 Propylene Industry, Belarus 174

9. South America Propylene Industry 175

9.1 South America Propylene Industry, An Overview 175

9.2 South America Propylene Industry, Capacity by Key Countries, 2017–2027 176

9.3 South America Propylene Industry, Capacity Share vis-à-vis Growth by Key Countries, 2017–2022 177

9.4 Propylene Industry, Brazil 178

9.5 Propylene Industry, Argentina 180

9.6 Propylene Industry, Venezuela 181

9.7 Propylene Industry, Colombia 182

10. Africa Propylene Industry 183

10.1 Africa Propylene Industry, An Overview 183

10.2 Africa Propylene Industry, Capacity by Key Countries, 2017–2027 184

10.3 Africa Propylene Industry, Capacity Share vis-à-vis Growth by Key Countries, 2017–2022 185

10.4 Africa Propylene Industry, New Build and Expansion Capital Expenditure Outlook for Planned and Announced Projects 186

10.5 Africa Propylene Industry, New Build and Expansion Capital Expenditure Outlook for Planned and Announced Projects by countries 187

10.6 Propylene Industry, South Africa 188

10.7 Propylene Industry, Egypt 189

10.8 Propylene Industry, Libya 190

10.9 Propylene Industry, Algeria 191

11. Oceania Propylene Industry 192

11.1 Oceania Propylene Industry, An Overview 192

11.2 Oceania Propylene Industry, Capacity by Key Countries, 2017–2027 193

11.3 Oceania Propylene Industry, Capacity Share vis-à-vis Growth by Key Countries, 2017–2022 194

11.4 Propylene Industry, Australia 195

12. Appendix 196

12.1 Definitions 196

12.2 Abbreviations 196

12.3 Status Definition 197

12.4 Methodology 197

Contact Us 198

Table

Table 1: Propylene Industry, Global, key statistics, 2022 12

Table 2: Propylene Industry, Global, Capacity by Key Countries (mtpa), 2017–2027 13

Table 3: Propylene Industry, Global, Top 10 Planned and Announced Projects Details, 2023–2027 15

Table 4: Propylene Industry, Global, capacity by region (mtpa), 2022–2027 17

Table 5: Propylene Industry, global, capacity share of top 10 Companies (%), 2022 19

Table 6: Propylene Industry, global, active Capacity of Top 10 Countries (mtpa), 2022 21

Table 7: Global Propylene capacity share by feedstock (%) 22

Table 8: Total Propylene feedstock by region (mtpa) 23

Table 9: Propylene Industry, global, planned and announced capacity additions by region (mtpa), 2027 24

Table 10: Propylene Industry, global, planned and announced capacity additions by top 10 countries (mtpa), 2027 26

Table 11: Propylene Industry, global, planned and announced capacity additions by Top 10 Companies (mtpa), 2027 28

Table 12: Propylene Industry, Global, Total Capex Spending on Planned and Announced Projects by Region ($ bil), 2023–2027 29

Table 13: Propylene Industry, Global, Total Capex Spending on Planned and Announced Projects by Countries ($ bil), 2023–2027 30

Table 14: Global, planned and announced Propylene projects details 31

Table 15: Propylene Industry, Asia, key statistics, 2022 38

Table 16: Propylene Industry, Asia, Capacity by Key Countries (mtpa), 2017–2027 39

Table 17: Propylene Industry, Asia, New Build and Expansion Capital Expenditure Outlook for Planned and Announced Projects ($B), 2023–2027 41

Table 18: Propylene Industry, Asia, New Build and Expansion Capital Expenditure Outlook for Planned and Announced Projects by Countries ($B), 2023–2027 42

Table 19: Propylene Industry, China, Capacity by Major Plants (mtpa) 2017–2027 43

Table 20: Propylene Industry, South Korea, Capacity by Major Plants (mtpa) 2017–2027 62

Table 21: Propylene Industry, India, Capacity by Major Plants (mtpa) 2017–2027 65

Table 22: Propylene Industry, Japan, Capacity by Major Plants (mtpa) 2017–2027 70

Table 23: Propylene Industry, Taiwan, Capacity by Major Plants (mtpa) 2017–2027 74

Table 24: Propylene Industry, Thailand, Capacity by Major Plants (mtpa) 2017–2027 76

Table 25: Propylene Industry, Malaysia, Capacity by Major Plants (mtpa) 2017–2027 78

Table 26: Propylene Industry, Singapore, Capacity by Major Plants (mtpa) 2017–2027 80

Table 27: Propylene Industry, Indonesia, Capacity by Major Plants (mtpa) 2017–2027 82

Table 28: Propylene Industry, Vietnam, Capacity by Major Plants (mtpa) 2017–2027 84

Table 29: Propylene Industry, Philippines, Capacity by Major Plants (mtpa) 2017–2027 85

Table 30: Propylene Industry, Pakistan, Capacity by Major Plants (mtpa) 2017–2027 86

Table 31: Propylene Industry, North America, key statistics, 2022 87

Table 32: Propylene Industry, North America, Capacity by Key Countries (mtpa), 2017–2027 88

Table 33: Propylene Industry, North America, New Build and Expansion Capital Expenditure Outlook for Planned and Announced Projects ($B), 2023–2027 90

Table 34: Propylene Industry, North America, New Build and Expansion Capital Expenditure Outlook for Planned and Announced Projects by Countries ($B), 2023–2027 91

Table 35: Propylene Industry, US, Capacity by Major Plants (mtpa) 2017–2027 92

Table 36: Propylene Industry, Canada, Capacity by Major Plants (mtpa) 2017–2027 100

Table 37: Propylene Industry, Mexico, Capacity by Major Plants (mtpa) 2017–2027 101

Table 38: Propylene Industry, Europe, key statistics, 2022 102

Table 39: Propylene Industry, Europe, Capacity by Key Countries (mtpa), 2017–2027 103

Table 40: Europe, Propylene Industry, Installed Plant Capacity by Production Process (%) 2022 106

Table 41: Europe, Propylene Industry, Installed Plant Capacity by Steam Cracking process, 2022 106

Table 42: Europe, Propylene Industry, Installed Plant Capacity by Fluid Catalytic Cracking process, 2022 107

Table 43: Europe, Propylene Industry, Installed Plant Capacity by Propane Dehydrogenation process, 2022 108

Table 44: Europe, Propylene Industry, Installed Plant Capacity by Olefin Metathesis process, 2022 108

Table 45: Propylene Industry, Europe, New Build and Expansion Capital Expenditure Outlook for Planned and Announced Projects ($B), 2023–2027 109

Table 46: Propylene Industry, Europe, New Build and Expansion Capital Expenditure Outlook for Planned and Announced Projects by Countries ($B), 2023–2027 110

Table 47: Propylene Industry, Germany, Capacity by Major Plants (mtpa) 2017–2027 111

Table 48: Propylene Industry, France, Capacity by Major Plants (mtpa) 2017–2027 113

Table 49: Propylene Industry, Belgium, Capacity by Major Plants (mtpa) 2017–2027 114

Table 50: Propylene Industry, Netherlands, Capacity by Major Plants (mtpa) 2017–2027 115

Table 51: Propylene Industry, Spain, Capacity by Major Plants (mtpa) 2017–2027 116

Table 52: Propylene Industry, Italy, Capacity by Major Plants (mtpa) 2017–2027 117

Table 53: Propylene Industry, United Kingdom, Capacity by Major Plants (mtpa) 2017–2027 118

Table 54: Propylene Industry, Poland, Capacity by Major Plants (mtpa) 2017–2027 119

Table 55: Propylene Industry, Austria, Capacity by Major Plants (mtpa) 2017–2027 120

Table 56: Propylene Industry, Romania, Capacity by Major Plants (mtpa) 2017–2027 121

Table 57: Propylene Industry, Hungary, Capacity by Major Plants (mtpa) 2017–2027 122

Table 58: Propylene Industry, Czech Republic, Capacity by Major Plants (mtpa) 2017–2027 123

Table 59: Propylene Industry, Finland, Capacity by Major Plants (mtpa) 2017–2027 124

Table 60: Propylene Industry, Sweden, Capacity by Major Plants (mtpa) 2017–2027 125

Table 61: Propylene Industry, Portugal, Capacity by Major Plants (mtpa) 2017–2027 126

Table 62: Propylene Industry, Slovakia, Capacity by Major Plants (mtpa) 2017–2027 127

Table 63: Propylene Industry, Greece, Capacity by Major Plants (mtpa) 2017–2027 128

Table 64: Propylene Industry, Serbia, Capacity by Major Plants (mtpa) 2017–2027 129

Table 65: Propylene Industry, Croatia, Capacity by Major Plants (mtpa) 2017–2027 130

Table 66: Propylene Industry, Norway, Capacity by Major Plants (mtpa) 2017–2027 131

Table 67: Propylene Industry, Bulgaria, Capacity by Major Plants (mtpa) 2017–2027 132

Table 68: Propylene Industry, Middle East, key statistics, 2022 133

Table 69: Propylene Industry, Middle East, Capacity by Key Countries (mtpa), 2017–2027 134

Table 70: Middle East, Propylene Industry, Installed Plant Capacity by Production Process (%) 2022 137

Table 71: Middle East, Propylene Industry, Installed Plant Capacity by Steam Cracking process, 2022 137

Table 72: Middle East, Propylene Industry, Installed Plant Capacity by Propane Dehydrogenation process, 2022 138

Table 73: Middle East, Propylene Industry, Installed Plant Capacity by Fluid Catalytic Cracking process, 2022 138

Table 74: Middle East, Propylene Industry, Installed Plant Capacity by Olefin Metathesis process, 2022 139

Table 75: Middle East, Propylene Industry, Installed Plant Capacity by Technology (%) 2022 141

Table 76: Middle East, Propylene Industry, Installed Plant Capacity by Lummus Propylene Technology, 2022 141

Table 77: Middle East, Propylene Industry, Installed Plant Capacity by TechnipFMC Propylene Technology, 2022 142

Table 78: Middle East, Propylene Industry, Installed Plant Capacity by Honeywell Propylene Technology, 2022 142

Table 79: Middle East, Propylene Industry, Installed Plant Capacity by KBR Propylene Technology, 2022 142

Table 80: Propylene Industry, Middle East, New Build and Expansion Capital Expenditure Outlook for Planned and Announced Projects ($B), 2023–2027 143

Table 81: Propylene Industry, Middle East, New Build and Expansion Capital Expenditure Outlook for Planned and Announced Projects by Countries ($B), 2023–2027 144

Table 82: Propylene Industry, Saudi Arabia, Capacity by Major Plants (mtpa) 2017–2027 145

Table 83: Propylene Industry, UAE, Capacity by Major Plants (mtpa) 2017–2027 149

Table 84: Propylene Industry, Iran, Capacity by Major Plants (mtpa) 2017–2027 150

Table 85: Propylene Industry, Oman, Capacity by Major Plants (mtpa) 2017–2027 155

Table 86: Propylene Industry, Israel, Capacity by Major Plants (mtpa) 2017–2027 156

Table 87: Propylene Industry, Turkey, Capacity by Major Plants (mtpa) 2017–2027 157

Table 88: Propylene Industry, Kuwait, Capacity by Major Plants (mtpa) 2017–2027 158

Table 89: Propylene Industry, FSU, key statistics, 2022 159

Table 90: Propylene Industry, FSU, Capacity by Key Countries (mtpa), 2017–2027 160

Table 91: FSU, Propylene Industry, Installed Plant Capacity by Production Process (%) 2022 163

Table 92: FSU, Propylene Industry, Installed Plant Capacity by Propane Dehydrogenation process, 2022 163

Table 93: FSU, Propylene Industry, Installed Plant Capacity by Steam Cracking process, 2022 163

Table 94: FSU, Propylene Industry, Installed Plant Capacity by Fluid Catalytic Cracking process, 2022 164

Table 95: Propylene Industry, FSU, New Build and Expansion Capital Expenditure Outlook for Planned and Announced Projects ($B), 2023–2027 165

Table 96: Propylene Industry, FSU, New Build and Expansion Capital Expenditure Outlook for Planned and Announced Projects by Countries ($B), 2023–2027 166

Table 97: Propylene Industry, Russia, Capacity by Major Plants (mtpa) 2017–2027 167

Table 98: Propylene Industry, Kazakhstan, Capacity by Major Plants (mtpa) 2017–2027 170

Table 99: Propylene Industry, Azerbaijan, Capacity by Major Plants (mtpa) 2017–2027 171

Table 100: Propylene Industry, Ukraine, Capacity by Major Plants (mtpa) 2017–2027 172

Table 101: Propylene Industry, Uzbekistan, Capacity by Major Plants (mtpa) 2017–2027 173

Table 102: Propylene Industry, Belarus, Capacity by Major Plants (mtpa) 2017–2027 174

Table 103: Propylene Industry, South America, key statistics, 2022 175

Table 104: Propylene Industry, South America, Capacity by Key Countries (mtpa), 2017–2027 176

Table 105: Propylene Industry, Brazil, Capacity by Major Plants (mtpa) 2017–2027 178

Table 106: Propylene Industry, Argentina, Capacity by Major Plants (mtpa) 2017–2027 180

Table 107: Propylene Industry, Venezuela, Capacity by Major Plants (mtpa) 2017–2027 181

Table 108: Propylene Industry, Colombia, Capacity by Major Plants (mtpa) 2017–2027 182

Table 109: Propylene Industry, Africa, key statistics, 2022 183

Table 110: Propylene industry, Africa, Capacity by Key Countries (mtpa), 2017–2027 184

Table 111: Propylene Industry, Africa, New Build and Expansion Capital Expenditure Outlook for Planned and Announced Projects ($B), 2023–2027 186

Table 112: Propylene Industry, Africa, New Build and Expansion Capital Expenditure Outlook for Planned and Announced Projects by Countries ($B), 2023–2027 187

Table 113: Propylene Industry, South Africa, Capacity by Major Plants (mtpa) 2017–2027 188

Table 114: Propylene Industry, Egypt, Capacity by Major Plants (mtpa) 2017–2027 189

Table 115: Propylene Industry, Libya, Capacity by Major Plants (mtpa) 2017–2027 190

Table 116: Propylene Industry, Algeria, Capacity by Major Plants (mtpa) 2017–2027 191

Table 117: Propylene Industry, Oceania, key statistics, 2022 192

Table 118: Propylene Industry, Oceania, Capacity by Key Countries (mtpa), 2017–2027 193

Table 119: Propylene Industry, Australia, Capacity by Major Plants (mtpa) 2017–2027 195

Figures

Figure 1: Global Propylene Industry, Capacity Share vis-à-vis Growth by Key Countries, 2017–2022 14

Figure 2: Propylene Industry, global, capacity by region (mtpa), 2022–2027 17

Figure 3: Propylene Industry, global, capacity share of top 10 companies (%), 2022 18

Figure 4: Propylene Industry, global, active capacity of top 10 countries (mtpa), 2022 20

Figure 5: Global Propylene capacity share by feedstock (%) 22

Figure 6: Total Propylene feedstock by region (mtpa) 23

Figure 7: Propylene Industry, global, planned and announced capacity additions by region (mtpa), 2027 24

Figure 8: Propylene Industry, global, planned and announced Capacity Additions by Top 10 countries (mtpa), 2027 25

Figure 9: Propylene Industry, global, planned and announced Capacity Additions by Top 10 companies (mtpa), 2027 27

Figure 10: Propylene Industry, Total Capex Spending on Planned and Announced Projects by Region ($ bil), 2023–2027 29

Figure 11: Propylene Industry, Total Capex Spending on Planned and Announced Projects by Countries ($ bil), 2023–2027 30

Figure 12: Propylene Industry, Asia, Capacity Share vis-à-vis Growth by Key Countries, 2017–2022 40

Figure 13: Propylene Industry, Asia, New Build and Expansion Capital Expenditure Outlook for Planned and Announced Projects ($B), 2023–2027 41

Figure 14: Propylene Industry, Asia, New Build and Expansion Capital Expenditure Outlook for Planned and Announced Projects by Countries ($B), 2023–2027 42

Figure 15: Propylene Industry, North America, Capacity Share vis-à-vis Growth by Key Countries, 2017–2022 89

Figure 16: Propylene Industry, North America, New Build and Expansion Capital Expenditure Outlook for Planned and Announced Projects ($B), 2023–2027 90

Figure 17: Propylene Industry, North America, New Build and Expansion Capital Expenditure Outlook for Planned and Announced Projects by Countries ($B), 2023–2027 91

Figure 18: Propylene Industry, Europe, Capacity Share vis-à-vis Growth by Key Countries, 2017–2022 104

Figure 19: Europe, Propylene Industry, Installed Plant Capacity by Production Process (%) 2022 105

Figure 20: Propylene Industry, Europe, New Build and Expansion Capital Expenditure Outlook for Planned and Announced Projects ($B), 2023–2027 109

Figure 21: Propylene Industry, Europe, New Build and Expansion Capital Expenditure Outlook for Planned and Announced Projects by Countries ($B), 2023–2027 110

Figure 22: Propylene Industry, Middle East, Capacity Share vis-à-vis Growth by Key Countries, 2017–2022 135

Figure 23: Middle East, Propylene Industry, Installed Plant Capacity by Production Process (%) 2022 136

Figure 24: Middle East, Propylene Industry, Installed Plant Capacity by Technology (%) 2022 140

Figure 25:Propylene Industry, Middle East, New Build and Expansion Capital Expenditure Outlook for Planned and Announced Projects ($B), 2023–2027 143

Figure 26: Propylene Industry, Middle East, New Build and Expansion Capital Expenditure Outlook for Planned and Announced Projects by Countries ($B), 2023–2027 144

Figure 27: Propylene Industry, FSU, Capacity Share vis-à-vis Growth by Key Countries, 2017–2022 161

Figure 28: FSU, Propylene Industry, Installed Plant Capacity by Production Process (%) 2022 162

Figure 29:Propylene Industry, FSU, New Build and Expansion Capital Expenditure Outlook for Planned and Announced Projects ($B), 2023–2027 165

Figure 30: Propylene Industry, FSU, New Build and Expansion Capital Expenditure Outlook for Planned and Announced Projects by Countries ($B), 2023–2027 166

Figure 31: Propylene Industry, South America, Capacity Share vis-à-vis Growth by Key Countries, 2017–2022 177

Figure 32: Propylene Industry, Africa, Capacity Share vis-à-vis Growth by Key Countries, 2017–2022 185

Figure 33: Propylene Industry, Africa, New Build and Expansion Capital Expenditure Outlook for Planned and Announced Projects ($B), 2023–2027 186

Figure 34: Propylene Industry, Africa, New Build and Expansion Capital Expenditure Outlook for Planned and Announced Projects by Countries ($B), 2023–2027 187

Figure 35: Propylene Industry, Oceania, Capacity Share vis-à-vis Growth by Key Countries, 2017–2022 194

Frequently asked questions

Propylene Industry Installed Capacity and Capital Expenditure Forecast by Region and All Active and Planned Projects to 2027 standard reports
Currency USD
$3,995

Can be used by individual purchaser only

$11,985

Can be shared globally by unlimited users within the purchasing corporation e.g. all employees of a single company


Undecided about purchasing this report?

Enquire Before Buying Request a Free Sample

Get in touch to find out about multi-purchase discounts

reportstore@globaldata.com
Tel +44 20 7947 2745

Every customer’s requirement is unique. With over 220,000 construction projects tracked, we can create a tailored dataset for you based on the types of projects you are looking for. Please get in touch with your specific requirements and we can send you a quote.

Sample Report

Propylene Industry Installed Capacity and Capital Expenditure Forecast by Region and All Active and Planned Projects to 2027 was curated by the best experts in the industry and we are confident about its unique quality. However, we want you to make the most beneficial decision for your business, so we offer free sample pages to help you:

  • Assess the relevance of the report
  • Evaluate the quality of the report
  • Justify the cost

Download your copy of the sample report and make an informed decision about whether the full report will provide you with the insights and information you need.

Below is a sample report to understand what you are buying

See what our customers are saying

“The GlobalData platform is our go-to tool for intelligence services. GlobalData provides an easy way to access comprehensive intelligence data around multiple sectors, which essentially makes it a one-for-all intelligence platform, for tendering and approaching customers.

GlobalData is very customer orientated, with a high degree of personalised services, which benefits everyday use. The highly detailed project intelligence and forecast reports can be utilised across multiple departments and workflow scopes, from operational to strategic level, and often support strategic decisions. GlobalData Analytics and visualisation solutions has contributed positively when preparing management presentations and strategic papers.”

Business Intelligence & Marketing Manager, SAL Heavy Lift

“COVID-19 has caused significant interference to our business and the COVID-19 intelligence from GlobalData has helped us reach better decisions around strategy. These two highlights have helped enormously to understand the projections into the future concerning our business units, we also utilise the project database to source new projects for Liebherr-Werk to use as an additional source to pitch for new business.”

Market Analyst & Management, Liebherr-Werk

Your daily news has saved me a lot of time and keeps me up-to-date with what is happening in the market, I like that you almost always have a link to the source origin. We also use your market data in our Strategic Business Process to support our business decisions. By having everything in one place on the Intelligence Center it has saved me a lot of time versus looking on different sources, the alert function also helps with this.

Head of Key Accounts, Saab AB

Having used several other market research companies, I find that GlobalData manages to provide that ‘difficult-to-get’ market data that others can’t, as well as very diverse and complete consumer surveys.

Marketing Intelligence Manager, Portugal Foods

Our experience with GlobalData has been very good, from the platform itself to the people. I find that the analysts and the account team have a high level of customer focus and responsiveness and therefore I can always rely on. The platform is more holistic than other providers. It is convenient and almost like a one stop shop. The pricing suite is highly competitive and value for our organisation.

I like reports that inform new segments such as the analysis on generation Z, millennials, the impact of COVID 19 to our banking customers and their new channel habits. Secondly the specialist insight on affluent sector significantly increases our understanding about this group of customers. The combination of those give us depth and breadth of the evolving market.

I’m in the business of answering and helping people make decisions so with the intelligence center I can do that, effectively and efficiently. I can share quickly key insights that answer and satisfy our country stakeholders by giving them many quality studies and primary research about competitive landscape beyond the outlook of our bank. It helps me be seen as an advisory partner and that makes a big difference. A big benefit of our subscription is that no one holds the whole data and because it allows so many people, so many different parts of our organisation have access, it enables all teams to have the same level of knowledge and decision support.

Head of Customer Insight and Research, Standard Chartered

“I know that I can always rely on Globaldata’s work when I’m searching for the right consumer and market insights. I use Globaldata insights to understand the changing market & consumer landscape and help create better taste & wellbeing solutions for our customers in food, beverage and healthcare industries.

Globaldata has the right data and the reports are of very high quality compared to your competitors. Globaldata not only has overall market sizes & consumer insights on food & beverages but also provides insights at the ingredient & flavour level. That is key for B2B companies like Givaudan. This way we understand our customers’ business and also gain insight to our unique industry”

Head of Consumer Sensory Insights, Givaudan

GlobalData provides a great range of information and reports on various sectors that is highly relevant, timely, easy to access and utilise.  The reports and data dashboards help engagement with clients; they provide valuable industry and market insights that can enrich client conversations and can help in the shaping of value propositions. Moreover, using GlobalData products has helped increase my knowledge of the finance sector, the players within it, and the general threats and opportunities.

I find the consumer surveys that are carried out to be extremely beneficial and not something I have seen anywhere else. They provided an insightful view of why and which consumers take (or don’t) particular financial products. This can help shape conversations with clients to ensure they make the right strategic decisions for their business.

One of the challenges I have found is that data in the payments space is often piecemeal. With GD all of the data I need is in one place, but it also comes with additional market reports that provide useful extra context and information. Having the ability to set-up alerts on relevant movements in the industry, be it competitors or customers, and have them emailed directly to me, ensures I get early sight of industry activity and don’t have to search for news.

Senior Account Manager, TSYS
Go even deeper with GlobalData Intelligence Center

Every Company Report we produce is powered by the GlobalData Intelligence Center.

Subscribing to our intelligence platform means you can monitor developments at Propylene Industry Installed Capacity and Capital Expenditure Forecast by Region and All Active and Planned Projects to 2027 in real time.

  • Access a live Propylene Industry Installed Capacity and Capital Expenditure Forecast by Region and All Active and Planned Projects to 2027 dashboard for 12 months, with up-to-the-minute insights.
  • Fuel your decision making with real-time deal coverage and media activity.
  • Turn insights on financials, deals, products and pipelines into powerful agents of commercial advantage.