Purified Terephthalic Acid (PTA) Industry Capacity and Capital Expenditure Forecasts with Details of All Active and Planned Plants to 2028

Powered by

All the vital news, analysis, and commentary curated by our industry experts.

PTA Capacity and Capital Expenditure Market Report Overview

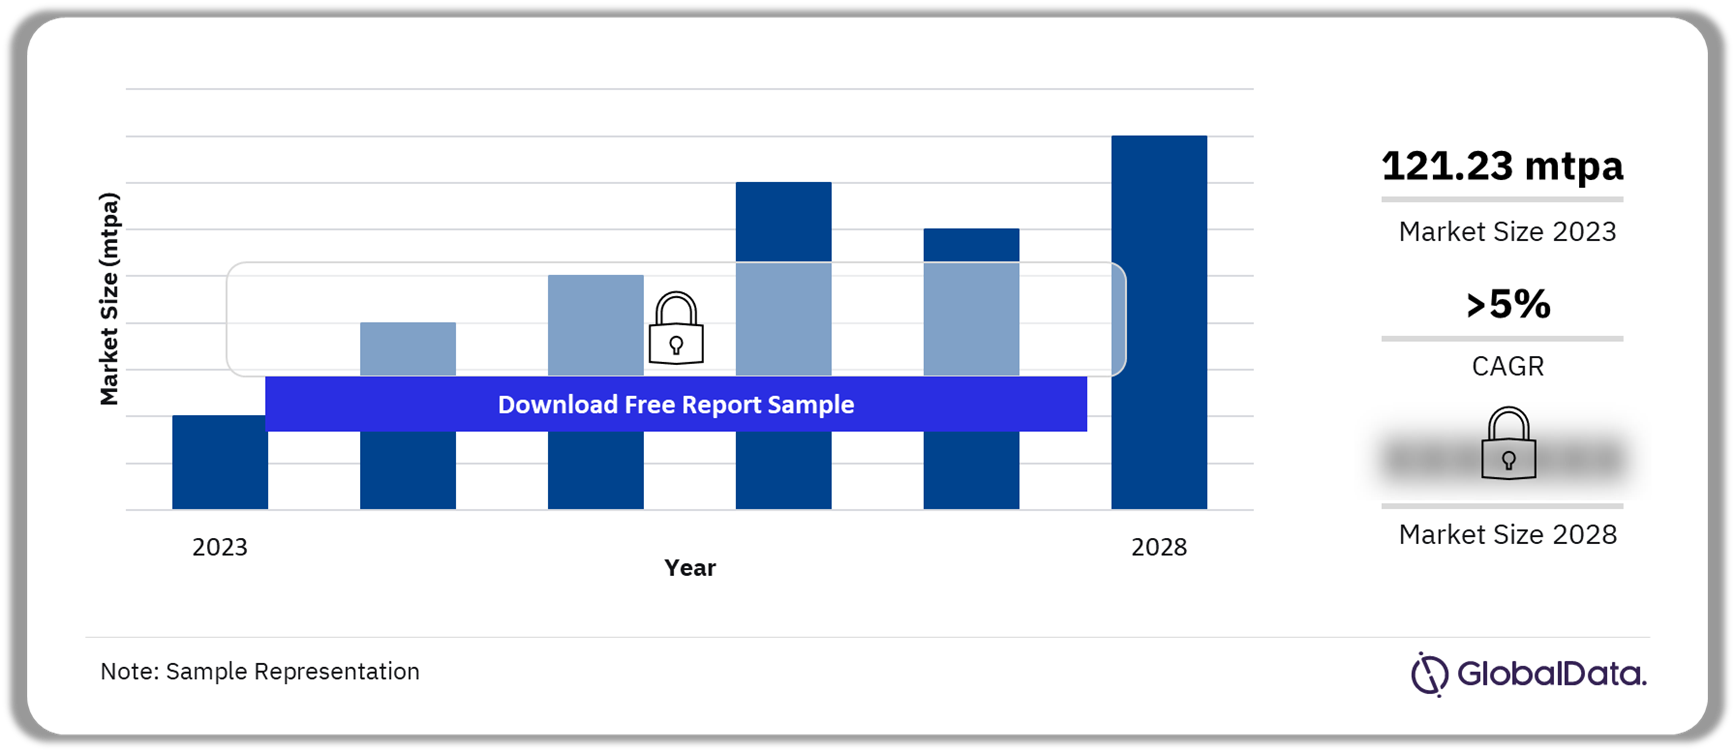
The Purified Terephthalic Acid (PTA) capacity was 121.23 million tonnes per annum (mtpa) in 2023 and will increase at an AAGR of more than 5% from 2023 to 2028.

In 2023, Iran, Saudi Arabia, and Turkey were the leading countries in the Middle East accounting for the total PTA capacity in the region. Large-scale production of polyester fiber in these regions, using PTA, drives its increasing consumption. This fiber finds applications in industries such as packaging and textiles.

Purified Terephthalic Acid (PTA) Capacity and Capex Outlook, 2023-2028 (mtpa)

Purified Terephthalic Acid (PTA) Capacity and Capex Outlook, 2023-2028 (mtpa)

Buy the Full Report for More Insights on Purified Terephthalic Acid (PTA) Capacity and Capex Forecast
Download a Free Report Sample

The Purified Terephthalic Acid (PTA) capacity and capex report outlook is a comprehensive report on all active and upcoming (planned and announced) Purified Terephthalic Acid (PTA) plants by region and country for the period 2018-2028. It provides global and regional capital expenditure outlook forecasts up to 2028. Furthermore, the report gives a comparative analysis of key companies based on their global capacity contribution.

Market Capacity 2023 121.23 Mtpa
AAGR (2023-2028) >5%
Historical Period 2018-2023
Forecast Period 2023-2028
Key Regions ·        Asia

·        Middle East

·        Former Soviet Union (FSU)

Key Projects ·        Guangxi Tongkun Petrochemical Qinzhou Purified Terephthalic Acid (PTA) Plant

·        Reliance Industries Dahej Purified Terephthalic Acid (PTA) Plant 3

·        Fujian Fuhaichuang Petrochemical Zhangzhou Purified Terephthalic Acid (PTA) Plant

·        Sinopec Yizheng Chemical Fibre Yizheng Purified Terephthalic Acid (PTA) Plant 3

·        Hainan Yisheng Petrochemical Yangpu Purified Terephthalic Acid (PTA) Plant

Leading Companies ·        Hengli Petrochemical (Dalian) Co Ltd

·        Zhejiang Rongsheng Holding Group Co Ltd

·        Zhejiang Hengyi Group Co Ltd

·        INEOS Ltd

·        Xianglu Petrochemicals Co Ltd

Enquire & Decide Discover the perfect solution for your business needs. Enquire now and let us help you make an informed decision before making a purchase.

Purified Terephthalic Acid (PTA) Capacity and Capex by Regions

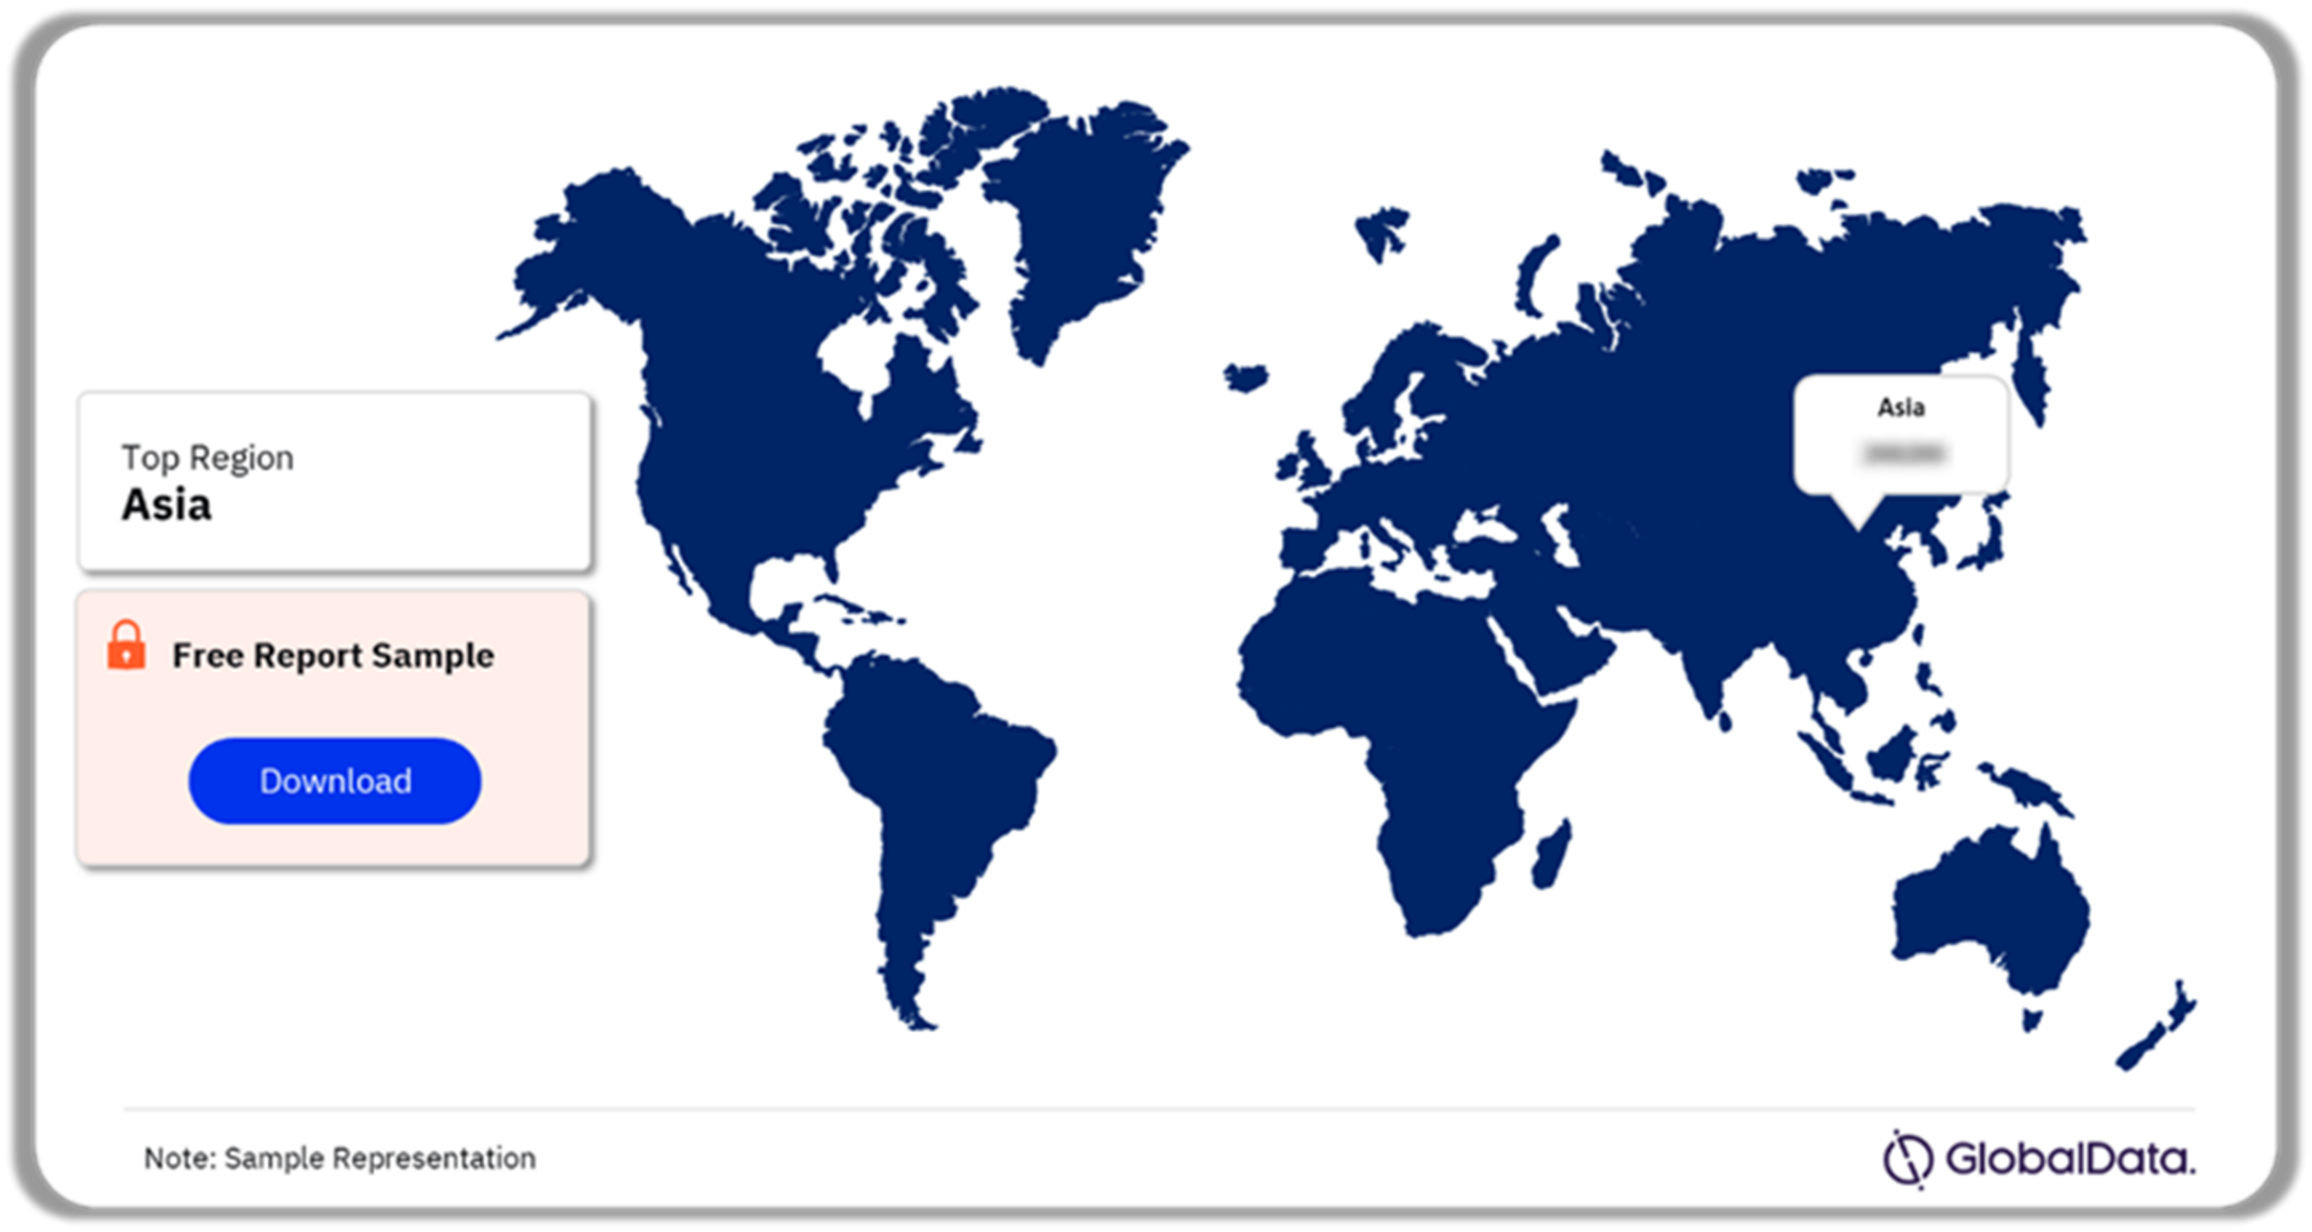
Among regions, the key Purified Terephthalic Acid (PTA) capacity contributors include Asia, the Middle East and FSU. Asia led with the largest capacity contribution globally over the next five years, followed by Middle Est and FSU. Asia, the Middle East, and the FSU primarily drive the global PTA capacity growth during the outlook period.

Asia also led with the largest capacity additions from the new build and expansion of the existing PTA projects by 2028. There are around 16 new build and expansion projects starting operations during this period.

Regional Purified Terephthalic Acid (PTA) Capacity and Capex Analysis, 2023 (%)

Regional Purified Terephthalic Acid (PTA) Capacity and Capex Analysis, 2023 (%)

Buy the Full Report for Regional Purified Terephthalic Acid (PTA) Capacity and Capex Insights
Download a Free Report Sample

Purified Terephthalic Acid (PTA) Capacity and Capex by Planned, and Announced Projects

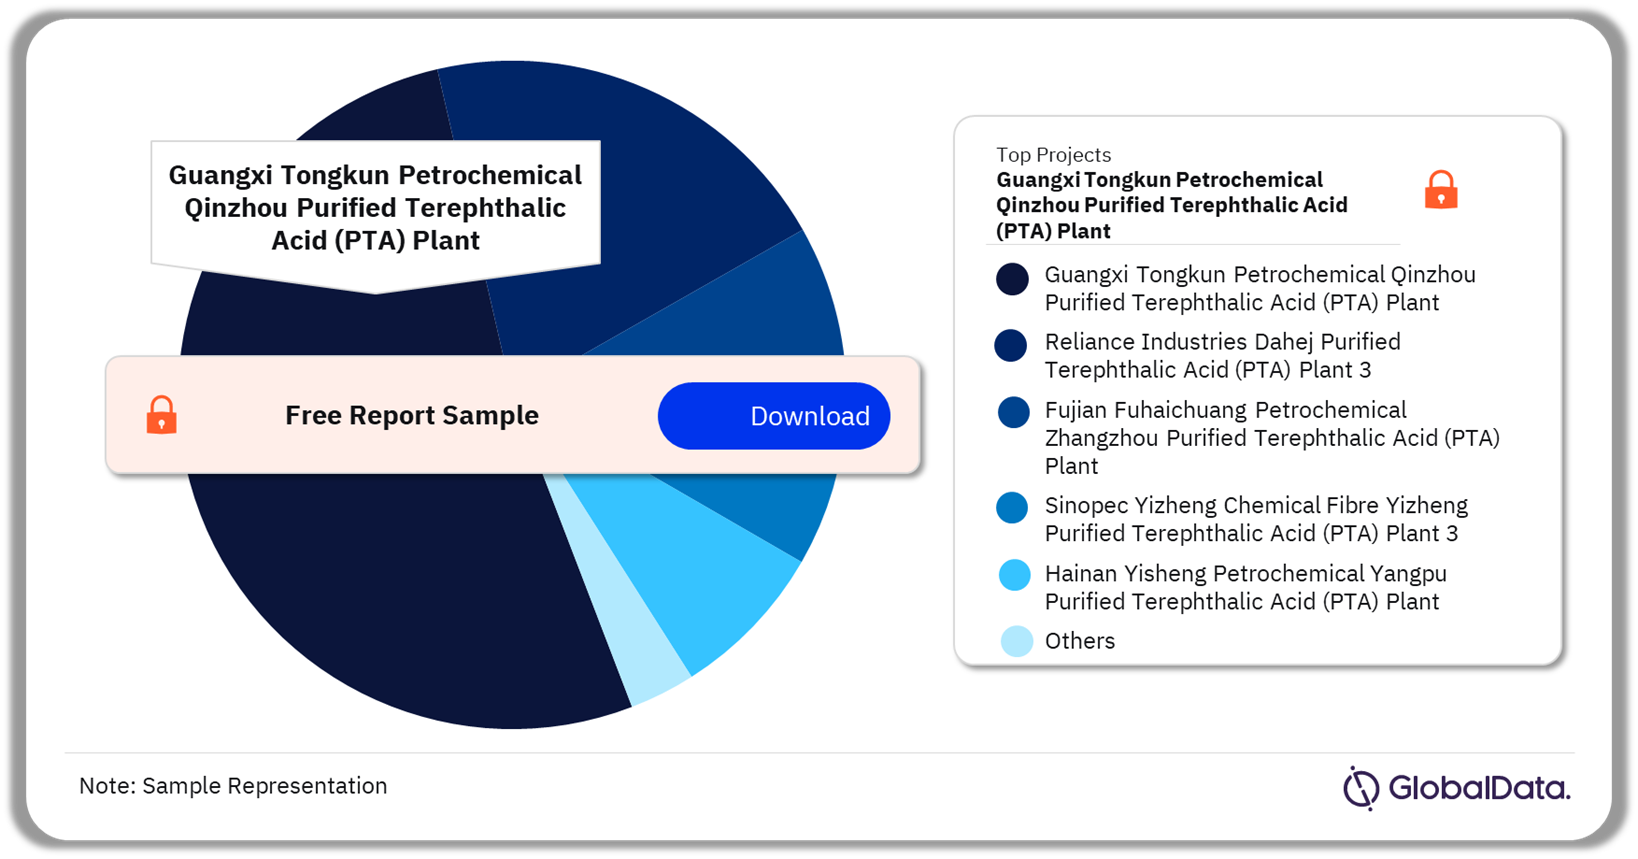
A few of the top planned and announced Purified Terephthalic Acid projects are Guangxi Tongkun Petrochemical Qinzhou Purified Terephthalic Acid (PTA) Plant, Reliance Industries Dahej Purified Terephthalic Acid (PTA) Plant 3, Fujian Fuhaichuang Petrochemical Zhangzhou Purified Terephthalic Acid (PTA) Plant, Sinopec Yizheng Chemical Fibre Yizheng Purified Terephthalic Acid (PTA) Plant 3 and Hainan Yisheng Petrochemical Yangpu Purified Terephthalic Acid (PTA) Plant and among others.

Guangxi Tongkun Petrochemical Qinzhou Purified Terephthalic Acid (PTA) Plant, operated by Guangxi Tongkun Petrochemical Co Ltd will start operations by 2025, with a capacity of 3.00 mtpa.

Top Purified Terephthalic Acid (PTA) Capacity and Capex Projects, 2024-2028 (%)

Top Purified Terephthalic Acid (PTA) Capacity and Capex Projects, 2024-2028 (%)

Buy the Full Report for Project Insights into the Purified Terephthalic Acid (PTA) Download a Free Report Sample

Purified Terephthalic Acid (PTA) Capacity and Capex - Competitive Landscape

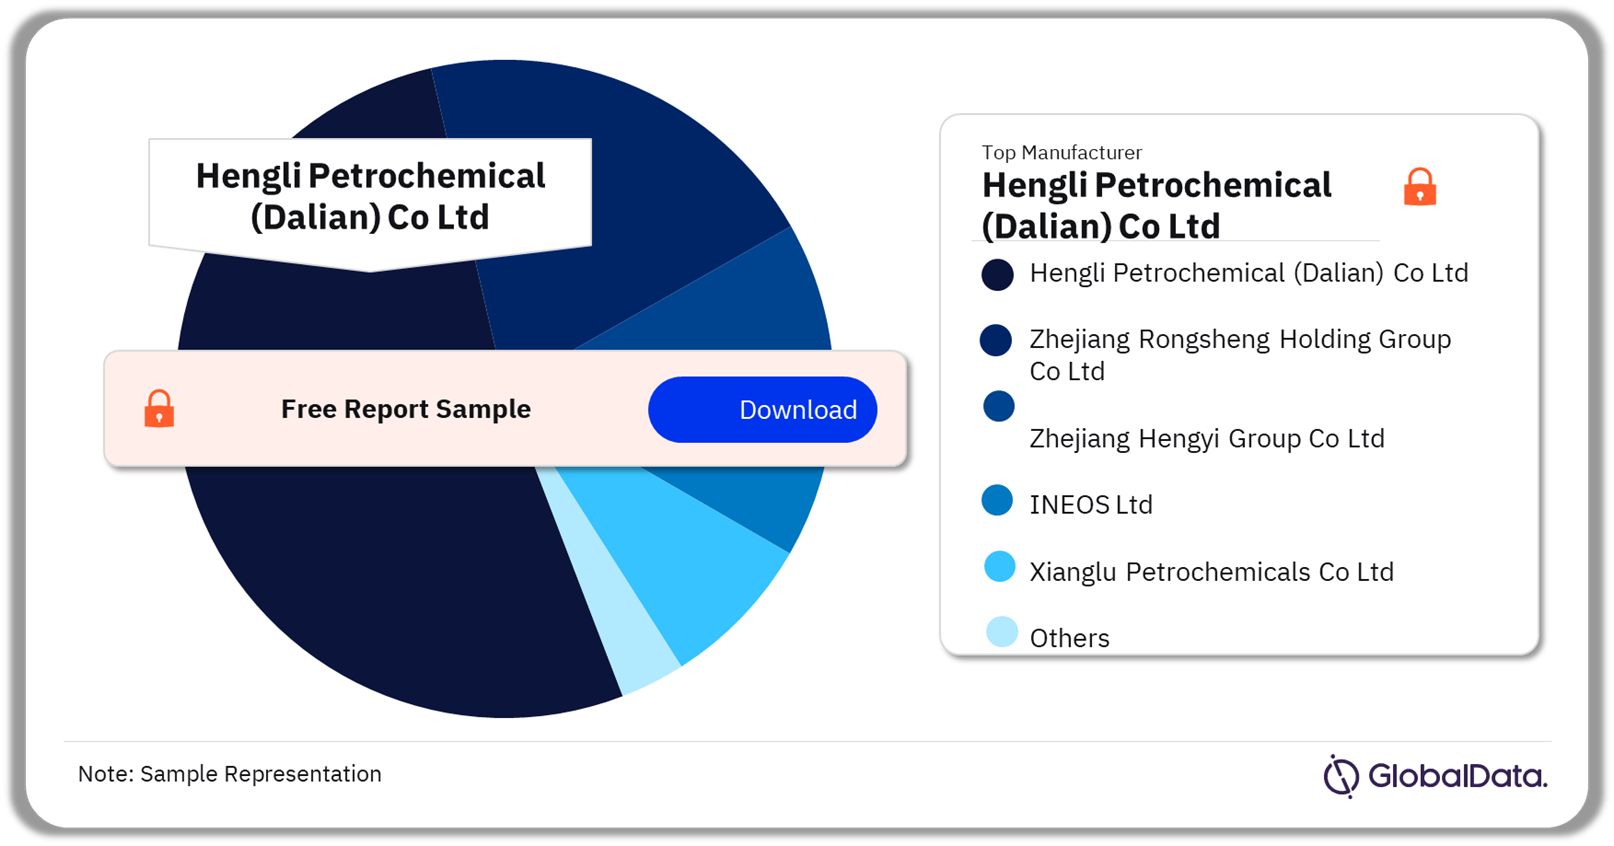
The leading Purified Terephthalic Acid producers are:

  • Hengli Petrochemical (Dalian) Co Ltd
  • Zhejiang Rongsheng Holding Group Co Ltd
  • Zhejiang Hengyi Group Co Ltd
  • INEOS Ltd
  • Xianglu Petrochemicals Co Ltd

Hengli Petrochemical (Dalian) Co Ltd had the largest active purified terephthalic acid (PTA) capacity globally in 2023. The major capacity contribution was from “Hengli Petrochemical Dalian Purified Terephthalic Acid (PTA) Plant”.

Leading Companies by Purified Terephthalic Acid (PTA) Capacity Contribution, 2023 (%)

Leading Companies by Purified Terephthalic Acid (PTA) Capacity Contribution, 2023 (%)

Buy the Full Report for More Insights on the Leading Purified Terephthalic Acid Producers
Download a Free Report Sample

Key Segments Covered in the Report

Purified Terephthalic Acid (PTA) Capacity Contribution Regional Outlook (Capacity, mtpa, 2018-2028)

  • Asia
  • Middle East
  • Former Soviet Union (FSU)

Scope

The report provides information about:

  • The global Purified Terephthalic Acid (PTA) capacity outlook by region
  • The global Purified Terephthalic Acid (PTA) outlook by country
  • The Purified Terephthalic Acid (PTA) planned and announced project details
  • The capacity share of the major Purified Terephthalic Acid (PTA) producers globally
  • The global Purified Terephthalic Acid (PTA) capital expenditure outlook by region
  • The global Purified Terephthalic Acid (PTA) capital expenditure outlook by country

Reasons to Buy

  • Obtain the most up-to-date information available on all active, planned, and announced Purified Terephthalic Acid plants globally.
  • Identify opportunities in the global Purified Terephthalic Acid (PTA) with the help of upcoming projects and capital expenditure outlook.
  • Facilitate decision-making based on strong historical and forecast Purified Terephthalic Acid capacity data.

Hengli Petrochemical (Dalian) Co Ltd
Zhejiang Rongsheng Holding Group Co Ltd
Zhejiang Hengyi Group Co Ltd
INEOS Ltd
Xianglu Petrochemicals Co Ltd
Reliance Industries Ltd
Xin Feng Ming Group Co Ltd
China Petrochemical Corp

Table of Contents

01. Global PTA Capacity and Capital Expenditure Outlook

• Key Highlights

02. Global PTA Capacity and Capital Expenditure Outlook by Region

• Global PTA Capacity Contribution by Region

• Global Planned and Announced Capacity Additions by Region

• Global Capex Spending on Planned and Announced Projects by Region

• Global PTA Industry, Installed Plant Capacity by Production Process, 2023

• Global PTA Industry, Installed Plant Capacity by Technology, 2023

03. Global PTA Capacity and Capital Expenditure Outlook by Country

• Global PTA Capacity Contributions by Key Countries, 2018-2028

• Key Countries by PTA Capacity Contribution (% share), 2023

• Global Capacity Additions from Planned and Announced Projects by Country

• Global Capex Spending on Planned and Announced Projects by Country

04. Global PTA Capacity and Capital Expenditure Outlook by Company

• Global PTA Capacity Contribution (% Share) by Key Companies, 2023

• Global Capacity Additions from Planned and Announced Projects by Top 10 Companies

05. Global PTA Industry- Upcoming Projects

• Global PTA Industry, Top 10 Planned and Announced Projects

06. Asia PTA Industry, Capacity and Capex Outlook

• Asia PTA Industry, Capacity by Key Countries, 2018-2028

• Asia PTA Industry, Annual New Build and Expansion Capital Expenditure Outlook for planned and announced projects

• Asia PTA Industry, Annual New Build and Expansion Capital Expenditure Outlook for Planned and Announced Projects by Country

07. Europe PTA Industry, Capacity and Capex Outlook

• Europe PTA Industry, Capacity by Country, 2018-2028

08. FSU PTA Industry, Capacity and Capex Outlook

• FSU PTA Industry, Capacity by Country, 2018-2028

• FSU PTA Industry, Annual New Build and Expansion Capital Expenditure Outlook for planned and announced projects

• FSU PTA Industry, Annual New Build and Expansion Capital Expenditure Outlook for Planned and Announced Projects by Country

09. North America PTA Industry, Capacity and Capex Outlook

• North America PTA Industry, Capacity by Country, 2018-2028

10. South America PTA Industry, Capacity and Capex Outlook

• South America PTA Industry, Capacity by Country, 2018-2028

11. Appendix

• Important Definitions

Table

Table 1: PTA Industry, Global, key statistics, 2022 9

Table 2: PTA Industry, Global, Capacity by Key Countries (mtpa), 2017–2027 10

Table 3: PTA Industry, Global, Top 10 Planned and Announced Projects Details, 2023–2027 12

Table 4: PTA Industry, Global, capacity by region (mtpa), 2022–2027 14

Table 5: PTA Industry, global, capacity share of top 10 Companies (%), 2022 16

Table 6: PTA Industry, global, active Capacity of Top 10 Countries (mtpa), 2022 18

Table 7: Global, PTA Industry, Installed Plant Capacity by Production Process (%) 2022 20

Table 8: Global, PTA Industry, Installed Plant Capacity by Para-Xylene Oxidation, 2022 20

Table 9: Polyethylene Terephthalate (PET) Industry, global, planned and announced capacity additions by region (mtpa), 2027 26

Table 10: PTA Industry, global, planned and announced capacity additions by top 10 countries (mtpa), 2027 28

Table 11: PTA Industry, global, planned and announced capacity additions by Top 10 Companies (mtpa), 2027 30

Table 12: PTA Industry, Global, Total Capex Spending on Planned and Announced Projects by Region ($ bil), 2023–2027 31

Table 13: PTA Industry, Global, Total Capex Spending on Planned and Announced Projects by Countries ($ bil), 2023–2027 32

Table 14: Global, planned and announced PTA projects details 33

Table 15: PTA Industry, Asia, key statistics, 2022 39

Table 16: PTA Industry, Asia, Capacity by Key Countries (mtpa), 2017–2027 40

Table 17: Asia, PTA Industry, Installed Plant Capacity by Production Process (%) 2022 43

Table 18: Asia, PTA Industry, Installed Plant Capacity by Para-Xylene Oxidation, 2022 43

Table 19: PTA Industry, Asia, New Build and Expansion Capital Expenditure Outlook for Planned and Announced Projects ($B), 2023–2027 48

Table 20: PTA Industry, Asia, New Build and Expansion Capital Expenditure Outlook for Planned and Announced Projects by Countries ($B), 2023–2027 49

Table 21: PTA Industry, China, Capacity by Major Plants (mtpa) 2017–2027 50

Table 22: PTA Industry, Taiwan, Capacity by Major Plants (mtpa) 2017–2027 60

Table 23: PTA Industry, India, Capacity by Major Plants (mtpa) 2017–2027 63

Table 24: PTA Industry, South Korea, Capacity by Major Plants (mtpa) 2017–2027 65

Table 25: PTA Industry, Thailand, Capacity by Major Plants (mtpa) 2017–2027 67

Table 26: PTA Industry, Indonesia, Capacity by Major Plants (mtpa) 2017–2027 68

Table 27: PTA Industry, Japan, Capacity by Major Plants (mtpa) 2017–2027 70

Table 28: PTA Industry, Malaysia, Capacity by Major Plants (mtpa) 2017–2027 71

Table 29: PTA Industry, Pakistan, Capacity by Major Plants (mtpa) 2017–2027 72

Table 30: PTA Industry, Brunei, Capacity by Major Plants (mtpa) 2017–2027 73

Table 31: PTA Industry, North America, key statistics, 2022 74

Table 32: PTA Industry, North America, Capacity by Key Countries (mtpa), 2017–2027 75

Table 33: North America, PTA Industry, Installed Plant Capacity by Technology (%) 2022 79

Table 34: North America, PTA Industry, Installed Plant Capacity by INEOS PTA Technology, 2022 79

Table 35: North America, PTA Industry, Installed Plant Capacity by Grupo Petrotemex PTA Technology, 2022 79

Table 36: North America, PTA Industry, Installed Plant Capacity by Alpek PTA Technology, 2022 79

Table 37: North America, PTA Industry, Installed Plant Capacity by CEPSA PTA Technology, 2022 80

Table 38: PTA Industry, North America, New Build and Expansion Capital Expenditure Outlook for Planned and Announced Projects ($B), 2023–2027 81

Table 39: PTA Industry, North America, New Build and Expansion Capital Expenditure Outlook for Planned and Announced Projects by Countries ($B), 2023–2027 82

Table 40: PTA Industry, US, Capacity by Major Plants (mtpa) 2017–2027 83

Table 41: PTA Industry, Mexico, Capacity by Major Plants (mtpa) 2017–2027 84

Table 42: PTA Industry, Canada, Capacity by Major Plants (mtpa) 2017–2027 85

Table 43: PTA Industry, Europe, key statistics, 2022 86

Table 44: PTA Industry, Europe, Capacity by Key Countries (mtpa), 2017–2027 87

Table 46: Europe, PTA Industry, Installed Plant Capacity by Technology (%) 2022 91

Table 47: Europe, PTA Industry, Installed Plant Capacity by INEOS PTA Technology, 2022 91

Table 48: Europe, PTA Industry, Installed Plant Capacity by Invista PTA Technology, 2022 91

Table 49: Europe, PTA Industry, Installed Plant Capacity by GPT PTA Technology, 2022 91

Table 50: Europe, PTA Industry, Installed Plant Capacity by Mitsubishi Chemical PTA Technology, 2022 92

Table 51: Europe, PTA Industry, Installed Plant Capacity by BP PTA Technology, 2022 92

Table 45: PTA Industry, Belgium, Capacity by Major Plants (mtpa) 2017–2027 93

Table 52: PTA Industry, Portugal, Capacity by Major Plants (mtpa) 2017–2027 94

Table 53: PTA Industry, Netherlands, Capacity by Major Plants (mtpa) 2017–2027 95

Table 54: PTA Industry, Poland, Capacity by Major Plants (mtpa) 2017–2027 96

Table 55: PTA Industry, Spain, Capacity by Major Plants (mtpa) 2017–2027 97

Table 56: PTA Industry, Germany, Capacity by Major Plants (mtpa) 2017–2027 98

Table 57: PTA Industry, Middle East, key statistics, 2022 99

Table 58: PTA Industry, Middle East, Capacity by Key Countries (mtpa), 2017–2027 100

Table 59: Middle East, PTA Industry, Installed Plant Capacity by Technology (%) 2022 104

Table 60: Middle East, PTA Industry, Installed Plant Capacity by INEOS PTA Technology, 2022 104

Table 61: Middle East, PTA Industry, Installed Plant Capacity by Tecnimont PTA Technology, 2022 104

Table 62: Middle East, PTA Industry, Installed Plant Capacity by Mitsubishi PTA Technology, 2022 104

Table 63: PTA Industry, Middle East, New Build and Expansion Capital Expenditure Outlook for Planned and Announced Projects ($B), 2023–2027 105

Table 64: PTA Industry, Middle East, New Build and Expansion Capital Expenditure Outlook for Planned and Announced Projects by Countries ($B), 2023–2027 106

Table 65: PTA Industry, Iran, Capacity by Major Plants (mtpa) 2017–2027 107

Table 66: PTA Industry, Saudi Arabia, Capacity by Major Plants (mtpa) 2017–2027 108

Table 67: PTA Industry, Turkey, Capacity by Major Plants (mtpa) 2017–2027 109

Table 68: PTA Industry, South America, key statistics, 2022 110

Table 69: PTA Industry, South America, Capacity by Key Countries (mtpa), 2017–2027 111

Table 70: PTA Industry, Brazil, Capacity by Major Plants (mtpa) 2017–2027 115

Table 71: PTA Industry, FSU, key statistics, 2022 116

Table 72: PTA Industry, FSU, Capacity by Key Countries (mtpa), 2017–2027 117

Table 73: PTA Industry, FSU, New Build and Expansion Capital Expenditure Outlook for Planned and Announced Projects ($B), 2023–2027 121

Table 74: PTA Industry, FSU, New Build and Expansion Capital Expenditure Outlook for Planned and Announced Projects by Countries ($B), 2023–2027 122

Table 75: PTA Industry, Russia, Capacity by Major Plants (mtpa) 2017–2027 123

Table 76: PTA Industry, Kazakhstan, Capacity by Major Plants (mtpa) 2017–2027 124

Figures

Figure 1: Global PTA Industry, Capacity Share vis-à-vis Growth by Key Countries, 2017–2022 11

Figure 2: PTA Industry, global, capacity by region (mtpa), 2022–2027 14

Figure 3: PTA Industry, global, capacity share of top 10 companies (%), 2022 15

Figure 4: PTA Industry, global, active capacity of top 10 countries (mtpa), 2022 17

Figure 5: Global, PTA Industry, Installed Plant Capacity by Production Process (%) 2022 19

Figure 6: PTA Industry, global, planned and announced capacity additions by region (mtpa), 2027 26

Figure 7: PTA Industry, global, planned and announced Capacity Additions by Top 10 countries (mtpa), 2027 27

Figure 8: PTA Industry, global, planned and announced Capacity Additions by Top 10 companies (mtpa), 2027 29

Figure 9: PTA Industry, Total Capex Spending on Planned and Announced Projects by Region ($ bil), 2023–2027 31

Figure 10: PTA Industry, Total Capex Spending on Planned and Announced Projects by Countries ($ bil), 2023–2027 32

Figure 11: PTA Industry, Asia, Capacity Share vis-à-vis Growth by Key Countries, 2017–2022 41

Figure 12: Asia, PTA Industry, Installed Plant Capacity by Production Process (%) 2022 42

Figure 13: PTA Industry, Asia, New Build and Expansion Capital Expenditure Outlook for Planned and Announced Projects ($B), 2023–2027 48

Figure 14: PTA Industry, Asia, New Build and Expansion Capital Expenditure Outlook for Planned and Announced Projects by Countries ($B), 2023–2027 49

Figure 15: PTA Industry, North America, Capacity Share vis-à-vis Growth by Key Countries, 2017–2022 76

Figure 16: North America, PTA Industry, Installed Plant Capacity by Technology (%) 2022 78

Figure 17: PTA Industry, North America, New Build and Expansion Capital Expenditure Outlook for Planned and Announced Projects ($B), 2023–2027 81

Figure 18: PTA Industry, North America, New Build and Expansion Capital Expenditure Outlook for Planned and Announced Projects by Countries ($B), 2023–2027 82

Figure 19: PTA Industry, Europe, Capacity Share vis-à-vis Growth by Key Countries, 2017–2022 88

Figure 20: Europe, PTA Industry, Installed Plant Capacity by Technology (%) 2022 90

Figure 21: PTA Industry, Middle East, Capacity Share vis-à-vis Growth by Key Countries, 2017–2022 101

Figure 22: Middle East, PTA Industry, Installed Plant Capacity by Technology (%) 2022 103

Figure 23:PTA Industry, Middle East, New Build and Expansion Capital Expenditure Outlook for Planned and Announced Projects ($B), 2023–2027 105

Figure 24: PTA Industry, Middle East, New Build and Expansion Capital Expenditure Outlook for Planned and Announced Projects by Countries ($B), 2023–2027 106

Figure 25: PTA Industry, South America, Capacity Share vis-à-vis Growth by Key Countries, 2017–2022 112

Figure 26: PTA Industry, FSU, Capacity Share vis-à-vis Growth by Key Countries, 2017–2022 118

Figure 27:PTA Industry, FSU, New Build and Expansion Capital Expenditure Outlook for Planned and Announced Projects ($B), 2023–2027 121

Figure 28: PTA Industry, FSU, New Build and Expansion Capital Expenditure Outlook for Planned and Announced Projects by Countries ($B), 2023–2027 122

Frequently asked questions

Purified Terephthalic Acid (PTA) Industry Capacity and Capital Expenditure Forecasts with Details of All Active and Planned Plants to 2028 standard reports
Currency USD
$3,995

Can be used by individual purchaser only

$11,985

Can be shared globally by unlimited users within the purchasing corporation e.g. all employees of a single company


Undecided about purchasing this report?

Enquire Before Buying Request a Free Sample

Get in touch to find out about multi-purchase discounts

reportstore@globaldata.com
Tel +44 20 7947 2745

Every customer’s requirement is unique. With over 220,000 construction projects tracked, we can create a tailored dataset for you based on the types of projects you are looking for. Please get in touch with your specific requirements and we can send you a quote.

Sample Report

Purified Terephthalic Acid (PTA) Industry Capacity and Capital Expenditure Forecasts with Details of All Active and Planned Plants to 2028 was curated by the best experts in the industry and we are confident about its unique quality. However, we want you to make the most beneficial decision for your business, so we offer free sample pages to help you:

  • Assess the relevance of the report
  • Evaluate the quality of the report
  • Justify the cost

Download your copy of the sample report and make an informed decision about whether the full report will provide you with the insights and information you need.

Below is a sample report to understand what you are buying

See what our customers are saying

“The GlobalData platform is our go-to tool for intelligence services. GlobalData provides an easy way to access comprehensive intelligence data around multiple sectors, which essentially makes it a one-for-all intelligence platform, for tendering and approaching customers.

GlobalData is very customer orientated, with a high degree of personalised services, which benefits everyday use. The highly detailed project intelligence and forecast reports can be utilised across multiple departments and workflow scopes, from operational to strategic level, and often support strategic decisions. GlobalData Analytics and visualisation solutions has contributed positively when preparing management presentations and strategic papers.”

Business Intelligence & Marketing Manager, SAL Heavy Lift

“COVID-19 has caused significant interference to our business and the COVID-19 intelligence from GlobalData has helped us reach better decisions around strategy. These two highlights have helped enormously to understand the projections into the future concerning our business units, we also utilise the project database to source new projects for Liebherr-Werk to use as an additional source to pitch for new business.”

Market Analyst & Management, Liebherr-Werk

Your daily news has saved me a lot of time and keeps me up-to-date with what is happening in the market, I like that you almost always have a link to the source origin. We also use your market data in our Strategic Business Process to support our business decisions. By having everything in one place on the Intelligence Center it has saved me a lot of time versus looking on different sources, the alert function also helps with this.

Head of Key Accounts, Saab AB

Having used several other market research companies, I find that GlobalData manages to provide that ‘difficult-to-get’ market data that others can’t, as well as very diverse and complete consumer surveys.

Marketing Intelligence Manager, Portugal Foods

Our experience with GlobalData has been very good, from the platform itself to the people. I find that the analysts and the account team have a high level of customer focus and responsiveness and therefore I can always rely on. The platform is more holistic than other providers. It is convenient and almost like a one stop shop. The pricing suite is highly competitive and value for our organisation.

I like reports that inform new segments such as the analysis on generation Z, millennials, the impact of COVID 19 to our banking customers and their new channel habits. Secondly the specialist insight on affluent sector significantly increases our understanding about this group of customers. The combination of those give us depth and breadth of the evolving market.

I’m in the business of answering and helping people make decisions so with the intelligence center I can do that, effectively and efficiently. I can share quickly key insights that answer and satisfy our country stakeholders by giving them many quality studies and primary research about competitive landscape beyond the outlook of our bank. It helps me be seen as an advisory partner and that makes a big difference. A big benefit of our subscription is that no one holds the whole data and because it allows so many people, so many different parts of our organisation have access, it enables all teams to have the same level of knowledge and decision support.

Head of Customer Insight and Research, Standard Chartered

“I know that I can always rely on Globaldata’s work when I’m searching for the right consumer and market insights. I use Globaldata insights to understand the changing market & consumer landscape and help create better taste & wellbeing solutions for our customers in food, beverage and healthcare industries.

Globaldata has the right data and the reports are of very high quality compared to your competitors. Globaldata not only has overall market sizes & consumer insights on food & beverages but also provides insights at the ingredient & flavour level. That is key for B2B companies like Givaudan. This way we understand our customers’ business and also gain insight to our unique industry”

Head of Consumer Sensory Insights, Givaudan

GlobalData provides a great range of information and reports on various sectors that is highly relevant, timely, easy to access and utilise.  The reports and data dashboards help engagement with clients; they provide valuable industry and market insights that can enrich client conversations and can help in the shaping of value propositions. Moreover, using GlobalData products has helped increase my knowledge of the finance sector, the players within it, and the general threats and opportunities.

I find the consumer surveys that are carried out to be extremely beneficial and not something I have seen anywhere else. They provided an insightful view of why and which consumers take (or don’t) particular financial products. This can help shape conversations with clients to ensure they make the right strategic decisions for their business.

One of the challenges I have found is that data in the payments space is often piecemeal. With GD all of the data I need is in one place, but it also comes with additional market reports that provide useful extra context and information. Having the ability to set-up alerts on relevant movements in the industry, be it competitors or customers, and have them emailed directly to me, ensures I get early sight of industry activity and don’t have to search for news.

Senior Account Manager, TSYS
Go even deeper with GlobalData Intelligence Center

Every Company Report we produce is powered by the GlobalData Intelligence Center.

Subscribing to our intelligence platform means you can monitor developments at Purified Terephthalic Acid (PTA) Industry Capacity and Capital Expenditure Forecasts with Details of All Active and Planned Plants to 2028 in real time.

  • Access a live Purified Terephthalic Acid (PTA) Industry Capacity and Capital Expenditure Forecasts with Details of All Active and Planned Plants to 2028 dashboard for 12 months, with up-to-the-minute insights.
  • Fuel your decision making with real-time deal coverage and media activity.
  • Turn insights on financials, deals, products and pipelines into powerful agents of commercial advantage.