Qatar Dairy and Soy Food Market Assessment by Categories, Distribution, Packaging, Demographics and Forecasts to 2027
Powered by ![]()
All the vital news, analysis, and commentary curated by our industry experts.

Qatar Dairy and Soy Food Market Overview
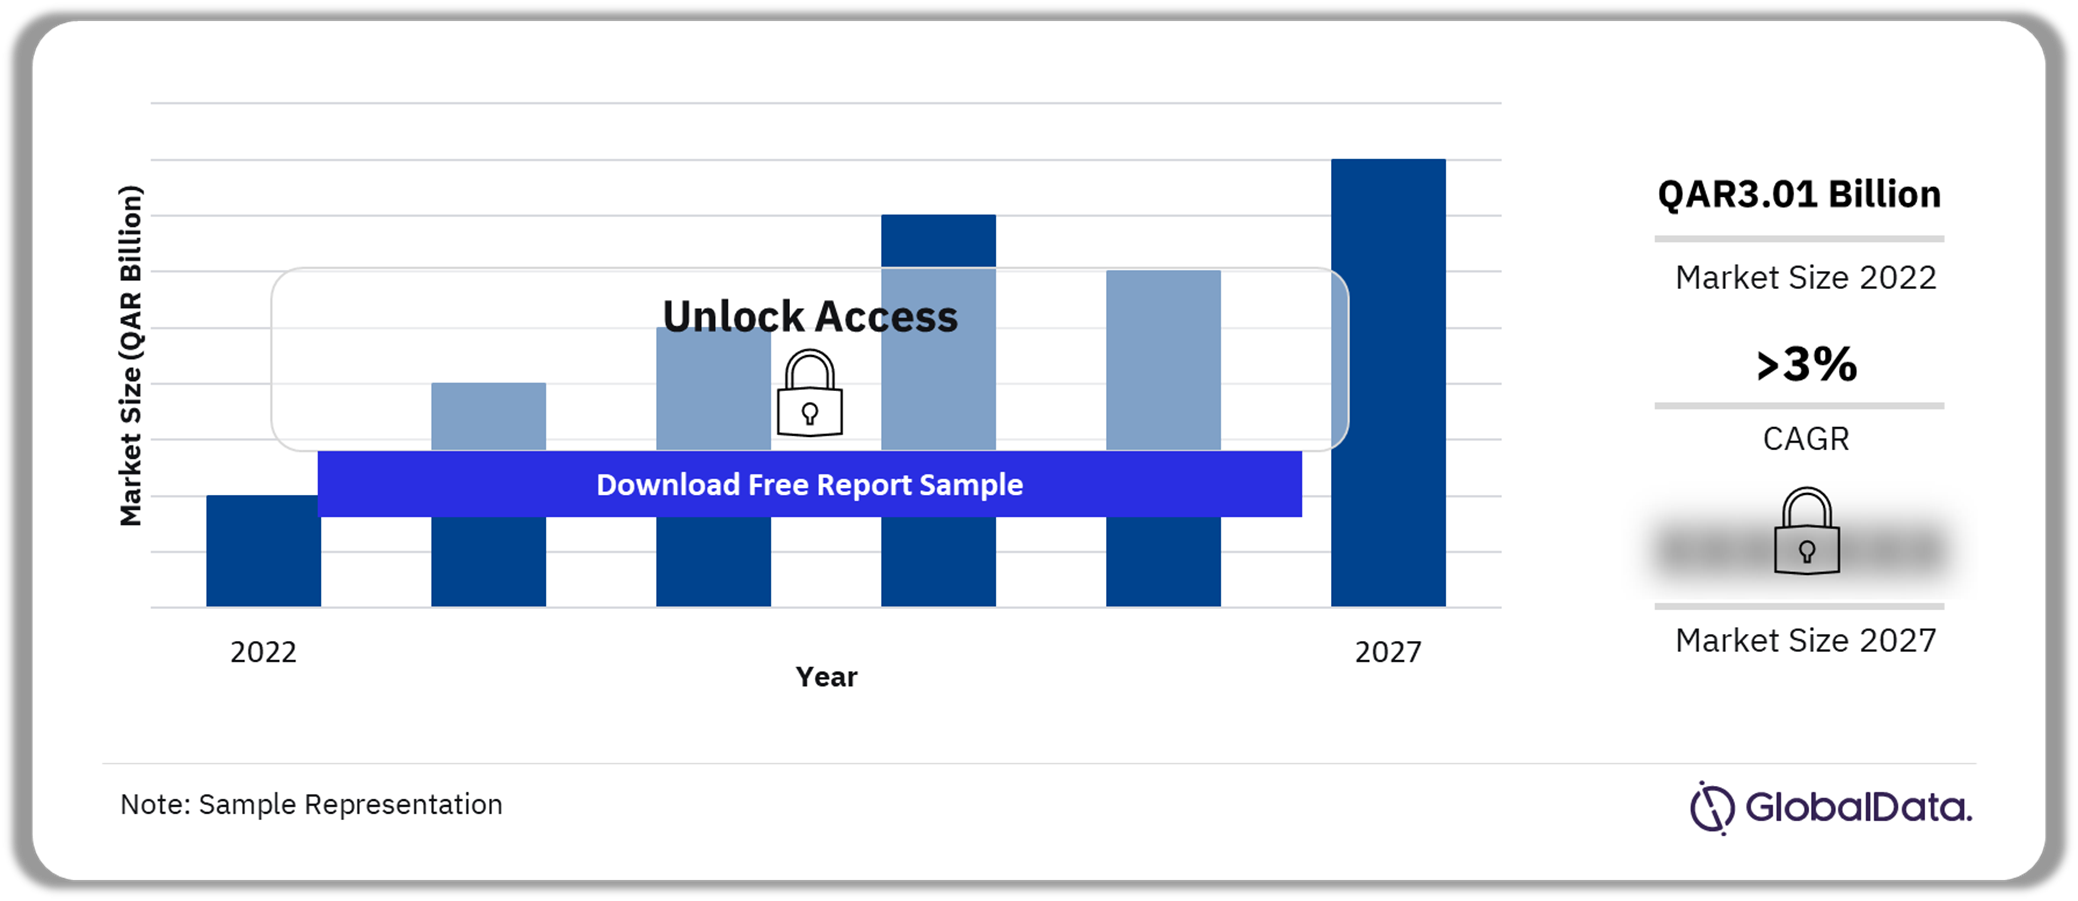
The Qatar dairy and soy food market size was valued at QAR3.01 billion ($825.6 million) in 2022 and is expected to grow at a CAGR of more than 3% during 2022-2027. The cheese was the largest category in 2022. However, the soymilk and soy drinks category is forecast to register the fastest value growth in the coming years.
Qatar Dairy and Soy Food Market Overview, 2022-2027 (QAR Billion)
For more insights on Qatar dairy & soy food market forecast, download a free report sample
The Qatar dairy and soy food market research report provides a comprehensive overview of the Qatar dairy & soy food sector. It offers an overview of the growth at a sector level and analyzes the various categories and distribution channels.
| Market Size (2022) | QAR3.01 billion ($825.6 million) |
| CAGR (2022-2027) | >3% |
| Key Categories | · Butter & Spreadable Fats
· Cheese · Cream · Dairy-Based & Soy-Based Desserts · Drinkable Yogurt · Grain, Nut, Rice, Seed Milk Alternatives · Milk · Soymilk & Soy Drinks · Yogurt |
| Key Distribution Channel | · Hypermarkets & Supermarkets
· Convenience Stores · Food & Drinks Specialists · Cash & Carries & Warehouse Clubs |
| Leading Companies | · Baladna Food Industries
· Arla Foods Group · Bega Cheese Ltd. · Fonterra Co-operative Group Limited · FrieslandCampina |
| Enquire & Decide | Discover the perfect solution for your business needs. Enquire now and let us help you make an informed decision before making a purchase. |
Qatar Dairy and Soy Food Market Segmentation by Category
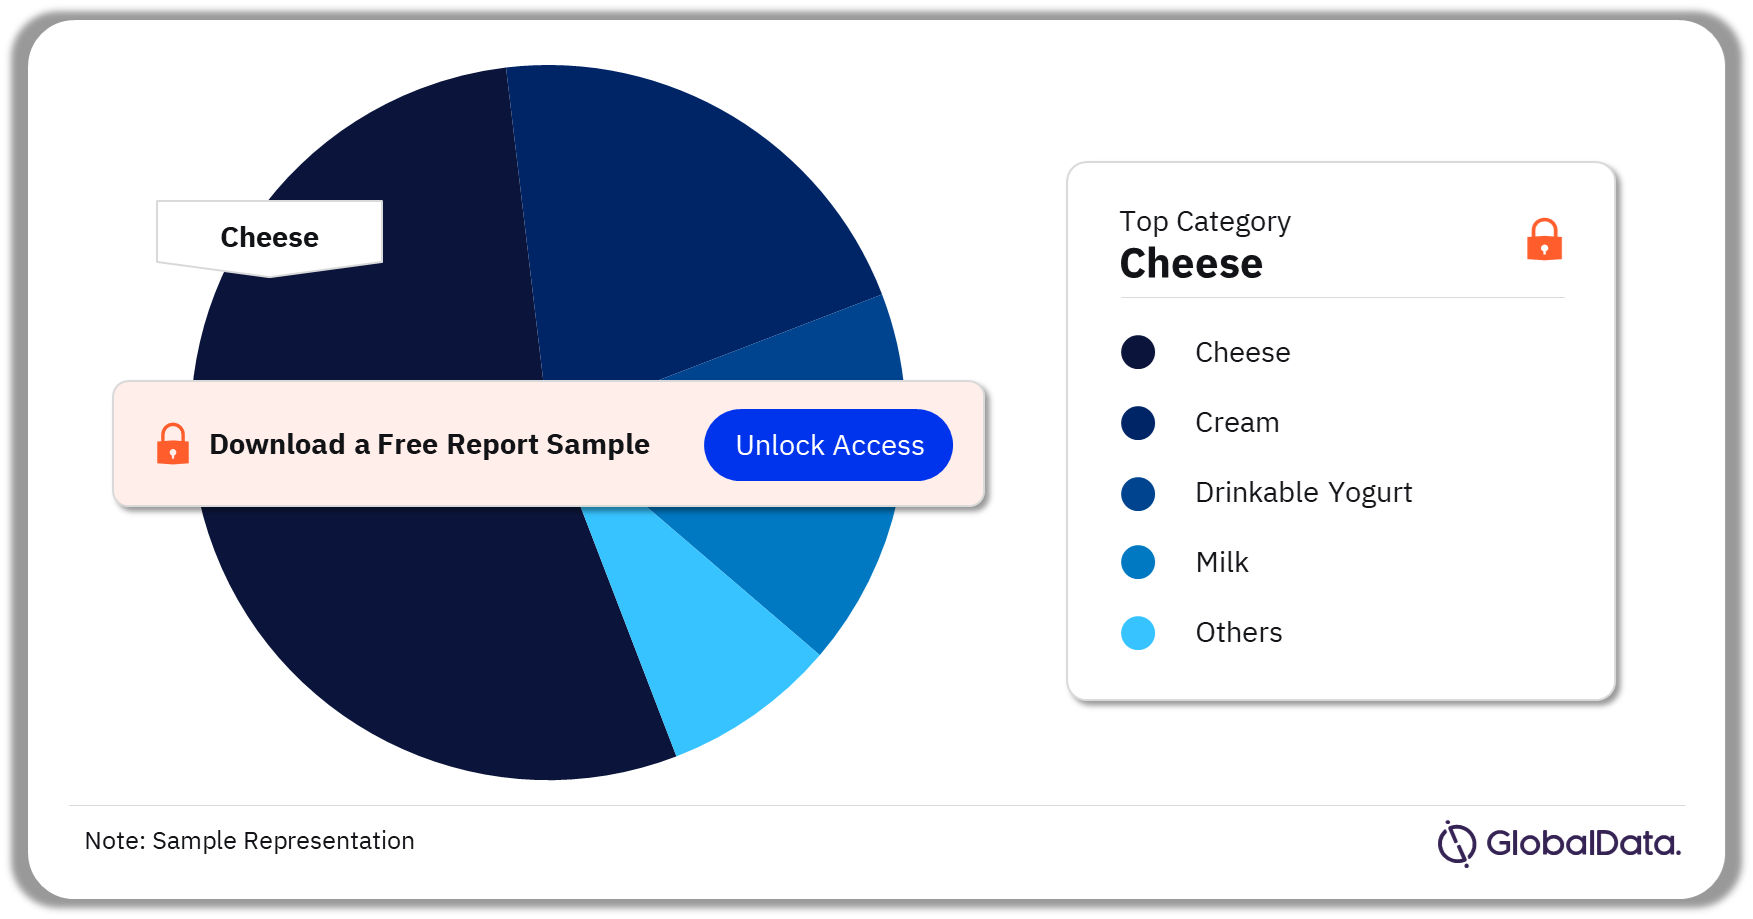
The key categories in the Qatar dairy and soy food market are butter & spreadable fats, cheese, cream, dairy-based & soy-based desserts, drinkable yogurt, grain, nut, rice, seed milk alternatives, milk, soymilk & soy drinks, and yogurt. In 2022, the cheese category accounted for the largest value share. However, the soymilk and soy drinks category is forecast to register the fastest value growth from 2022 to 2027.
Qatar Dairy and Soy Food Market Analysis, by Categories, 2022-2027 (%)
For more category insights on the Qatar dairy and soy food market, download a free report sample
Qatar Dairy and Soy Food Market Segmentation by Distribution Channel
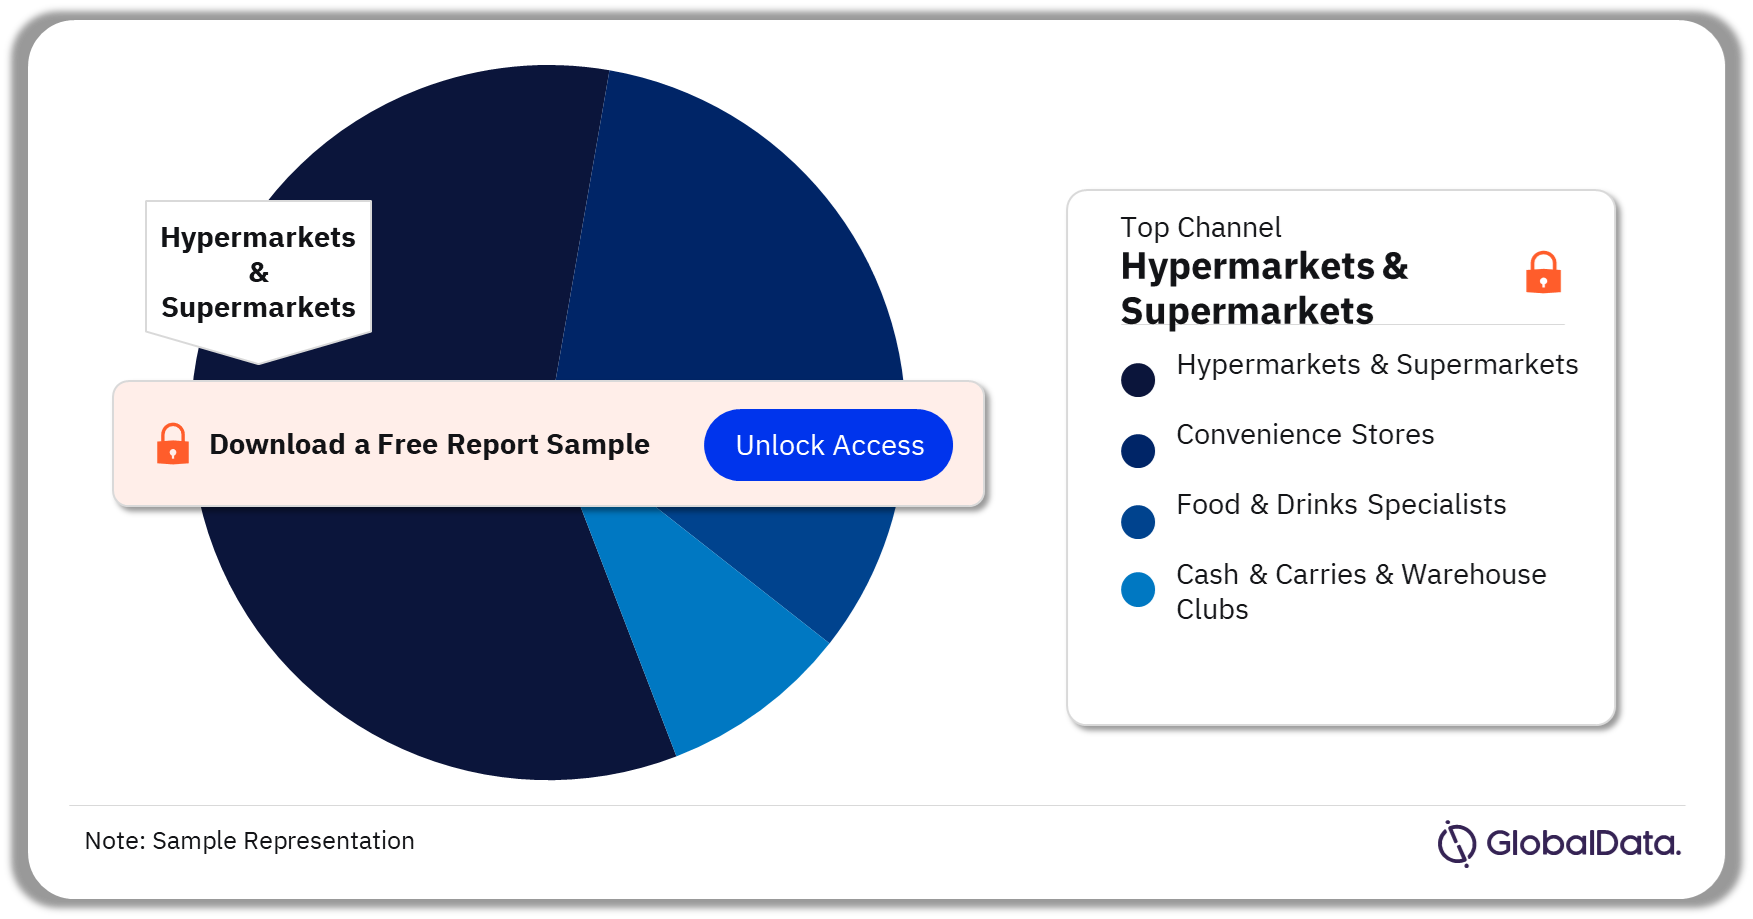
The key distribution channels in Qatar’s dairy and soy food market are hypermarkets & supermarkets, convenience stores, food & drinks specialists, and cash & carries & warehouse clubs. In 2022, hypermarkets & supermarkets was the leading distribution channel in the Qatar dairy & soy food sector, followed by convenience stores and food & drinks specialists.
Qatar Dairy and Soy Food Market Analysis, by Distribution Channel, 2022 (%)
For more distribution channel insights on the Qatar dairy and soy food market, download a free report sample
Qatar Dairy and Soy Food Market - Competitive Landscape
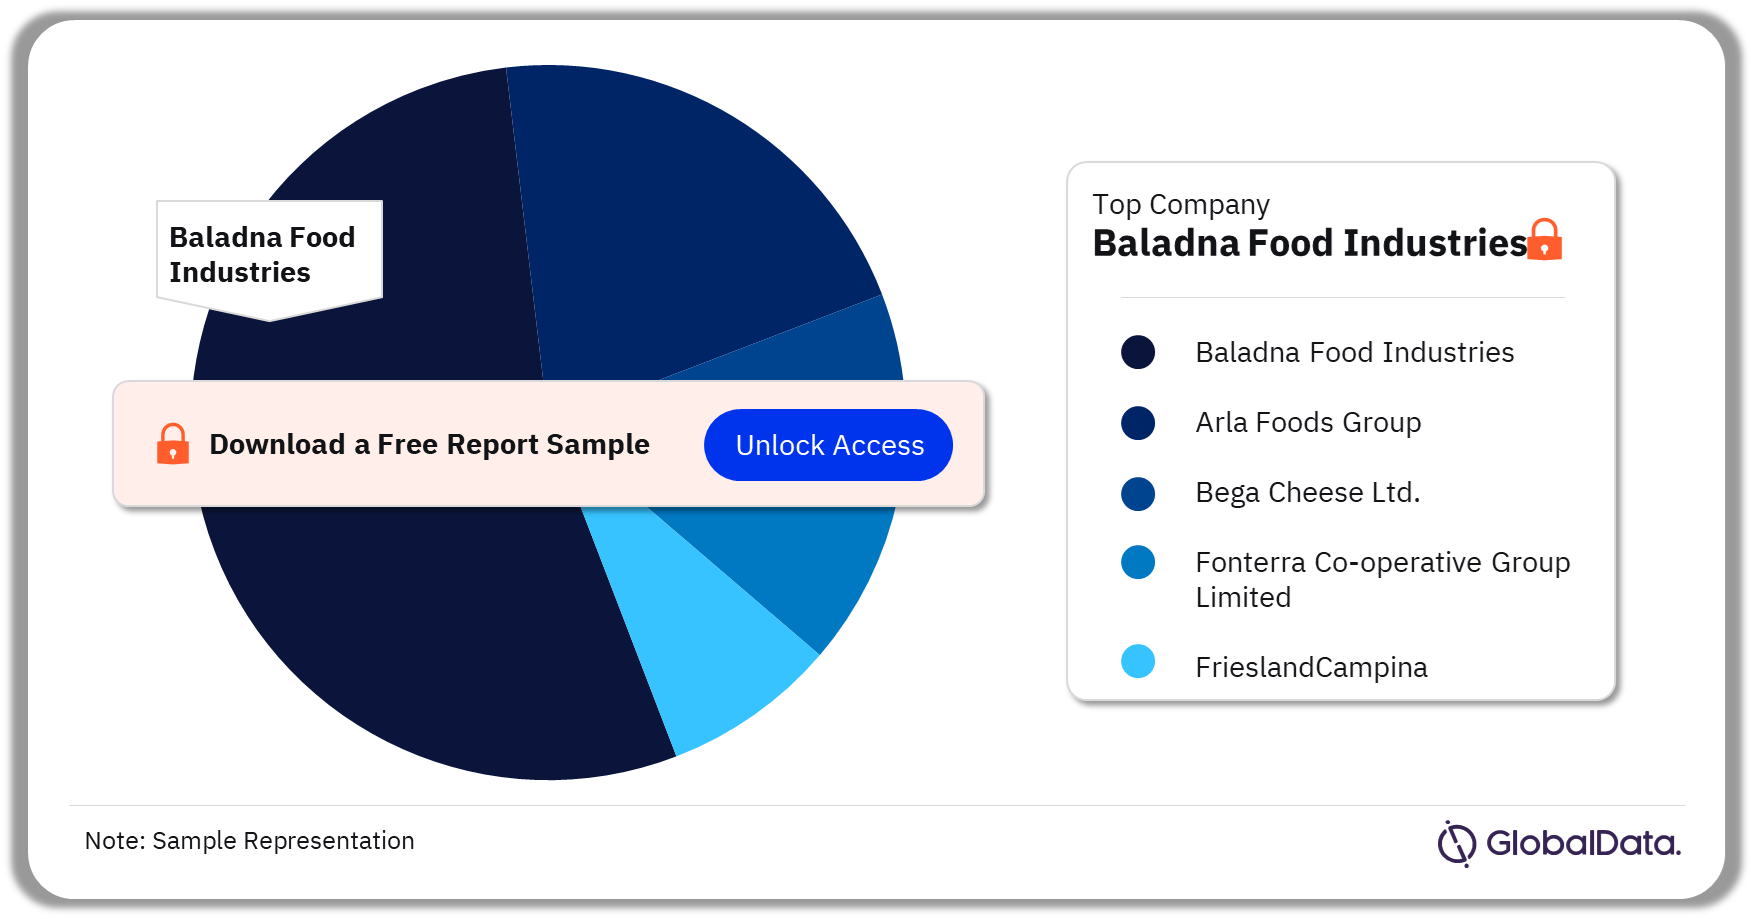
Some of the leading companies in the Qatar dairy and soy food market are Baladna Food Industries, Arla Foods Group, Bega Cheese Ltd., Fonterra Co-operative Group Limited, and FrieslandCampina. In 2022, Baladna Food Industries was the top company in the Qatar dairy & soy food sector.
Qatar Dairy and Soy Food Market Analysis, by Companies, 2022 (%)
To know more about leading dairy and soy food companies in Qatar, download a free report sample
Segments covered in the Report
Qatar Dairy and Soy Food Market Category Outlook (Value, QAR Billion, 2017-2027)
- Butter & Spreadable Fats
- Cheese
- Cream
- Dairy-Based & Soy-Based Desserts
- Drinkable Yogurt
- Grain, Nut, Rice, Seed Milk Alternatives
- Milk
- Soymilk & Soy Drinks
- Yogurt
Qatar Dairy and Soy Food Market Distribution Channel Outlook (Value, QAR Billion, 2017-2027)
- Hypermarkets & Supermarkets
- Convenience Stores
- Food & Drinks Specialists
- Cash & Carries & Warehouse Clubs
Scope
- Sector data: Overall sector value and volume data with growth analysis for 2016-2026
- Category coverage: Value and growth analysis for butter & spreadable fats, cheese, cream, dairy-based & soy-based desserts, drinkable yogurt, fromage frais & quark, grain, nut, rice, seed milk alternatives, milk, soymilk & soy drinks, yogurt with inputs on individual segment share within each category and the change in their market share forecast for 2021-2026
- Leading players: Market share of companies (in value terms) and private labels (in value terms) in 2021
- Distribution data: Percentage of sales within each category through distribution channels such as “dollar stores”, variety store & general merchandise retailers, cash & carries & warehouse clubs, convenience stores, department stores, drugstores & pharmacies, e-retailers, food & drinks specialists, hypermarkets & supermarkets, vending machines.
Reasons to Buy
- Identify high-potential categories and explore further market opportunities based on detailed value and volume analysis
- Existing and new players can analyze key distribution channels to identify and evaluate trends and opportunities
- Gain an understanding of the total competitive landscape based on detailed company share analysis to plan effective market positioning
- Our team of analysts has placed a significant emphasis on changes expected in the market that will provide a clear picture of the opportunities that can be tapped over the next five years, resulting in revenue expansion
- Analysis of key macroeconomic indicators such as real GDP, nominal GDP, consumer price index, household consumption expenditure, population (by age group, gender, rural-urban split, employed people, and unemployment rate. It also includes an economic summary of the country along with the labor market and demographic trends.
Bega Cheese Ltd
Arla Foods Group
Fonterra Co-operative Group Limited
SADITA Holding Group
FrieslandCampina
Danone Group
Balkan industrial Co
Table of Contents
Table
Figures
Frequently asked questions
-
What was the Qatar dairy and soy food market size in 2022?
The dairy and soy food market size in Qatar was valued at QAR3.01 billion ($825.6 million) in 2022.
-
What is the Qatar dairy and soy food market growth rate?
The dairy and soy food market in Qatar is expected to grow at a CAGR of more than 3% during 2022-2027.
-
Which is the leading category in the Qatar dairy and soy food market?
In 2022, the cheese category accounted for the largest value share.
-
Which is the leading distribution channel in the Qatar dairy and soy food market?
In 2022, hypermarkets & supermarkets was the leading distribution channel in the Qatar dairy & soy food sector.
-
Which are the leading companies operating in the Qatar dairy and soy food market?
Some of the leading companies in the Qatar dairy and soy food market are Baladna Food Industries, Arla Foods Group, Bega Cheese Ltd., Fonterra Co-operative Group Limited, and FrieslandCampina.
Get in touch to find out about multi-purchase discounts
reportstore@globaldata.com
Tel +44 20 7947 2745
Every customer’s requirement is unique. With over 220,000 construction projects tracked, we can create a tailored dataset for you based on the types of projects you are looking for. Please get in touch with your specific requirements and we can send you a quote.
Sample Report
Qatar Dairy and Soy Food Market Assessment by Categories, Distribution, Packaging, Demographics and Forecasts to 2027 was curated by the best experts in the industry and we are confident about its unique quality. However, we want you to make the most beneficial decision for your business, so we offer free sample pages to help you:
- Assess the relevance of the report
- Evaluate the quality of the report
- Justify the cost
Download your copy of the sample report and make an informed decision about whether the full report will provide you with the insights and information you need.


