Skincare Market Summary, Competitive Analysis and Forecast, 2017-2026

Powered by

All the vital news, analysis, and commentary curated by our industry experts.

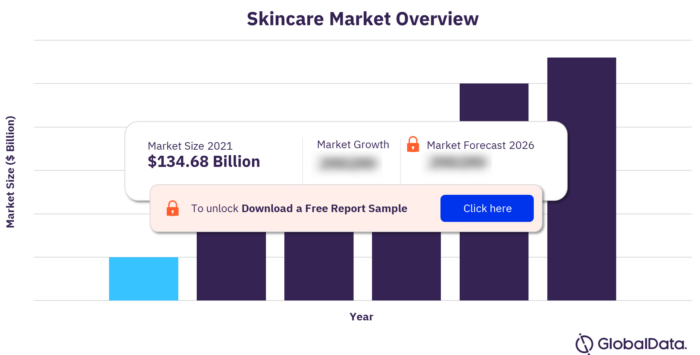
The global skincare market reached $134.68 billion in 2021. The market in focus grew by more than 4% in 2021. The global skincare market research report provides an overview of the current industry scenario regarding the future outlook in terms of ingredients, product claims, labeling, and packaging. The report also covers a regional overview of Asia-Pacific, Middle East & Africa, Americas, Western Europe, and Eastern Europe, highlighting industry size, growth drivers, latest developments, and future inhibitors for the regions.

Skincare Market Summary

For more insights, download a free report sample

Key Categories in the Global Skincare Market

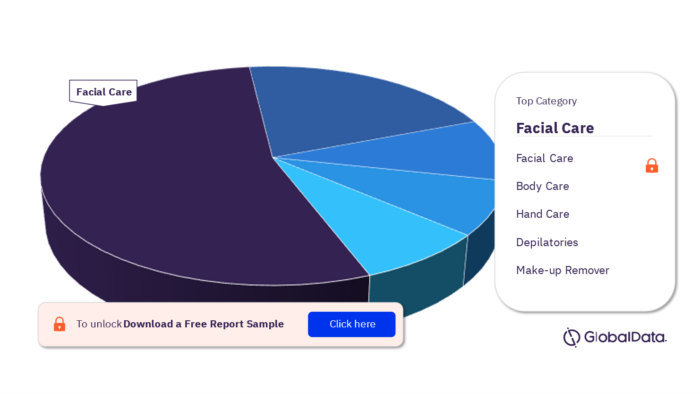
Facial care, body care, hand care, depilatories, and make-up remover are the key categories in the global skincare market. Facial care is the largest segment of the global skincare market, in terms of market’s total value.

Global Skincare Market, by Category

Global Skincare Market, by Category

For more category insights, download a free report sample

Key Geographic Segments in the Global skincare Market

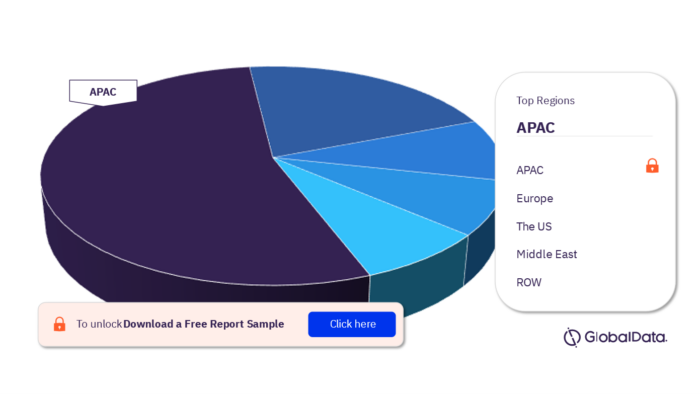
Asia-Pacific, Europe, United States, Middle East, and ROW (Rest of the World) are the key geography segments in the global skincare market. APAC has the largest market share in terms of value.

Global Skincare Market, by Geographic Segment Analysis

Global Skincare Market, by Geographic Segment Analysis

For regional insights, download a free report sample

Key Distribution Channel in the Global Skincare Market

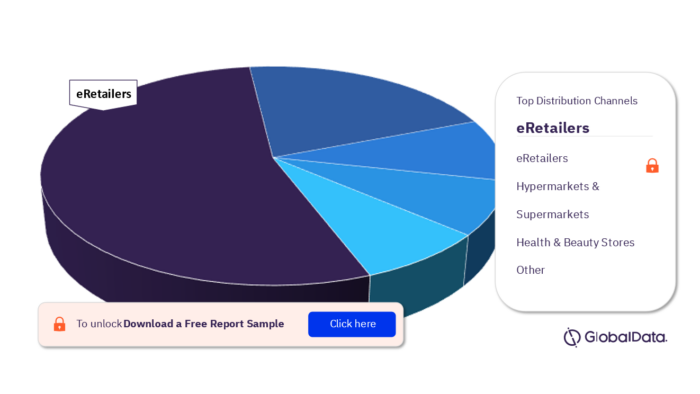
E-retailers, Hypermarkets & Supermarkets, Health & Beauty Stores Parapharmacies/Drugstores, and Other are the key distribution channels in the market in focus. Eretailers form the leading distribution channel in the global skincare market.

Global Skincare Market, by Distribution Channel

Global Skincare Market, by Distribution Channel

For more distribution channel insights, download a free report sample

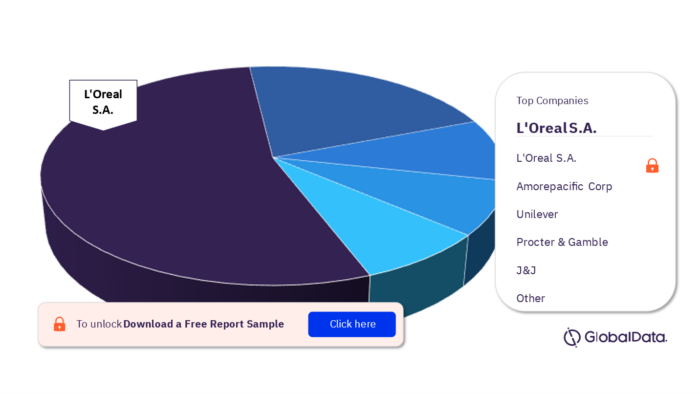
Key Companies in the Global Skincare Market

There are many companies in the global skin care market such as L’Oreal S.A., Amorepacific Corp, Laboratoires Pierre Fabre SA, Clarins USA Inc, Shiseido Company, Kao Corporation, KOSE Corp, POLA Orbis Holdings Inc, Natura & Co Holding SA, Mary Kay (China) Cosmetics Co Ltd, The Estee Lauder Companies Inc, Johnson & Johnson Pvt Ltd, Beiersdorf Ag, Unilever, and Procter & Gamble.

Unilever NV (Inactive)

Unilever NV (Unilever) is a producer and marketer of fast-moving consumer goods. Unilever is headquartered in Rotterdam, the Netherlands.

Johnson & Johnson Pvt Ltd

Johnson & Johnson Pvt Ltd (J&J), a subsidiary of Johnson & Johnson, manufactures and supplies consumer healthcare products, medical devices, and pharmaceuticals. J&J is headquartered in Mumbai, Maharashtra, India.

Natura & Co Holding SA

Natura & Co Holding SA (Natura & Co) is a manufacturer and supplier of personal care products. Natura & Co is headquartered in Sao Paulo, Brazil.

Grupo Boticario

Grupo Boticario (Boticario) is a retailer of beauty and personal care products. Boticario is headquartered in Curitiba, Parana, Brazil.

Shiseido Company, Limited

Shiseido Company, Limited (Shiseido or ‘the company’) is a manufacturer and marketer of cosmetics, personal care, and healthcare products. The company is headquartered in Chuo-ku, Tokyo, Japan.

Global Skincare Market, by Companies

Global Skincare Market, by Companies

For more insights on competitors, download a free report sample

Global Skincare Market Report Overview

Market Size 2021 $134.68 billion
Key Categories Facial Care, Body Care, Hand Care, Depilatories, and Make-Up Remover
Key Regions Asia-Pacific, Europe, United States, Middle East, and ROW (Rest of the World)
Key Companies L’Oreal S.A., Amorepacific Corp, Laboratoires Pierre Fabre SA, Clarins USA Inc, Shiseido Company, Kao Corporation, KOSE Corp, POLA Orbis Holdings Inc, Natura & Co Holding SA, Mary Kay (China) Cosmetics Co Ltd, The Estee Lauder Companies Inc, Johnson & Johnson Pvt Ltd, Beiersdorf Ag, Unilever, and Procter & Gamble
Key Distribution Channel eRetailers, Hypermarkets & Supermarkets, Health & Beauty Stores, Parapharmacies/Drugstores, and Other

Scope

  • Save time carrying out entry-level research by identifying the size, growth, and leading players in the skincare market
  • Use the five forces analysis to determine the competitive intensity and therefore attractiveness of the skincare market
  • Leading company profiles reveal details of key skincare market players’ operations and financial performance
  • Add weight to presentations and pitches by understanding the future growth prospects of the skincare markets with five-year forecasts by both value and volume

Reasons to Buy

  • The size of the skincare market by value in 2021
  • The size of the skincare market in 2026
  • Factors affecting the strength of competition in the emerging five skincare industries
  • The industry performance over the last five years
  • The top competitors in the skincare market

The Procter & Gamble Co
Amorepacific Corp
Beiersdorf AG
Laboratoires Pierre Fabre SA
Clarins USA Inc
Shiseido Company, Limited
Kao Corporation
KOSE Corp
POLA Orbis Holdings Inc
Natura & Co Holding SA
Mary Kay (China) Cosmetics Co Ltd
The Estee Lauder Companies Inc
L'Oreal SA
Johnson & Johnson Pvt Ltd
Unilever NV (Inactive)

Table of Contents

Table of Contents

1 EXECUTIVE SUMMARY

1.1. Market value

1.2. Market value forecast

1.3. Market volume

1.4. Market volume forecast

1.5. Category segmentation

1.6. Geography segmentation

1.7. Market share

1.8. Competitive Landscape

2 Introduction

2.1. What is this report about?

2.2. Who is the target reader?

2.3. How to use this report

2.4. Definitions

3 Global Skincare

3.1. Market Overview

3.2. Market Data

3.3. Market Segmentation

3.4. Market outlook

3.5. Five forces analysis

4 Macroeconomic Indicators

4.1. Country data

5 Skincare in Asia-Pacific

5.1. Market Overview

5.2. Market Data

5.3. Market Segmentation

5.4. Market outlook

5.5. Five forces analysis

6 Skincare in Europe

6.1. Market Overview

6.2. Market Data

6.3. Market Segmentation

6.4. Market outlook

6.5. Five forces analysis

7 Macroeconomic Indicators

7.1. Country data

8 Skincare in France

8.1. Market Overview

8.2. Market Data

8.3. Market Segmentation

8.4. Market outlook

8.5. Five forces analysis

9 Macroeconomic Indicators

9.1. Country data

10 Skincare in Germany

10.1. Market Overview

10.2. Market Data

10.3. Market Segmentation

10.4. Market outlook

10.5. Five forces analysis

11 Macroeconomic Indicators

11.1. Country data

12 Skincare in Italy

12.1. Market Overview

12.2. Market Data

12.3. Market Segmentation

12.4. Market outlook

12.5. Five forces analysis

13 Macroeconomic Indicators

13.1. Country data

14 Skincare in Japan

14.1. Market Overview

14.2. Market Data

14.3. Market Segmentation

14.4. Market outlook

14.5. Five forces analysis

15 Macroeconomic Indicators

15.1. Country data

16 Skincare in Australia

16.1. Market Overview

16.2. Market Data

16.3. Market Segmentation

16.4. Market outlook

16.5. Five forces analysis

17 Macroeconomic Indicators

17.1. Country data

18 Skincare in Canada

18.1. Market Overview

18.2. Market Data

18.3. Market Segmentation

18.4. Market outlook

18.5. Five forces analysis

19 Macroeconomic Indicators

19.1. Country data

20 Skincare in China

20.1. Market Overview

20.2. Market Data

20.3. Market Segmentation

20.4. Market outlook

20.5. Five forces analysis

21 Macroeconomic Indicators

21.1. Country data

22 Skincare in The Netherlands

22.1. Market Overview

22.2. Market Data

22.3. Market Segmentation

22.4. Market outlook

22.5. Five forces analysis

23 Macroeconomic Indicators

23.1. Country data

24 Skincare in Spain

24.1. Market Overview

24.2. Market Data

24.3. Market Segmentation

24.4. Market outlook

24.5. Five forces analysis

25 Macroeconomic Indicators

25.1. Country data

26 Skincare in The United Kingdom

26.1. Market Overview

26.2. Market Data

26.3. Market Segmentation

26.4. Market outlook

26.5. Five forces analysis

27 Macroeconomic Indicators

27.1. Country data

28 Skincare in The United States

28.1. Market Overview

28.2. Market Data

28.3. Market Segmentation

28.4. Market outlook

28.5. Five forces analysis

29 Macroeconomic Indicators

29.1. Country data

30 Company Profiles

30.1. The Procter & Gamble Co

30.2. Amorepacific Corp

30.3. Beiersdorf AG

30.4. Laboratoires Pierre Fabre SA

30.5. Clarins USA Inc

30.6. Shiseido Company, Limited

30.7. Kao Corporation

30.8. KOSE Corp

30.9. POLA Orbis Holdings Inc

30.10. Natura & Co Holding SA

30.11. Mary Kay (China) Cosmetics Co Ltd

30.12. The Estee Lauder Companies Inc

30.13. L’Oreal SA

30.14. Johnson & Johnson Pvt Ltd

30.15. Unilever NV (Inactive)

31 Appendix

31.1. Methodology

31.2. About GlobalData

Table

List of Tables

Table 1: Global skincare market value: $ million, 2017–21

Table 2: Global skincare market volume: million units, 2017–21

Table 3: Global skincare market category segmentation: $ million, 2021

Table 4: Global skincare market geography segmentation: $ million, 2021

Table 5: Global skincare market share: % share, by value, 2021

Table 6: Global skincare market distribution: % share, by value, 2021

Table 7: Global skincare market value forecast: $ million, 2021–26

Table 8: Global skincare market volume forecast: million units, 2021–26

Table 9: Global size of population (million), 2017–21

Table 10: Global gdp (constant 2005 prices, $ billion), 2017–21

Table 11: Global gdp (current prices, $ billion), 2017–21

Table 12: Global inflation, 2017–21

Table 13: Global consumer price index (absolute), 2017–21

Table 14: Global exchange rate, 2017–21

Table 15: Asia-Pacific skincare market value: $ million, 2017–21

Table 16: Asia–Pacific skincare market volume: million units, 2017–21

Table 17: Asia–Pacific skincare market category segmentation: $ million, 2021

Table 18: Asia–Pacific skincare market geography segmentation: $ million, 2021

Table 19: Asia-Pacific skincare market share: % share, by value, 2021

Table 20: Asia-Pacific skincare market distribution: % share, by value, 2021

Table 21: Asia-Pacific skincare market value forecast: $ million, 2021–26

Table 22: Asia–Pacific skincare market volume forecast: million units, 2021–26

Table 23: Europe skincare market value: $ million, 2017–21

Table 24: Europe skincare market volume: million units, 2017–21

Table 25: Europe skincare market category segmentation: $ million, 2021

Table 26: Europe skincare market geography segmentation: $ million, 2021

Table 27: Europe skincare market share: % share, by value, 2021

Table 28: Europe skincare market distribution: % share, by value, 2021

Table 29: Europe skincare market value forecast: $ million, 2021–26

Table 30: Europe skincare market volume forecast: million units, 2021–26

Table 31: Europe size of population (million), 2017–21

Table 32: Europe gdp (constant 2005 prices, $ billion), 2017–21

Table 33: Europe gdp (current prices, $ billion), 2017–21

Table 34: Europe inflation, 2017–21

Table 35: Europe consumer price index (absolute), 2017–21

Table 36: Europe exchange rate, 2017–21

Table 37: France skincare market value: $ million, 2017–21

Table 38: France skincare market volume: million units, 2017–21

Table 39: France skincare market category segmentation: $ million, 2021

Table 40: France skincare market geography segmentation: $ million, 2021

Table 41: France skincare market share: % share, by value, 2021

Table 42: France skincare market distribution: % share, by value, 2021

Table 43: France skincare market value forecast: $ million, 2021–26

Table 44: France skincare market volume forecast: million units, 2021–26

Table 45: France size of population (million), 2017–21

Table 46: France gdp (constant 2005 prices, $ billion), 2017–21

Table 47: France gdp (current prices, $ billion), 2017–21

Table 48: France inflation, 2017–21

Table 49: France consumer price index (absolute), 2017–21

Table 50: France exchange rate, 2017–21

Table 51: Germany skincare market value: $ million, 2017–21

Table 52: Germany skincare market volume: million units, 2017–21

Table 53: Germany skincare market category segmentation: $ million, 2021

Table 54: Germany skincare market geography segmentation: $ million, 2021

Table 55: Germany skincare market share: % share, by value, 2021

Table 56: Germany skincare market distribution: % share, by value, 2021

Table 57: Germany skincare market value forecast: $ million, 2021–26

Table 58: Germany skincare market volume forecast: million units, 2021–26

Table 59: Germany size of population (million), 2017–21

Table 60: Germany gdp (constant 2005 prices, $ billion), 2017–21

Table 61: Germany gdp (current prices, $ billion), 2017–21

Table 62: Germany inflation, 2017–21

Table 63: Germany consumer price index (absolute), 2017–21

Table 64: Germany exchange rate, 2017–21

Table 65: Italy skincare market value: $ million, 2017–21

Table 66: Italy skincare market volume: million units, 2017–21

Table 67: Italy skincare market category segmentation: $ million, 2021

Table 68: Italy skincare market geography segmentation: $ million, 2021

Table 69: Italy skincare market share: % share, by value, 2021

Table 70: Italy skincare market distribution: % share, by value, 2021

Table 71: Italy skincare market value forecast: $ million, 2021–26

Table 72: Italy skincare market volume forecast: million units, 2021–26

Table 73: Italy size of population (million), 2017–21

Table 74: Italy gdp (constant 2005 prices, $ billion), 2017–21

Table 75: Italy gdp (current prices, $ billion), 2017–21

Table 76: Italy inflation, 2017–21

Table 77: Italy consumer price index (absolute), 2017–21

Table 78: Italy exchange rate, 2017–21

Table 79: Japan skincare market value: $ million, 2017–21

Table 80: Japan skincare market volume: million units, 2017–21

Table 81: Japan skincare market category segmentation: $ million, 2021

Table 82: Japan skincare market geography segmentation: $ million, 2021

Table 83: Japan skincare market share: % share, by value, 2021

Table 84: Japan skincare market distribution: % share, by value, 2021

Table 85: Japan skincare market value forecast: $ million, 2021–26

Table 86: Japan skincare market volume forecast: million units, 2021–26

Table 87: Japan size of population (million), 2017–21

Table 88: Japan gdp (constant 2005 prices, $ billion), 2017–21

Table 89: Japan gdp (current prices, $ billion), 2017–21

Table 90: Japan inflation, 2017–21

Table 91: Japan consumer price index (absolute), 2017–21

Table 92: Japan exchange rate, 2017–21

Table 93: Australia skincare market value: $ million, 2017–21

Table 94: Australia skincare market volume: million units, 2017–21

Table 95: Australia skincare market category segmentation: $ million, 2021

Table 96: Australia skincare market geography segmentation: $ million, 2021

Table 97: Australia skincare market share: % share, by value, 2021

Table 98: Australia skincare market distribution: % share, by value, 2021

Table 99: Australia skincare market value forecast: $ million, 2021–26

Table 100: Australia skincare market volume forecast: million units, 2021–26

Table 101: Australia size of population (million), 2017–21

Table 102: Australia gdp (constant 2005 prices, $ billion), 2017–21

Table 103: Australia gdp (current prices, $ billion), 2017–21

Table 104: Australia inflation, 2017–21

Table 105: Australia consumer price index (absolute), 2017–21

Table 106: Australia exchange rate, 2017–21

Table 107: Canada skincare market value: $ million, 2017–21

Table 108: Canada skincare market volume: million units, 2017–21

Table 109: Canada skincare market category segmentation: $ million, 2021

Table 110: Canada skincare market geography segmentation: $ million, 2021

Table 111: Canada skincare market share: % share, by value, 2021

Table 112: Canada skincare market distribution: % share, by value, 2021

Table 113: Canada skincare market value forecast: $ million, 2021–26

Table 114: Canada skincare market volume forecast: million units, 2021–26

Table 115: Canada size of population (million), 2017–21

Table 116: Canada gdp (constant 2005 prices, $ billion), 2017–21

Table 117: Canada gdp (current prices, $ billion), 2017–21

Table 118: Canada inflation, 2017–21

Table 119: Canada consumer price index (absolute), 2017–21

Table 120: Canada exchange rate, 2017–21

Table 121: China skincare market value: $ million, 2017–21

Table 122: China skincare market volume: million units, 2017–21

Table 123: China skincare market category segmentation: $ million, 2021

Table 124: China skincare market geography segmentation: $ million, 2021

Table 125: China skincare market share: % share, by value, 2021

Table 126: China skincare market distribution: % share, by value, 2021

Table 127: China skincare market value forecast: $ million, 2021–26

Table 128: China skincare market volume forecast: million units, 2021–26

Table 129: China size of population (million), 2017–21

Table 130: China gdp (constant 2005 prices, $ billion), 2017–21

Table 131: China gdp (current prices, $ billion), 2017–21

Table 132: China inflation, 2017–21

Table 133: China consumer price index (absolute), 2017–21

Table 134: China exchange rate, 2017–21

Table 135: Netherlands skincare market value: $ million, 2017–21

Table 136: Netherlands skincare market volume: million units, 2017–21

Table 137: Netherlands skincare market category segmentation: $ million, 2021

Table 138: Netherlands skincare market geography segmentation: $ million, 2021

Table 139: Netherlands skincare market share: % share, by value, 2021

Table 140: Netherlands skincare market distribution: % share, by value, 2021

Table 141: Netherlands skincare market value forecast: $ million, 2021–26

Table 142: Netherlands skincare market volume forecast: million units, 2021–26

Table 143: Netherlands size of population (million), 2017–21

Table 144: Netherlands gdp (constant 2005 prices, $ billion), 2017–21

Table 145: Netherlands gdp (current prices, $ billion), 2017–21

Table 146: Netherlands inflation, 2017–21

Table 147: Netherlands consumer price index (absolute), 2017–21

Table 148: Netherlands exchange rate, 2017–21

Table 149: Spain skincare market value: $ million, 2017–21

Table 150: Spain skincare market volume: million units, 2017–21

Table 151: Spain skincare market category segmentation: $ million, 2021

Table 152: Spain skincare market geography segmentation: $ million, 2021

Table 153: Spain skincare market share: % share, by value, 2021

Table 154: Spain skincare market distribution: % share, by value, 2021

Table 155: Spain skincare market value forecast: $ million, 2021–26

Table 156: Spain skincare market volume forecast: million units, 2021–26

Table 157: Spain size of population (million), 2017–21

Table 158: Spain gdp (constant 2005 prices, $ billion), 2017–21

Table 159: Spain gdp (current prices, $ billion), 2017–21

Table 160: Spain inflation, 2017–21

Table 161: Spain consumer price index (absolute), 2017–21

Table 162: Spain exchange rate, 2017–21

Table 163: United Kingdom skincare market value: $ million, 2017–21

Table 164: United Kingdom skincare market volume: million units, 2017–21

Table 165: United Kingdom skincare market category segmentation: $ million, 2021

Table 166: United Kingdom skincare market geography segmentation: $ million, 2021

Table 167: United Kingdom skincare market share: % share, by value, 2021

Table 168: United Kingdom skincare market distribution: % share, by value, 2021

Table 169: United Kingdom skincare market value forecast: $ million, 2021–26

Table 170: United Kingdom skincare market volume forecast: million units, 2021–26

Table 171: United Kingdom size of population (million), 2017–21

Table 172: United Kingdom gdp (constant 2005 prices, $ billion), 2017–21

Table 173: United Kingdom gdp (current prices, $ billion), 2017–21

Table 174: United Kingdom inflation, 2017–21

Table 175: United Kingdom consumer price index (absolute), 2017–21

Table 176: United Kingdom exchange rate, 2017–21

Table 177: United States skincare market value: $ million, 2017–21

Table 178: United States skincare market volume: million units, 2017–21

Table 179: United States skincare market category segmentation: $ million, 2021

Table 180: United States skincare market geography segmentation: $ million, 2021

Table 181: United States skincare market share: % share, by value, 2021

Table 182: United States skincare market distribution: % share, by value, 2021

Table 183: United States skincare market value forecast: $ million, 2021–26

Table 184: United States skincare market volume forecast: million units, 2021–26

Table 185: United States size of population (million), 2017–21

Table 186: United States gdp (constant 2005 prices, $ billion), 2017–21

Table 187: United States gdp (current prices, $ billion), 2017–21

Table 188: United States inflation, 2017–21

Table 189: United States consumer price index (absolute), 2017–21

Table 190: United States exchange rate, 2017–21

Table 191: The Procter & Gamble Co: key facts

Table 192: The Procter & Gamble Co: Annual Financial Ratios

Table 193: The Procter & Gamble Co: Key Employees

Table 194: The Procter & Gamble Co: Key Employees Continued

Table 195: Amorepacific Corp: key facts

Table 196: Amorepacific Corp: Annual Financial Ratios

Table 197: Amorepacific Corp: Key Employees

Table 198: Beiersdorf AG: key facts

Table 199: Beiersdorf AG: Annual Financial Ratios

Table 200: Beiersdorf AG: Key Employees

Table 201: Laboratoires Pierre Fabre SA: key facts

Table 202: Laboratoires Pierre Fabre SA: Key Employees

Table 203: Clarins USA Inc: key facts

Table 204: Clarins USA Inc: Key Employees

Table 205: Shiseido Company, Limited: key facts

Table 206: Shiseido Company, Limited: Annual Financial Ratios

Table 207: Shiseido Company, Limited: Key Employees

Table 208: Shiseido Company, Limited: Key Employees Continued

Table 209: Shiseido Company, Limited: Key Employees Continued

Table 210: Kao Corporation: key facts

Table 211: Kao Corporation: Annual Financial Ratios

Table 212: Kao Corporation: Key Employees

Table 213: Kao Corporation: Key Employees Continued

Table 214: KOSE Corp: key facts

Table 215: KOSE Corp: Annual Financial Ratios

Table 216: KOSE Corp: Key Employees

Table 217: KOSE Corp: Key Employees Continued

Table 218: POLA Orbis Holdings Inc: key facts

Table 219: POLA Orbis Holdings Inc: Annual Financial Ratios

Table 220: POLA Orbis Holdings Inc: Key Employees

Table 221: Natura & Co Holding SA: key facts

Table 222: Natura & Co Holding SA: Annual Financial Ratios

Table 223: Natura & Co Holding SA: Key Employees

Table 224: Mary Kay (China) Cosmetics Co Ltd: key facts

Table 225: The Estee Lauder Companies Inc: key facts

Table 226: The Estee Lauder Companies Inc: Annual Financial Ratios

Table 227: The Estee Lauder Companies Inc: Key Employees

Table 228: The Estee Lauder Companies Inc: Key Employees Continued

Table 229: L’Oreal SA: key facts

Table 230: L’Oreal SA: Annual Financial Ratios

Table 231: L’Oreal SA: Key Employees

Table 232: L’Oreal SA: Key Employees Continued

Table 233: Johnson & Johnson Pvt Ltd: key facts

Table 234: Johnson & Johnson Pvt Ltd: Key Employees

Table 235: Unilever NV (Inactive): key facts

Table 236: Unilever NV (Inactive): Key Employees

Table 237: Unilever NV (Inactive): Key Employees Continued

Figures

List of Figures

Figure 1: Global skincare market value: $ million, 2017–21

Figure 2: Global skincare market volume: million units, 2017–21

Figure 3: Global skincare market category segmentation: % share, by value, 2021

Figure 4: Global skincare market geography segmentation: % share, by value, 2021

Figure 5: Global skincare market share: % share, by value, 2021

Figure 6: Global skincare market distribution: % share, by value, 2021

Figure 7: Global skincare market value forecast: $ million, 2021–26

Figure 8: Global skincare market volume forecast: million units, 2021–26

Figure 9: Forces driving competition in the global skincare market, 2021

Figure 10: Drivers of buyer power in the global skincare market, 2021

Figure 11: Drivers of supplier power in the global skincare market, 2021

Figure 12: Factors influencing the likelihood of new entrants in the global skincare market, 2021

Figure 13: Factors influencing the threat of substitutes in the global skincare market, 2021

Figure 14: Drivers of degree of rivalry in the global skincare market, 2021

Figure 15: Asia-Pacific skincare market value: $ million, 2017–21

Figure 16: Asia–Pacific skincare market volume: million units, 2017–21

Figure 17: Asia–Pacific skincare market category segmentation: % share, by value, 2021

Figure 18: Asia–Pacific skincare market geography segmentation: % share, by value, 2021

Figure 19: Asia-Pacific skincare market share: % share, by value, 2021

Figure 20: Asia-Pacific skincare market distribution: % share, by value, 2021

Figure 21: Asia-Pacific skincare market value forecast: $ million, 2021–26

Figure 22: Asia–Pacific skincare market volume forecast: million units, 2021–26

Figure 23: Forces driving competition in the skincare market in Asia-Pacific, 2021

Figure 24: Drivers of buyer power in the skincare market in Asia-Pacific, 2021

Figure 25: Drivers of supplier power in the skincare market in Asia-Pacific, 2021

Figure 26: Factors influencing the likelihood of new entrants in the skincare market in Asia-Pacific, 2021

Figure 27: Factors influencing the threat of substitutes in the skincare market in Asia-Pacific, 2021

Figure 28: Drivers of degree of rivalry in the skincare market in Asia-Pacific, 2021

Figure 29: Europe skincare market value: $ million, 2017–21

Figure 30: Europe skincare market volume: million units, 2017–21

Figure 31: Europe skincare market category segmentation: % share, by value, 2021

Figure 32: Europe skincare market geography segmentation: % share, by value, 2021

Figure 33: Europe skincare market share: % share, by value, 2021

Figure 34: Europe skincare market distribution: % share, by value, 2021

Figure 35: Europe skincare market value forecast: $ million, 2021–26

Figure 36: Europe skincare market volume forecast: million units, 2021–26

Figure 37: Forces driving competition in the skincare market in Europe, 2021

Figure 38: Drivers of buyer power in the skincare market in Europe, 2021

Figure 39: Drivers of supplier power in the skincare market in Europe, 2021

Figure 40: Factors influencing the likelihood of new entrants in the skincare market in Europe, 2021

Figure 41: Factors influencing the threat of substitutes in the skincare market in Europe, 2021

Figure 42: Drivers of degree of rivalry in the skincare market in Europe, 2021

Figure 43: France skincare market value: $ million, 2017–21

Figure 44: France skincare market volume: million units, 2017–21

Figure 45: France skincare market category segmentation: % share, by value, 2021

Figure 46: France skincare market geography segmentation: % share, by value, 2021

Figure 47: France skincare market share: % share, by value, 2021

Figure 48: France skincare market distribution: % share, by value, 2021

Figure 49: France skincare market value forecast: $ million, 2021–26

Figure 50: France skincare market volume forecast: million units, 2021–26

Figure 51: Forces driving competition in the skincare market in France, 2021

Figure 52: Drivers of buyer power in the skincare market in France, 2021

Figure 53: Drivers of supplier power in the skincare market in France, 2021

Figure 54: Factors influencing the likelihood of new entrants in the skincare market in France, 2021

Figure 55: Factors influencing the threat of substitutes in the skincare market in France, 2021

Figure 56: Drivers of degree of rivalry in the skincare market in France, 2021

Figure 57: Germany skincare market value: $ million, 2017–21

Figure 58: Germany skincare market volume: million units, 2017–21

Figure 59: Germany skincare market category segmentation: % share, by value, 2021

Figure 60: Germany skincare market geography segmentation: % share, by value, 2021

Figure 61: Germany skincare market share: % share, by value, 2021

Figure 62: Germany skincare market distribution: % share, by value, 2021

Figure 63: Germany skincare market value forecast: $ million, 2021–26

Figure 64: Germany skincare market volume forecast: million units, 2021–26

Figure 65: Forces driving competition in the skincare market in Germany, 2021

Figure 66: Drivers of buyer power in the skincare market in Germany, 2021

Figure 67: Drivers of supplier power in the skincare market in Germany, 2021

Figure 68: Factors influencing the likelihood of new entrants in the skincare market in Germany, 2021

Figure 69: Factors influencing the threat of substitutes in the skincare market in Germany, 2021

Figure 70: Drivers of degree of rivalry in the skincare market in Germany, 2021

Figure 71: Italy skincare market value: $ million, 2017–21

Figure 72: Italy skincare market volume: million units, 2017–21

Figure 73: Italy skincare market category segmentation: % share, by value, 2021

Figure 74: Italy skincare market geography segmentation: % share, by value, 2021

Figure 75: Italy skincare market share: % share, by value, 2021

Figure 76: Italy skincare market distribution: % share, by value, 2021

Figure 77: Italy skincare market value forecast: $ million, 2021–26

Figure 78: Italy skincare market volume forecast: million units, 2021–26

Figure 79: Forces driving competition in the skincare market in Italy, 2021

Figure 80: Drivers of buyer power in the skincare market in Italy, 2021

Figure 81: Drivers of supplier power in the skincare market in Italy, 2021

Figure 82: Factors influencing the likelihood of new entrants in the skincare market in Italy, 2021

Figure 83: Factors influencing the threat of substitutes in the skincare market in Italy, 2021

Figure 84: Drivers of degree of rivalry in the skincare market in Italy, 2021

Figure 85: Japan skincare market value: $ million, 2017–21

Figure 86: Japan skincare market volume: million units, 2017–21

Figure 87: Japan skincare market category segmentation: % share, by value, 2021

Figure 88: Japan skincare market geography segmentation: % share, by value, 2021

Figure 89: Japan skincare market share: % share, by value, 2021

Figure 90: Japan skincare market distribution: % share, by value, 2021

Figure 91: Japan skincare market value forecast: $ million, 2021–26

Figure 92: Japan skincare market volume forecast: million units, 2021–26

Figure 93: Forces driving competition in the skincare market in Japan, 2021

Figure 94: Drivers of buyer power in the skincare market in Japan, 2021

Figure 95: Drivers of supplier power in the skincare market in Japan, 2021

Figure 96: Factors influencing the likelihood of new entrants in the skincare market in Japan, 2021

Figure 97: Factors influencing the threat of substitutes in the skincare market in Japan, 2021

Figure 98: Drivers of degree of rivalry in the skincare market in Japan, 2021

Figure 99: Australia skincare market value: $ million, 2017–21

Figure 100: Australia skincare market volume: million units, 2017–21

Figure 101: Australia skincare market category segmentation: % share, by value, 2021

Figure 102: Australia skincare market geography segmentation: % share, by value, 2021

Figure 103: Australia skincare market share: % share, by value, 2021

Figure 104: Australia skincare market distribution: % share, by value, 2021

Figure 105: Australia skincare market value forecast: $ million, 2021–26

Figure 106: Australia skincare market volume forecast: million units, 2021–26

Figure 107: Forces driving competition in the skincare market in Australia, 2021

Figure 108: Drivers of buyer power in the skincare market in Australia, 2021

Figure 109: Drivers of supplier power in the skincare market in Australia, 2021

Figure 110: Factors influencing the likelihood of new entrants in the skincare market in Australia, 2021

Figure 111: Factors influencing the threat of substitutes in the skincare market in Australia, 2021

Figure 112: Drivers of degree of rivalry in the skincare market in Australia, 2021

Figure 113: Canada skincare market value: $ million, 2017–21

Figure 114: Canada skincare market volume: million units, 2017–21

Figure 115: Canada skincare market category segmentation: % share, by value, 2021

Figure 116: Canada skincare market geography segmentation: % share, by value, 2021

Figure 117: Canada skincare market share: % share, by value, 2021

Figure 118: Canada skincare market distribution: % share, by value, 2021

Figure 119: Canada skincare market value forecast: $ million, 2021–26

Figure 120: Canada skincare market volume forecast: million units, 2021–26

Figure 121: Forces driving competition in the skincare market in Canada, 2021

Figure 122: Drivers of buyer power in the skincare market in Canada, 2021

Figure 123: Drivers of supplier power in the skincare market in Canada, 2021

Figure 124: Factors influencing the likelihood of new entrants in the skincare market in Canada, 2021

Figure 125: Factors influencing the threat of substitutes in the skincare market in Canada, 2021

Figure 126: Drivers of degree of rivalry in the skincare market in Canada, 2021

Figure 127: China skincare market value: $ million, 2017–21

Figure 128: China skincare market volume: million units, 2017–21

Figure 129: China skincare market category segmentation: % share, by value, 2021

Figure 130: China skincare market geography segmentation: % share, by value, 2021

Figure 131: China skincare market share: % share, by value, 2021

Figure 132: China skincare market distribution: % share, by value, 2021

Figure 133: China skincare market value forecast: $ million, 2021–26

Figure 134: China skincare market volume forecast: million units, 2021–26

Figure 135: Forces driving competition in the skincare market in China, 2021

Figure 136: Drivers of buyer power in the skincare market in China, 2021

Figure 137: Drivers of supplier power in the skincare market in China, 2021

Figure 138: Factors influencing the likelihood of new entrants in the skincare market in China, 2021

Figure 139: Factors influencing the threat of substitutes in the skincare market in China, 2021

Figure 140: Drivers of degree of rivalry in the skincare market in China, 2021

Figure 141: Netherlands skincare market value: $ million, 2017–21

Figure 142: Netherlands skincare market volume: million units, 2017–21

Figure 143: Netherlands skincare market category segmentation: % share, by value, 2021

Figure 144: Netherlands skincare market geography segmentation: % share, by value, 2021

Figure 145: Netherlands skincare market share: % share, by value, 2021

Figure 146: Netherlands skincare market distribution: % share, by value, 2021

Figure 147: Netherlands skincare market value forecast: $ million, 2021–26

Figure 148: Netherlands skincare market volume forecast: million units, 2021–26

Figure 149: Forces driving competition in the skincare market in the Netherlands, 2021

Figure 150: Drivers of buyer power in the skincare market in the Netherlands, 2021

Figure 151: Drivers of supplier power in the skincare market in the Netherlands, 2021

Figure 152: Factors influencing the likelihood of new entrants in the skincare market in the Netherlands, 2021

Figure 153: Factors influencing the threat of substitutes in the skincare market in the Netherlands, 2021

Figure 154: Drivers of degree of rivalry in the skincare market in the Netherlands, 2021

Figure 155: Spain skincare market value: $ million, 2017–21

Figure 156: Spain skincare market volume: million units, 2017–21

Figure 157: Spain skincare market category segmentation: % share, by value, 2021

Figure 158: Spain skincare market geography segmentation: % share, by value, 2021

Figure 159: Spain skincare market share: % share, by value, 2021

Figure 160: Spain skincare market distribution: % share, by value, 2021

Figure 161: Spain skincare market value forecast: $ million, 2021–26

Figure 162: Spain skincare market volume forecast: million units, 2021–26

Figure 163: Forces driving competition in the skincare market in Spain, 2021

Figure 164: Drivers of buyer power in the skincare market in Spain, 2021

Figure 165: Drivers of supplier power in the skincare market in Spain, 2021

Figure 166: Factors influencing the likelihood of new entrants in the skincare market in Spain, 2021

Figure 167: Factors influencing the threat of substitutes in the skincare market in Spain, 2021

Figure 168: Drivers of degree of rivalry in the skincare market in Spain, 2021

Figure 169: United Kingdom skincare market value: $ million, 2017–21

Figure 170: United Kingdom skincare market volume: million units, 2017–21

Figure 171: United Kingdom skincare market category segmentation: % share, by value, 2021

Figure 172: United Kingdom skincare market geography segmentation: % share, by value, 2021

Figure 173: United Kingdom skincare market share: % share, by value, 2021

Figure 174: United Kingdom skincare market distribution: % share, by value, 2021

Figure 175: United Kingdom skincare market value forecast: $ million, 2021–26

Figure 176: United Kingdom skincare market volume forecast: million units, 2021–26

Figure 177: Forces driving competition in the skincare market in the United Kingdom, 2021

Figure 178: Drivers of buyer power in the skincare market in the United Kingdom, 2021

Figure 179: Drivers of supplier power in the skincare market in the United Kingdom, 2021

Figure 180: Factors influencing the likelihood of new entrants in the skincare market in the United Kingdom, 2021

Figure 181: Factors influencing the threat of substitutes in the skincare market in the United Kingdom, 2021

Figure 182: Drivers of degree of rivalry in the skincare market in the United Kingdom, 2021

Figure 183: United States skincare market value: $ million, 2017–21

Figure 184: United States skincare market volume: million units, 2017–21

Figure 185: United States skincare market category segmentation: % share, by value, 2021

Figure 186: United States skincare market geography segmentation: % share, by value, 2021

Figure 187: United States skincare market share: % share, by value, 2021

Figure 188: United States skincare market distribution: % share, by value, 2021

Figure 189: United States skincare market value forecast: $ million, 2021–26

Figure 190: United States skincare market volume forecast: million units, 2021–26

Figure 191: Forces driving competition in the skincare market in the United States, 2021

Figure 192: Drivers of buyer power in the skincare market in the United States, 2021

Figure 193: Drivers of supplier power in the skincare market in the United States, 2021

Figure 194: Factors influencing the likelihood of new entrants in the skincare market in the United States, 2021

Figure 195: Factors influencing the threat of substitutes in the skincare market in the United States, 2021

Figure 196: Drivers of degree of rivalry in the skincare market in the United States, 2021

Frequently asked questions

Skincare Market Summary, Competitive Analysis and Forecast, 2017-2026 standard reports
Currency USD
$1,995

Can be used by individual purchaser only

$3,990

Can be shared globally by unlimited users within the purchasing corporation e.g. all employees of a single company


Undecided about purchasing this report?

Enquire Before Buying Request a Free Sample

Get in touch to find out about multi-purchase discounts

reportstore@globaldata.com
Tel +44 20 7947 2745

Every customer’s requirement is unique. With over 220,000 construction projects tracked, we can create a tailored dataset for you based on the types of projects you are looking for. Please get in touch with your specific requirements and we can send you a quote.

Sample Report

Skincare Market Summary, Competitive Analysis and Forecast, 2017-2026 was curated by the best experts in the industry and we are confident about its unique quality. However, we want you to make the most beneficial decision for your business, so we offer free sample pages to help you:

  • Assess the relevance of the report
  • Evaluate the quality of the report
  • Justify the cost

Download your copy of the sample report and make an informed decision about whether the full report will provide you with the insights and information you need.

Below is a sample report to understand what you are buying

See what our customers are saying

“The GlobalData platform is our go-to tool for intelligence services. GlobalData provides an easy way to access comprehensive intelligence data around multiple sectors, which essentially makes it a one-for-all intelligence platform, for tendering and approaching customers.

GlobalData is very customer orientated, with a high degree of personalised services, which benefits everyday use. The highly detailed project intelligence and forecast reports can be utilised across multiple departments and workflow scopes, from operational to strategic level, and often support strategic decisions. GlobalData Analytics and visualisation solutions has contributed positively when preparing management presentations and strategic papers.”

Business Intelligence & Marketing Manager, SAL Heavy Lift

“COVID-19 has caused significant interference to our business and the COVID-19 intelligence from GlobalData has helped us reach better decisions around strategy. These two highlights have helped enormously to understand the projections into the future concerning our business units, we also utilise the project database to source new projects for Liebherr-Werk to use as an additional source to pitch for new business.”

Market Analyst & Management, Liebherr-Werk

Your daily news has saved me a lot of time and keeps me up-to-date with what is happening in the market, I like that you almost always have a link to the source origin. We also use your market data in our Strategic Business Process to support our business decisions. By having everything in one place on the Intelligence Center it has saved me a lot of time versus looking on different sources, the alert function also helps with this.

Head of Key Accounts, Saab AB

Having used several other market research companies, I find that GlobalData manages to provide that ‘difficult-to-get’ market data that others can’t, as well as very diverse and complete consumer surveys.

Marketing Intelligence Manager, Portugal Foods

Our experience with GlobalData has been very good, from the platform itself to the people. I find that the analysts and the account team have a high level of customer focus and responsiveness and therefore I can always rely on. The platform is more holistic than other providers. It is convenient and almost like a one stop shop. The pricing suite is highly competitive and value for our organisation.

I like reports that inform new segments such as the analysis on generation Z, millennials, the impact of COVID 19 to our banking customers and their new channel habits. Secondly the specialist insight on affluent sector significantly increases our understanding about this group of customers. The combination of those give us depth and breadth of the evolving market.

I’m in the business of answering and helping people make decisions so with the intelligence center I can do that, effectively and efficiently. I can share quickly key insights that answer and satisfy our country stakeholders by giving them many quality studies and primary research about competitive landscape beyond the outlook of our bank. It helps me be seen as an advisory partner and that makes a big difference. A big benefit of our subscription is that no one holds the whole data and because it allows so many people, so many different parts of our organisation have access, it enables all teams to have the same level of knowledge and decision support.

Head of Customer Insight and Research, Standard Chartered

“I know that I can always rely on Globaldata’s work when I’m searching for the right consumer and market insights. I use Globaldata insights to understand the changing market & consumer landscape and help create better taste & wellbeing solutions for our customers in food, beverage and healthcare industries.

Globaldata has the right data and the reports are of very high quality compared to your competitors. Globaldata not only has overall market sizes & consumer insights on food & beverages but also provides insights at the ingredient & flavour level. That is key for B2B companies like Givaudan. This way we understand our customers’ business and also gain insight to our unique industry”

Head of Consumer Sensory Insights, Givaudan

GlobalData provides a great range of information and reports on various sectors that is highly relevant, timely, easy to access and utilise.  The reports and data dashboards help engagement with clients; they provide valuable industry and market insights that can enrich client conversations and can help in the shaping of value propositions. Moreover, using GlobalData products has helped increase my knowledge of the finance sector, the players within it, and the general threats and opportunities.

I find the consumer surveys that are carried out to be extremely beneficial and not something I have seen anywhere else. They provided an insightful view of why and which consumers take (or don’t) particular financial products. This can help shape conversations with clients to ensure they make the right strategic decisions for their business.

One of the challenges I have found is that data in the payments space is often piecemeal. With GD all of the data I need is in one place, but it also comes with additional market reports that provide useful extra context and information. Having the ability to set-up alerts on relevant movements in the industry, be it competitors or customers, and have them emailed directly to me, ensures I get early sight of industry activity and don’t have to search for news.

Senior Account Manager, TSYS
Go even deeper with GlobalData Intelligence Center

Every Company Report we produce is powered by the GlobalData Intelligence Center.

Subscribing to our intelligence platform means you can monitor developments at Skincare Market Summary, Competitive Analysis and Forecast, 2017-2026 in real time.

  • Access a live Skincare Market Summary, Competitive Analysis and Forecast, 2017-2026 dashboard for 12 months, with up-to-the-minute insights.
  • Fuel your decision making with real-time deal coverage and media activity.
  • Turn insights on financials, deals, products and pipelines into powerful agents of commercial advantage.