Smart Cities Market Trends and Analysis by Application, IT Component, Vertical, Region, and Segment Forecast to 2027
Powered by ![]()
Access in-depth insight and stay ahead of the market

Accessing the in-depth insights from the ‘Smart Cities’ report can help:
- Gain a valuable understanding of the current and future state of the market, allowing businesses to make informed decisions about market entry, product development, and investments.
- Identify competitors’ capabilities to stay ahead in the market.
- Identify segments and get an understanding of various stakeholders across different stages of the entire value chain.
- Anticipate changes in demand and adjust the business development strategies.
- Identify potential regions and countries for growth opportunities.
How is our ‘Smart Cities’ report different from other reports in the market?
- The report presents in-depth market sizing and forecasts at a segment level for more than 20 countries, including historical and forecast analysis for the period 2019-27 for market assessment.
- Detailed segmentation by:
- Application – Smart Buildings, Smart City, Smart Metering, Smart Payment Systems, Smart Signage
- IT Component – Hardware, Software, and Services
- Vertical – Consumer Goods & Retail, Government, Manufacturing, Transport and Logistics, Travel and Leisure, Utilities, and Others
- Region – North America, Europe, Asia-Pacific, South & Central America, and Middle East & Africa
- The report covers key market trends and challenges impacting the smart cities market.
- The report covers dashboard analytics for M&A deals, venture financing/private equity deals, job activity, social media analytics, and patent activities.
- The competitive landscape includes competitive positioning of key companies and their strengths and limitations in the market that will help the stakeholders in the ongoing process of identifying, researching, and evaluating competitors, to gain insight to form their business strategies.
- The report covers competitive profiling and benchmarking of key companies in the market to provide a deeper understanding of industry competition.
- The report can be a valuable tool for stakeholders to improve their operations, increase customer satisfaction, and maximize profitability by analyzing the latest smart cities trends, tracking market growth and demand, and evaluating the existing competition in the market.
We recommend this valuable source of information to:
- Smart Cities Products/Solution Providers
- Internet of Things (IoT) Products/Solution Providers
- Consulting & Professional Services Firms
- Venture Capital/Equity Firms/Investment Firms
- Telecom/Networking Companies
- Sensors/Microcontroller/Microprocessor Providers
Get a Snapshot of the Smart Cities Market, Download a Free Report Sample
Smart Cities Market Report Overview
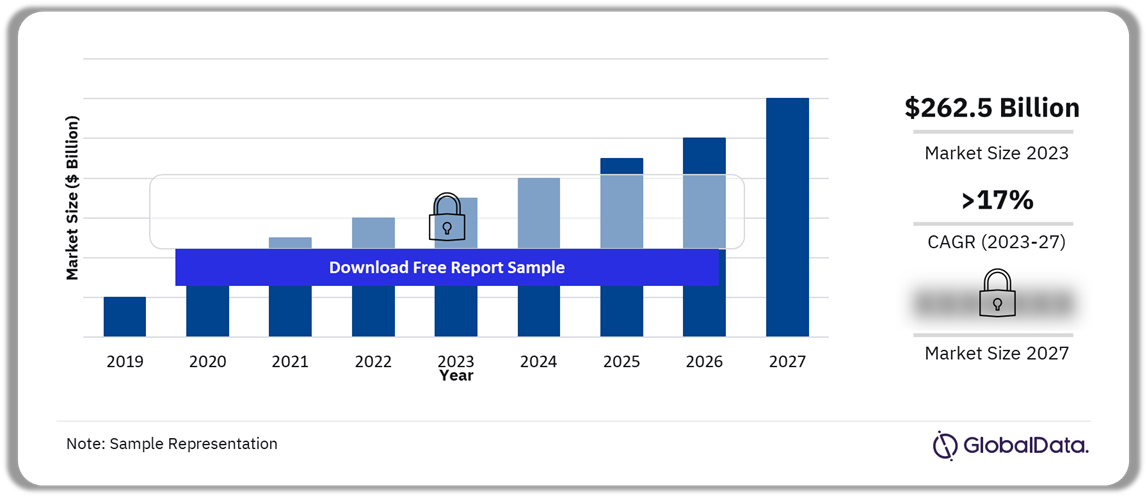
The smart cities market size revenue was valued at $262.5 billion in 2023 and is expected to grow at a compound annual growth rate (CAGR) of 17.2% over the forecast period. Factors such as rising demand for sustainable and climate-resilient urban areas, coupled with the proliferation of energy-efficient sensors and network technologies, are fueling market growth. Cities globally face mounting pressure to meet environmental obligations, including carbon emissions reduction, water preservation, and efficient waste handling. To tackle these challenges, many leaders are turning to smart city solutions to improve decision-making through the utilization of vast datasets.
Smart cities are dependent on vast arrays of sensors and networks for connectivity. Further, it is expected that the prevalence of low-power sensors and networks will rise significantly in the future, integrating them into various infrastructures such as streetlights, traffic signals, buildings, bridges, CCTVs, and numerous other elements. The objective of smart city tools is to continuously collect crucial data and utilize it for informed decision-making processes.
Smart Cities Market Outlook, 2019-2027 ($Billion)
Buy the Full Report for Additional Insights on the Smart Cities Market Forecast
The increasing need for sustainable infrastructure, driven by population growth and urbanization, has significantly influenced market expansion. Local governments are actively promoting organizational and institutional shifts, backing continued investments via smart city initiatives in sectors like transportation, utilities, safety, and administration, and fostering collaboration among various businesses through partnership establishment.
However, the implementation of these initiatives presents a range of challenges for the authorities. For instance, they rely on a combination of information and communication technology (ICT), artificial intelligence/machine learning (AI/ML), cloud computing, Internet of Things (IoT), and other technologies. The presence of uncontrolled and unmonitored connected devices in the IoT exposes data to potential hacking and cyberattacks, posing a risk of data theft, device hijacking, ransomware, and data breaches. These threats have the potential to significantly impact connected cities.
In April 2023, cybersecurity agencies from the US, UK, Canada, Australia, and New Zealand collaborated to release a joint guide addressing cybersecurity threats in smart cities. This guide emphasizes risks including expanded and interconnected attack surfaces, vulnerabilities within the ICT supply chain, and the growing automation of infrastructure operations. The issuance of such guidelines will aid governments and vendors in developing cyber-resilient infrastructure.
| Market Size (2023) | $262.5 billion |
| CAGR | 17.2% |
| Forecast Period | 2023-2027 |
| Historic Data | 2019-2022 |
| Report Scope & Coverage | Revenue Forecast, Competitive Index, Company Landscape, Growth Trends |
| Application Segment | Smart Buildings, Smart City, Smart Metering, Smart Payment Systems, Smart Signage |
| IT Component Segment | Hardware, Software, Services |
| Vertical Segment | Consumer Goods & Retail, Government, Manufacturing, Transport and Logistics, Travel and Leisure, Utilities, and Others. |
| Geographies | North America, Europe, Asia Pacific, South & Central America, Middle East & Africa |
| Countries | US, Canada, Mexico, UK, Germany, France, Italy, Spain, Netherlands China, India, Japan, Singapore, Australia, South Korea, Brazil, Argentina, Colombia, UAE, South Africa, and Egypt |
| Key Companies | Accenture Plc, Alibaba Group Holding Ltd., Amazon.com Inc., Hitachi Ltd., Honeywell International Inc., Huawei Investment & Holding Co Ltd., International Business Machines Corp., Intel Corp., Microsoft Corp., Schneider Electric SE, Siemens AG, Toyota Motor Corp. |
| Enquire & Decide | Discover the perfect solution for your business needs. Enquire now and let us help you make an informed decision before making a purchase. |
Smart Cities Market Segmentation by Application
Smart cities are composed of interconnected elements such as buildings, utility meters, payment systems, lighting, signage, and mobility solutions, all operating on a unified platform. Smart meters play a vital role in monitoring electricity, gas, water, and heating consumption, transmitting data wirelessly to service providers, municipalities, or property owners for various purposes. Utilities providers can optimize energy distribution, reduce waste, enhance production efficiency, and accelerate cash flow with the use of smart meters. Moreover, customers benefit from access to accurate and timely consumption data, enabling them to decrease their energy expenses. Cities can improve operational efficiency, conserve energy resources, and reduce greenhouse gas emissions with the help of smart metering.
In smart city buildings, sensors are seamlessly integrated into their fundamental systems. These sensors enable monitoring of various functions, such as power management, lighting control, video surveillance, security systems, water metering, and HVAC systems. Furthermore, smart building technology significantly enhances building safety by incorporating features such as intelligent fire detection and management systems. By analyzing the data collected by these sensors and utilizing it to optimize performance, businesses can achieve enhanced energy efficiency, reduced operational costs, and safer environments.
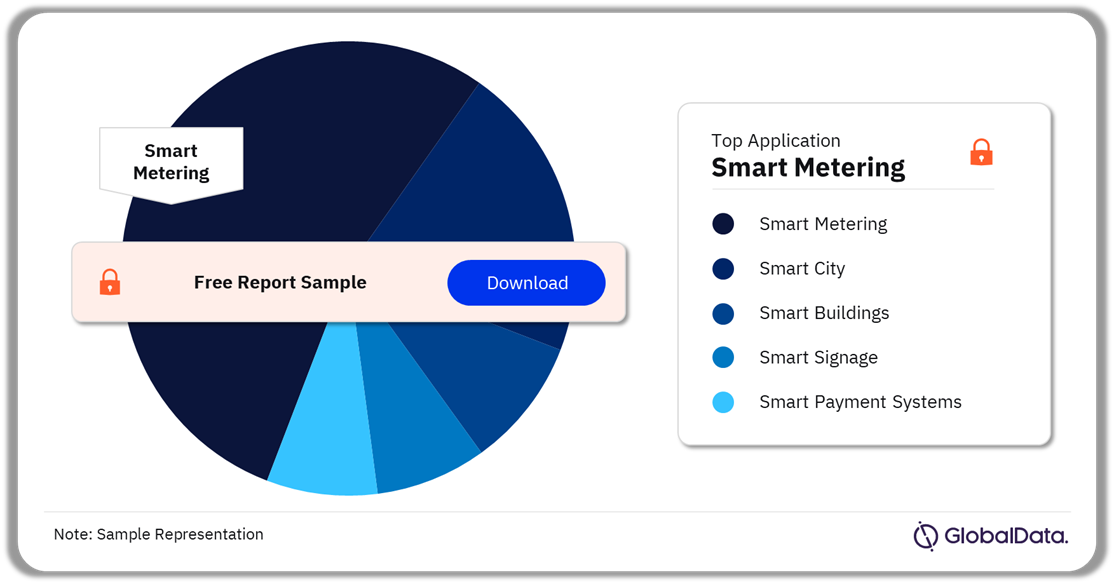
Smart Cities Market Share by Application, 2023 (%)
Buy the Full Report for More Information on Smart Cities Market Applications
In 2023, metering established itself as the leading application segment in the market and is anticipated to register the highest CAGR during the forecast period. Governments across the globe are adopting meters to enhance their monitoring of utility distribution. For instance, by April 2024, more than 3.5 million smart electricity meters will have been installed across multiple cities in India.
Smart Cities Segmentation by IT Component
Smart cities utilize the Internet of Things (IoT) enabled devices, including meters, streetlights, waste management systems, public transport systems, and traffic management systems, for gathering and transmitting data to centralized systems. These systems comprise physical components such as cameras, lenses, sensors, microcontrollers, and microprocessors. The data collected by these systems necessitates transmission and analysis through software solutions.
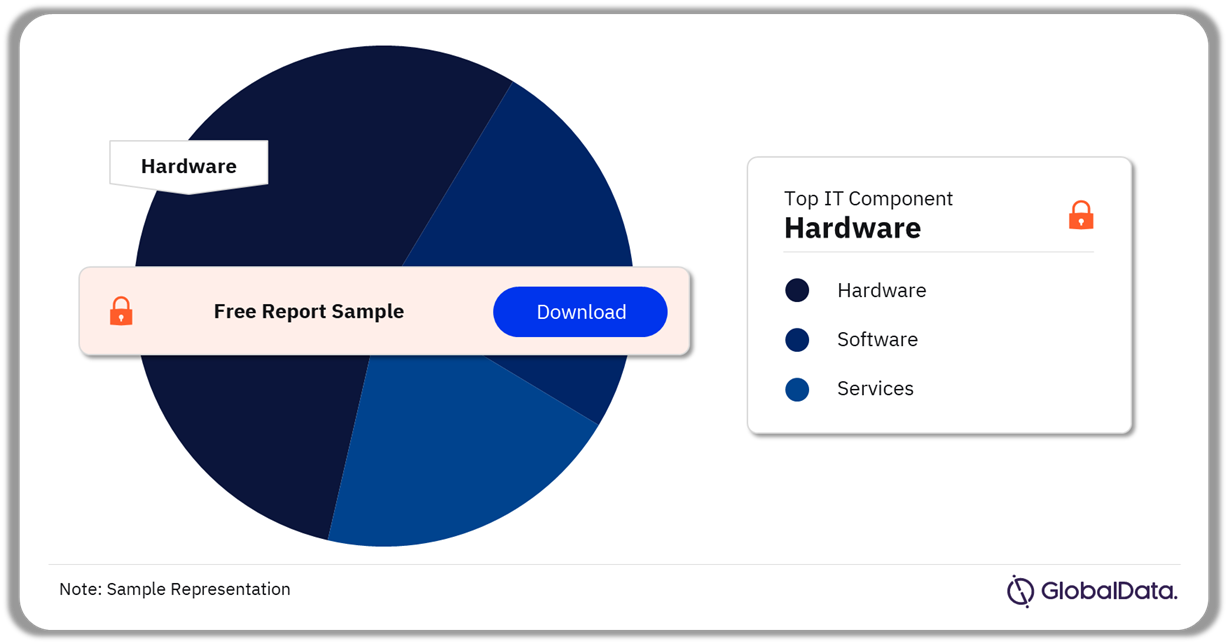
Smart Cities Market Share by IT Component, 2023 (%)
Buy the Full Report for More Information on the Smart Cities Market IT Components
In 2023, hardware emerged as the largest segment among IT components. The segment’s growth is propelled by the increasing adoption of IoT, smart mobility vehicles, intelligent traffic signals, smart grids, and communication lines. Increasing the utility of security cameras, sensors, and other technologies to enhance safety, security, surveillance, and monitoring in cities will further stimulate growth within this segment.
The extensive data collected by sensors necessitates robust analytical platforms to extract insights for efficient operations. With an increasing number of vendors entering the data analytics and management sector, the software segment is expected to experience the highest CAGR during the forecast period.
Smart Cities Market Segmentation by Vertical
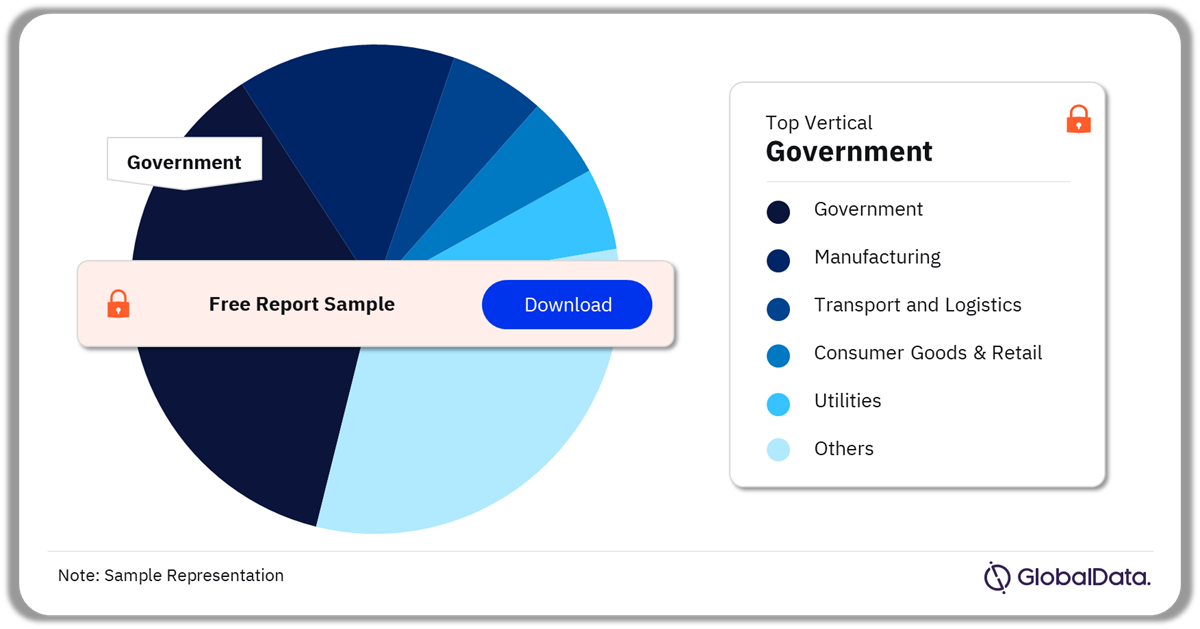
Verticals within the smart cities market include industries such as consumer goods & retail, government, manufacturing, transport and logistics, travel and leisure, utilities, and others. By 2023, the government category, constituting more than 15% of the total market share, emerged as the largest, driven by initiatives aimed at enhancing citizen quality of life and fostering growth in this segment’s market.
The demand is increasing for the integration of advanced technologies and data-driven solutions to enhance efficiency, safety, and sustainability in transportation systems. By utilizing advanced transportation solutions, it is possible to improve mobility, decrease environmental impact, and elevate the overall quality of transportation services for residents and commuters. These factors are expected to be the key drivers behind the fastest compound annual growth rate (CAGR) in the transport and logistics segment during the forecast period.
Smart Cities Market Share by Vertical, 2023 (%)
Buy the Full Report for More Information on Smart Cities Market Verticals
The manufacturing sector is poised for substantial expansion, driven by the growing integration of smart factory technologies. For example, as per a press release from the Chinese Central Government in January 2024, Shanghai boasts approximately 100 such factories generating over 100 billion Yuan ($14.1 million) in annual output through smart manufacturing. In the same month, the city unveiled intentions to establish an additional 70 similar factories by year-end.
Smart Cities Market Analysis by Region
In 2023, the Asia Pacific region held the highest regional market share, representing more than 35% of the total market size. China emerged as the regional leader in the market, with over 30% of the market share by revenue. This can be attributed to several factors, including the expanding penetration of 5G technology, the deployment of metering systems, and the uptake of AI-powered surveillance systems.
By 2027, Asia Pacific is expected to maintain its dominance, with an anticipated CAGR surpassing 18% during the forecast period. Countries in the APAC region are rapidly undergoing digital transformation across various sectors such as transport, utilities, manufacturing, and government. India, Singapore, and South Korea are significantly boosting their investments in smart city initiatives. For instance, as per the Ministry of Housing & Urban Affairs report from November 2023, India had already concluded 6,271 out of a total of 7,959 projects that are a part of the Smart Cities Mission.
Smart Cities Market Share by Region, 2023 (%)
Buy the Full Report for Regional Insights into the Smart Cities Market
The market in South and Central America is anticipated to experience the most significant growth in the forecast period, with a CAGR exceeding 18%, driven by the region’s economic growth and digital transformation across diverse sectors.
Smart Cities Market – Competitive Landscape
The smart cities market is highly competitive with several vendors offering differentiated products. Key players in the market compete based on factors such as product offerings, innovation, pricing, technology, and services. Companies in the smart city sector need to offer cost-effective solutions to thrive and expand in a competitive and rapidly growing market environment.
Market participants pursue a variety of strategic measures to expand their global presence, such as introducing new products, establishing contractual agreements, engaging in mergers and acquisitions, increasing investments, and collaborating with other organizations. For example, in March 2024, Smart Parking Limited, a provider of parking solutions, acquired Local Parking Security Ltd. to expand its footprint in the UK.
In February 2024, Siemens announced its collaboration with Moro Hub, a digital subsidiary of Dubai Electricity and Water Authority (PJSC), aimed at advancing smart city technologies in Dubai. Moro Hub will employ Siemens’ Ruggedcom Cybersecurity Solutions to tackle cyber threats to critical infrastructure. This collaboration is intended to strengthen security across sectors such as energy, transportation, manufacturing, and utilities, while utilizing digitalization tools to foster the development of sustainable smart communities.
Leading Companies in the Smart Cities Market
- Accenture Plc
- Alibaba Group Holding Ltd.
- Amazon.com Inc.
- Hitachi Ltd.
- Honeywell International Inc.
- Huawei Investment & Holding Co Ltd.
- International Business Machines Corp.
- Intel Corp.
- Microsoft Corp.
- Schneider Electric SE
- Siemens AG
- Toyota Motor Corp.
Buy the Full Report to Know More About Leading Smart Cities Companies
Smart Cities Market Segments
GlobalData Plc has segmented the smart cities market report by application, IT component, vertical, and region:
Smart Cities Market Application Outlook (Revenue, $Million, 2019-2027)
- Smart Buildings
- Smart City
- Smart Metering
- Smart Payment Systems
- Smart Signage
Smart Cities Market IT Component Outlook (Revenue, $Million, 2019-2027)
- Hardware
- Software
- Services
Smart Cities Market Vertical Outlook (Revenue, $Million, 2019-2027)
- Consumer Goods & Retail
- Government
- Manufacturing
- Transport and Logistics
- Travel and Leisure
- Utilities
- Others
Smart Cities Market Regional Outlook (Revenue, $Million, 2019-2027)
- North America
- US
- Canada
- Mexico
- Europe
- Germany
- UK
- Italy
- France
- Spain
- Netherlands
- Rest of Europe
- Asia Pacific
- China
- Japan
- India
- Australia
- Singapore
- South Korea
- Rest of Asia Pacific
- South & Central America
- Brazil
- Argentina
- Colombia
- Rest of South & Central America
- Middle East & Africa
- United Arab Emirates (UAE)
- South Africa
- Egypt
- South Africa
- Rest of the Middle East & Africa
Key Highlights
The smart cities market size revenue was valued at $262.5 billion in 2023 and is expected to grow at a compound annual growth rate (CAGR) of 17.2% over the forecast period. Key factors such as increasing demand for sustainable and climate-resilient cities and growing availability of power-efficient sensors and network technologies are driving the market.
Key Players
Accenture PlcAlibaba Group Holding Ltd.
Amazon.com Inc.
Hitachi Ltd.
Honeywell International Inc.
Huawei Investment & Holding Co Ltd.
International Business Machines Corp.
Intel Corp.
Microsoft Corp.
Schneider Electric SE
Siemens AG
Toyota Motor Corp.
Table of Contents
Table
Figures
Frequently asked questions
-
What was the smart cities market size in 2023?
The smart cities market size was valued at $262.5 billion in 2023.
-
What is the smart cities market growth rate?
The smart cities market is expected to grow at a CAGR of 17.2% during the forecast period.
-
What are the key smart cities market drivers?
The key factors influencing the smart cities market comprise increasing demand for sustainable and climate-resilient cities and the advent of generative artificial intelligence (AI). Additionally, the availability of power-efficient sensors and networks, the adoption of metaverse in smart cities, and government initiatives for digital citizenship and e-governance play a significant role in driving the smart cities market.
-
Which was the leading application segment in the smart cities market in 2023?
The smart metering segment accounted for the largest smart cities market share by application in 2023.
-
Which was the leading vertical segment in the smart cities market in 2023?
The government segment accounted for the largest smart cities market share by vertical in 2023.
-
Which was the leading regional market in the smart cities market in 2023?
Asia Pacific accounted for the largest smart cities regional market share in 2023.
-
Which was the leading IT component in the smart cities market in 2023?
Hardware accounted for the largest share of smart cities market by IT component in 2023.
-
Which are the leading smart cities companies globally?
The leading smart cities companies are Accenture Plc., Alibaba Group Holding Ltd., Amazon.com Inc., Hitachi Ltd., Honeywell International Inc., Huawei Investment & Holding Co Ltd., International Business Machines Corp., Intel Corp., Microsoft Corp., Schneider Electric SE, Siemens AG, Toyota Motor Corp.
-
Is there a third level of segmentation in the report?
GlobalData’s focus is on providing reliable and accurate data that is supported by robust research methodology. Our reports undergo rigorous quality checks and are based on primary and secondary research sources, ensuring that the numbers and insights provided are trustworthy. However, despite the best efforts to gather comprehensive data, there could be instances where the available data is limited, making it challenging to provide third-level segmentation. In such cases, GlobalData may choose to provide high-level insights and general trends rather than forcing segmentation that may not be backed by sufficient data. This approach ensures that the report’s overall quality and credibility are maintained.
Get in touch to find out about multi-purchase discounts
reportstore@globaldata.com
Tel +44 20 7947 2745
Every customer’s requirement is unique. With over 220,000 construction projects tracked, we can create a tailored dataset for you based on the types of projects you are looking for. Please get in touch with your specific requirements and we can send you a quote.


Related reports
View more Technology reports