Smart Cities Market Size, Share, Trends, Analysis and Forecast by Region, Application, Infrastructure, Grid and Segment Forecast to 2026

Powered by

Access in-depth insight and stay ahead of the market

Explore actionable market insights from the following data in our Smart Cities Market’ report:

  • Smart cities market outlook: analysis as well as historical figures and forecasts of revenue opportunities from the channel type, business model, spend category, and regional segments.
  • Competitive landscape: an examination of the positioning of leading players in the smart cities market.
  • Company snapshots: analysis of the market position of leading service providers in the smart cities market.
  • Underlying assumptions behind our published base-case forecasts, as well as potential market developments that would alter, either positively or negatively, our base-case outlook.

How is the ‘Smart Cities Market’ report different from other reports in the market?

  • This market intelligence report offers a thorough, forward-looking analysis of the global smart cities market by channel type, business model, spend category, and key opportunities in a concise format to help executives build proactive and profitable growth strategies.
  • Accompanying GlobalData’s Forecast products, the report examines the assumptions and drivers behind ongoing and upcoming trends in smart cities markets.
  • Porter’s five forces analysis: demonstrates the strength of suppliers and buyers along with market competition in the market.
  • The report also highlights key application segments (Smart Transportation, Smart Infrastructure, Smart Grid, Smart Building, and Smart City Platform)
  • The report also highlights key smart transportation segments (Intelligent Transportation, Parking Management, and Smart Ticketing)
  • The report also highlights key smart infrastructure segments (City Surveillance, Smart Lighting, and Command & Control Systems)
  • The report provides an easily digestible market assessment for decision-makers built around in-depth information gathered from local market players, which enables executives to quickly get up to speed with the current and emerging trends in smart cities markets.
  • The broad perspective of the report coupled with comprehensive, actionable detail will help BFSI stakeholders, service providers, and other smart city players succeed in growing the smart cities market globally.

We recommend this valuable source of information to anyone involved in:

  • ​Companies Associated with the Entire Value-Chain of Smart City Platforms – Technology Leaders and Startups
  • ​Smart Transportation Companies – ​Intelligent Transportation/​Parking Management/​Smart Ticketing
  • ​Smart Building and Infrastructure Companies – ​City Surveillance/​Smart Lighting /​Command & Control Systems
  • ​Smart City Services Provider Companies
  • ​Business Development and Market Intelligence
  • Investment Analysts and Portfolio Managers
  • Professional Services – Investment Banks, PE/VC firms
  • M&A/Investment, Management Consultants, and Consulting Firms

To Get a Snapshot of the Smart Cities Market Report, Download a Free Report Sample

Smart Cities Market Overview 

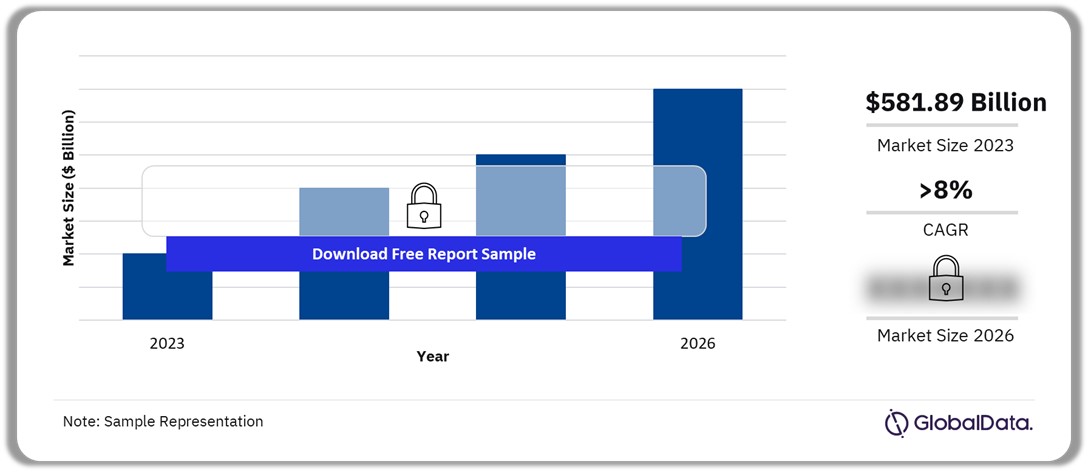
The smart cities market size will be valued at $581.89 billion in 2023 and is expected to grow at a compound annual growth rate (CAGR) of 8% over the forecast period. The EU is bringing together several smart city ecosystem players in a host of programs and initiatives with the aim to boost partnerships, increase access to funding, and experience sharing. Such ecosystem players include city councils, private investors, policymakers, industries, businesses, and smart city technology solution providers. These initiatives will drive smart cities market growth during the forecast period.

Smart Cities Market Outlook, 2023-2026 ($ Billion)
Buy the Report to Get More Insights into the Smart Cities Market Forecast, Download a Free Report Sample

The European region dominated the smart cities market and is projected to grow at a CAGR of 7.9% over the forecast period. The rapid implementation of smart city projects and the number of existing digital cities in the region drive the smart cities market growth which is anticipated to be steady over the forecast period.

Furthermore, advancements in smart city technologies have improved the efficiency of smart city solutions and that, in turn, has strengthened the confidence of ministries and governments in deploying these solutions. Effective use of emerging tech such as Artificial Intelligence & Internet of Things (IoT) is further anticipated to increase the adoption and implementation of smart city solutions over the forecast period.

Governments and administrations around the world have been favorable towards implementing smart city solutions owing to several advantages they provide for smooth operations of numerous activities carried out in the city on daily basis. Smart city solutions have also been observed to be critical in improving overall safety, reducing the carbon footprint, and improving the efficiency of city resources management which has also positively impacted the public sentiment towards the adoption of smart city solutions.

Market Size (2023) $581.89 billion
Market Size (2026) $744.15 billion
CAGR (2022-2026) 8%
Forecast Period 2022-2026
Historic Period 2019-2021
Report Scope & Coverage Revenue Forecast, Competitive Index, Company Market Share, Growth Trends
Application Segment Smart Transportation, Smart Infrastructure, Smart Grid, Smart Building, and Smart City Platform.
Smart Transportation Segment Intelligent Transportation, Parking Management, and Smart Ticketing.
Smart Infrastructure Segment City Surveillance, Smart Lighting, and Command & Control Systems.
Key Companies Amazon Web Services, Google, and International Business Machine Corporation (IBM), Microsoft Corp, Alibaba Holdings Ltd, Tencent Holdings Ltd, Oracle Corp, Salesforce Inc, SAP SE, Cisco Systems Inc
Enquire & Decide Discover the perfect solution for your business needs. Enquire now and let us help you make an informed decision before making a purchase.

Smart Cities Market - COVID-19 Impact

The pandemic’s fallout means cities face a growing number of problems during a period of serious economic uncertainty. As a result, cities will view proposed smart city initiatives differently. For it to be a justifiable investment, an initiative must have a clear, relevant purpose and be as cost-effective as possible. The alternative technologies of only vaguely articulated benefit will become less attractive to cities. Boston was an early pioneer of this approach. In its 2016 Smart City Playbook, Boston encouraged tech vendors to engage with residents and identify the problems that needed addressing before picking up the phone. Smart cities now have no choice but to adopt this mantra.

The last two years have produced numerous examples of cities prioritizing post-pandemic resilience over technological gloss. Columbus is expanding affordable wireless internet access to underserved communities to ensure online education works for the underprivileged. Rotterdam is combatting the unemployment exacerbated by the pandemic by awarding digital tokens to companies that employ vulnerable residents. These tokens can be traded similarly to how carbon offsets can be converted into tradeable assets in a carbon market.

While the pandemic has presented challenges, it has also served as a catalyst for innovation and digital transformation in smart cities. The crisis has demonstrated the potential of smart city technologies to address urban challenges and improve quality of life, leading to a renewed focus on resilient, sustainable, and citizen-centric smart city solutions. The pandemic has also reinforced the importance of sustainable and green solutions in cities. Smart city initiatives have prioritized sustainable transportation, energy-efficient buildings, waste management, and renewable energy adoption. The crisis has provided an opportunity to reevaluate urban planning and prioritize environmental sustainability in future smart city projects.

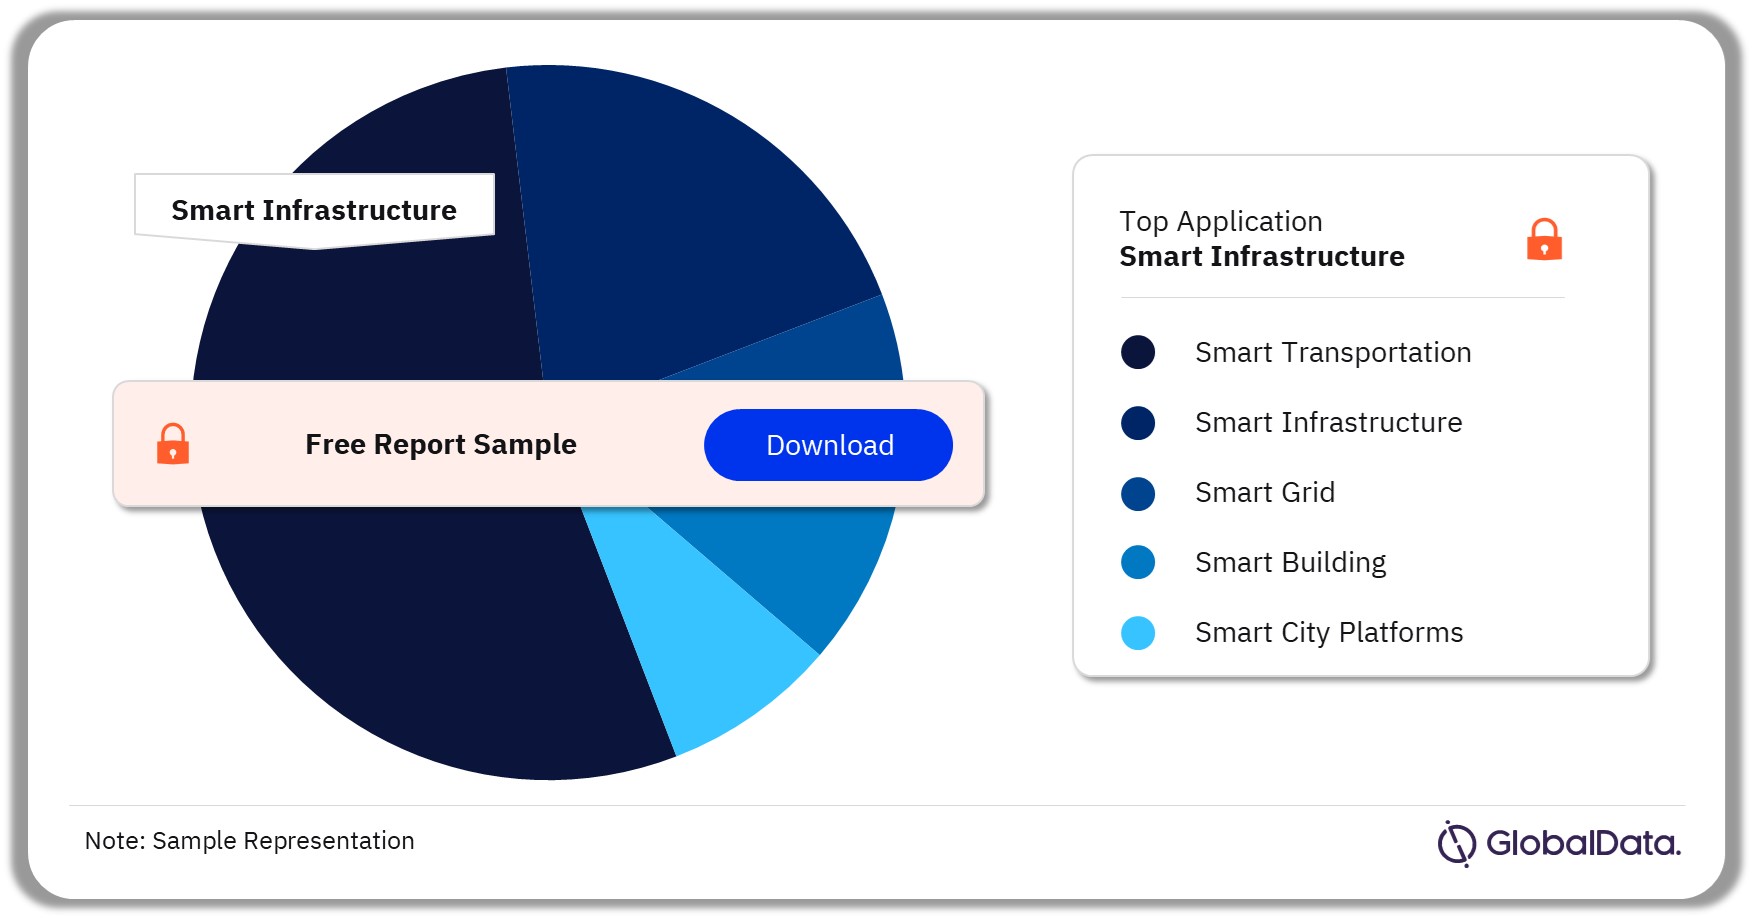
Smart Cities Market Segmentation by Application

Smart cities applications primarily include smart transportation, smart infrastructure, smart grid, smart building, and smart city platform segments.

As of 2022, the smart transportation segment captured the highest share owing to the inclusion of key components such as smart mobility, parking management, and smart ticketing, among others. As urban populations keep growing, creating an effective transport network is one of the critical challenges facing cities. The pandemic has only exacerbated the challenge. Of all the areas of city life, transport has been one of the most heavily impacted by the pandemic. Social distancing has caused the demand for public transportation to plummet in cities worldwide. Even after vaccination programs, remote working and the ongoing fear of contagion means fewer people are using public transport.

Transportation infrastructure uses data to improve a city’s livability and sustainability by reducing traffic. Therefore, it will be crucial when traffic levels increase post-pandemic. Key applications include intelligent traffic systems (ITS), real-time road navigation, and infrastructure predictive maintenance. Autonomous vehicles hold much promise for urban transportation networks. However, extensive sensor networks are necessary to enable the V2I, I2V, and V2V communications required for autonomous vehicles to operate safely in already congested cities.

Smart Cities Market Share by Application, 2023 (%)
Buy the Report to get More Insights into the Segment-Specific Revenues and Shares, Download a Free Report Sample

The smart infrastructure segment accounted is anticipated to grow at a CAGR of more than 6% over the forecast period. This increase is reflected mainly from the post pandemic exposure of the fragility of modern cities. For increased resilience, cities have invested in two infrastructure types: health infrastructure that directly tackles the spread of COVID-19 and infrastructure that improves citizens’ digital access.

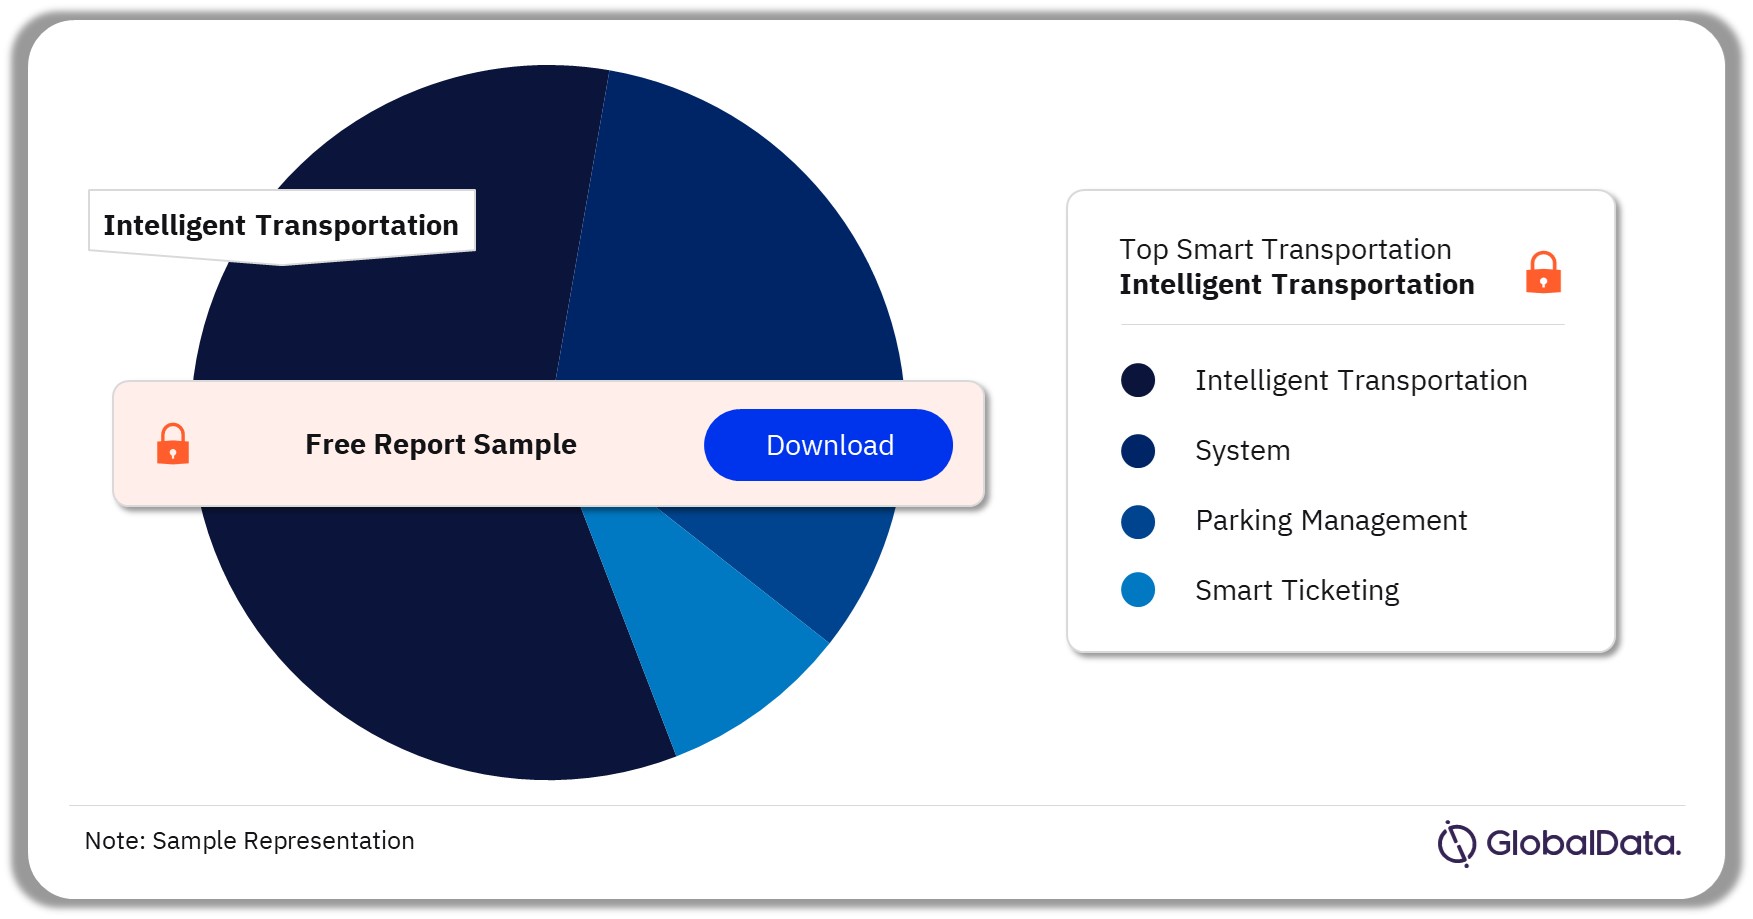
Smart Cities Market Segmentation by Smart Transportation

The smart transportation segment includes intelligent transportation, parking management, and smart ticketing. The intelligent transportation segment is anticipated to grow at a CAGR of more than 8% over the forecast period.  Smart transportation is a crucial component of smart cities, aiming to enhance mobility, reduce congestion, improve safety, and minimize environmental impact. It leverages advanced technologies and data-driven solutions to create efficient and sustainable transportation systems.

Smart Cities Market Share by Smart Transportation, 2023 (%)
Buy the Report to Get More Insights into the Smart Cities Market Smart Transportation
Download a Free Report Sample

The growth of the intelligent transportation segment is attributed to the increased penetration of smart mobility solutions in smart city structures around the globe. The implementation of smart mobility solutions is driven by the need to reduce the number of vehicles on roads, effectively reducing traffic congestion. Furthermore, factors such as reducing the carbon footprint of transportation, improving road safety, and operational efficiency of transportation have also contributed to the segment growth.

Smart Cities Market Segmentation by Smart Infrastructure

Based on smart infrastructure, the smart cities market is categorized into city surveillance, smart lighting, and command & control systems. The command & control systems segment captured the largest market share at 35% in the year 2022. Command & control systems of a smart city include different operating mechanisms that supervise several components of a smart city framework. The criticality of CCS in smart cities has led to its increased adoption over the last few years and is anticipated to continue over the forecast period. The city surveillance segment is anticipated to witness healthy growth at a CAGR of more than 7% over the forecast period.

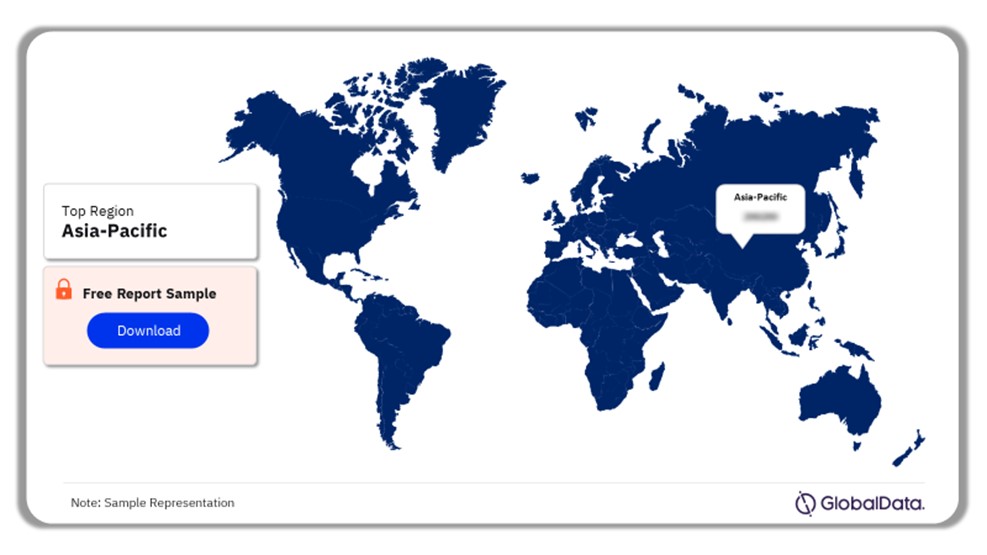
Smart Cities Market Analysis by Region

Europe’s smart city market value was the highest in 2022 and is projected to grow at a CAGR of 7.9% over the forecast period. The regional demand was led by the implementation of innovative smart city solutions across countries such as the UK, Germany, France, and Spain, among others.

The Asia-Pacific (APAC) region represents a significant and rapidly growing market for smart cities. APAC countries are investing heavily in the development and implementation of smart city initiatives to enhance the quality of life for their residents and address urban challenges. Overall, the APAC smart city market presents immense opportunities for technology providers, urban planners, and stakeholders to create intelligent, connected, and sustainable cities that enhance the quality of life for residents and drive economic growth. For instance, countries like Singapore and South Korea are considered leaders in smart city initiatives, while emerging economies like India and Indonesia are witnessing significant growth potential.

Asia Pacific Smart Cities Market Share by Country, 2023 (%)
Asia Pacific Smart Cities Market Share by Country, 2022 (%)
Buy the Report to Get More Insights into the Smart Cities Market
Download a Free Report Sample

North America is projected to witness steady growth at a CAGR exceeding 6% over the forecast period.  The North American region is characterized by a strong inclination towards rapid digital transformation and implementation of smart city solutions such as smart mobility, smart buildings, and smart grid among others. The adoption of next-gen technologies coupled with conducive governments and administrations is anticipated to drive the regional growth over the forecast period.

Smart Cities Market - Competitive Landscape

The smart cities sector exhibits a moderate level of consolidation, although the competition is gradually intensifying due to the emergence of start-ups and new ventures. Major participants in the smart cities market consist of Microsoft Corp, Accenture, IBM, Hitachi, and other notable entities.

In the competitive landscape of smart cities, mergers and acquisitions play a significant role as vendors often collaborate on a project basis to provide tailored solutions. Moreover, the leading competitors are actively investing in research and development to drive innovation in their products/services while ensuring timely delivery. Furthermore, collaboration and strategic partnerships are common in the smart cities market. Companies often join forces to leverage their complementary capabilities and create comprehensive smart city solutions. Partnerships can include technology providers, infrastructure companies, utility providers, and government entities working together to address urban challenges effectively.

Leading Players in the Smart Cities Market

  • Microsoft Corp
  • Hikvision
  • Hitachi
  • Honeywell
  • Alibaba Group
  • Cisco Systems Inc
  • International Business Machines Corp (IBM)
  • Huawei Technologies Co. Ltd.
  • iFlytek

Other Smart Cities Market Vendors Mentioned

Johnson Controls, Nokia, Schneider Electric, and ZTE Corp.

To Know More About Leading Smart Cities Market Players, Download a Free Report Sample

Smart Cities Market Segments and Scope

GlobalData Plc has segmented the smart cities market report by application and region:

Smart Cities Application Outlook (Revenue, USD Million, 2019-2026)

  • Smart Transportation
  • Intelligent Transportation
  • Parking Management
  • Smart Ticketing
  • Smart Infrastructure
  • City Surveillance
  • Smart Lighting
  • Command & Control Systems
  • Smart Grid
  • Smart Building
  • Smart City Platforms

Smart Cities Regional Outlook (Revenue, USD Million, 2019-2026)

  • North America
  • US
  • Canada
  • Europe 
  • Germany
  • UK
  • France
  • Spain
  • Italy
  • Rest of Europe
  • Asia Pacific 
  • China
  • Japan
  • India
  • Australia
  • Rest of Asia Pacific
  • South & Central America
  • Brazil
  • Mexico
  • Colombia
  • Rest of South & Central America
  • Middle East & Africa
  • Kingdom of Saudi Arabia (KSA)
  • United Arab Emirates (UAE)
  • South Africa
  • Rest of Middle East & Africa

Table of Contents

CHAPTER 01 Executive Summary

1.1 Smart Cities Market Snapshot

CHAPTER 02 Research Scope & Segmentation

CHAPTER 03 Smart Cities Industry Trend Analysis

3.1 Smart Cities – Industry Value Chain

3.1.1 SMART CITY PLATFORMS

3.1.2 SMART CITY APPS

3.1.2.1 Smart buildings

3.1.2.2 Smart Transportation

3.1.2.3 Smart Infrastructure

3.1.2.4 Smart Grid

3.1.2.5 Smart City Services

3.2 Smart Cities Market Structure – PORTER’s Analysis]

3.3 Smart Cities – Market Variables & Impact Analysis

3.3.1 MARKET DRIVER ANALYSIS

3.3.1.1 Migration of Population to the Cities

3.3.1.2 Advancements in Smart City Technologies

3.3.2 MARKET CHALLENGES/IMPEDIMENTS

3.3.2.1 Impact of the Pandemic on Economics OF THE Cities

3.3.2.2 Geopolitical Implications on Smart Cities

3.3.2.3 Impact of Natural Calamities and COP26

3.3.3 COVID-19 IMPACT ANALYSIS

3.4 Smart Cities Computing– Mergers & Acquisitions (M&A)

3.4.1 M&A ACTIVITY DASHBOARD

3.5 Smart Cities– Patent Analysis

3.5.1 PATENT ANALYTICS DASHBOARD

3.6 Smart Cities– Job Analysis

3.6.1 JOB ANALYTICS DASHBOARD

3.7 Smart Cities– Venture Financing Analysis

3.7.1 VENTURE FINANCING DASHBOARD

3.8 Social Media Analysis

3.8.1 SOCIAL MEDIA ANALYTICS DASHBOARD

CHAPTER 04 Smart Cities Regional Status & Key Case Studies

4.1 Americas

4.1.1 KEY SMART CITY CHALLENGES & OPPORTUNITIES IN THE AMERICAS

4.1.2 EXAMPLES OF SMART CITY PROJECTS IN THE AMERICAS

4.1.3 CASE STUDY – KINGSTON SMART CITY

4.1.3.1 The Role of Telcos in Kingston Smart City

4.1.4 CASE STUDY – SANTA RITA DO SAPUCAÍ SMART CITY

4.1.4.1 The Role of Telcos in Santa Rita do Sapucaí Smart City

4.2 Europe

4.3 Asia Pacific

4.4 Middle East & Africa

CHAPTER 05 Global Smart Cities Revenue Opportunity

5.1 Global Market Revenue Snapshot

5.2 Global Smart Cities Market By Application

5.2.1 GLOBAL SMART CITIES MARKET BY SMART TRANSPORTATION

5.2.2 GLOBAL SMART CITIES MARKET BY SMART INFRASTRUCTURE

CHAPTER 06 Smart Cities Regional Outlook

6.1 Smart Cities – Regional Deep Dive

6.2 North America Smart Cities Market Snapshot

6.2.1 NORTH AMERICA SMART CITIES MARKET BY APPLICATION

6.2.1.1 North America Smart Cities Market By Smart Transportation

6.2.1.2 North America Smart Cities Market By Smart Infrastructure

6.2.2 US SMART CITIES MARKET

6.2.2.1 US Smart Cities Market By Application

6.2.2.2 US Smart Cities Market By Application

6.2.2.2.1 US Smart Cities Market By Smart Transportation

6.2.2.2.2 US SMART Cities Market By Smart Infrastructure

6.2.3 CANADA SMART CITIES MARKET

6.2.3.1 Canada Smart Cities Market By Application

6.2.3.2 Canada Smart Cities Market By Application

6.2.3.2.1 Canada Smart Cities Market By Smart Transportation

6.2.3.2.2 Canada Smart Cities Market By Smart Infrastructure

6.3 Europe Smart Cities Market Size and Forecasts, 2019-2026 ($Bn)

6.3.1 EUROPE SMART CITIES MARKET BY APPLICATION ($BN)

6.3.1.1 Europe Smart Cities By Smart Transportation ($Bn)

6.3.1.2 Europe Smart Cities By Smart Infrastructure ($Bn)

6.3.2 UK SMART CITIES MARKET

6.3.2.1 UK Smart Cities Market By Application ($Bn)

6.3.2.1.1 UK Smart Cities Market By Smart Transportation ($Bn)

6.3.2.1.2 UK Smart Cities Market By Smart Infrastructure ($Bn)

6.3.3 GERMANY SMART CITIES MARKET

6.3.3.1 Germany Smart Cities Market By Application ($Bn)

6.3.3.1.1 Germany Smart Cities Market By Smart Transportation ($Bn)

6.3.3.1.2 Germany Smart Cities Market By Smart Infrastructure ($Bn)

6.3.4 FRANCE SMART CITIES MARKET

6.3.4.1 France Smart Cities Market By Application ($Bn)

6.3.4.1.1 France Smart Cities Market By Smart Transportation ($Bn)

6.3.4.1.2 France Smart Cities Market By Smart Infrastructure ($Bn)

6.3.5 SPAIN SMART CITIES MARKET

6.3.5.1 Spain Smart Cities Market By Application ($Bn)

6.3.5.1.1 Spain Smart Cities Market By Smart Transportation ($Bn)

6.3.5.1.2 Spain Smart Cities Market By Smart Infrastructure ($Bn)

6.3.6 ITALY SMART CITIES MARKET

6.3.6.1 Italy Smart Cities Market By Application ($Bn)

6.3.6.1.1 Italy Smart Cities Market By Smart Transportation ($Bn)

6.3.6.1.2 Italy Smart Cities Market By Smart Infrastructure ($Bn)

6.3.7 REST OF EUROPE SMART CITIES MARKET

6.3.7.1 Rest of Europe Smart Cities Market By Application ($Bn)

6.3.7.1.1 Rest of Europe K Smart Cities Market By Smart Transportation ($Bn)

6.3.7.1.2 Rest of Europe Smart Cities Market By Smart Infrastructure ($Bn)

6.4 South & Central America Smart Cities Market Size and Forecasts, 2019-2026 ($Bn)

6.4.1 SOUTH & CENTRAL AMERICA SMART CITIES MARKET BY APPLICATION ($BN)

6.4.1.1 South & Central America Smart Cities By Smart Transportation ($Bn)

6.4.1.2 South & Central America Smart Cities By Smart Infrastructure ($Bn)

6.4.2 BRAZIL SMART CITIES MARKET

6.4.2.1 Brazil Smart Cities Market By Application ($Bn)

6.4.2.1.1 Brazil Smart Cities Market By Smart Transportation ($Bn)

6.4.2.1.2 Brazil Smart Cities Market By Smart Infrastructure ($Bn)

6.4.3 MEXICO SMART CITIES MARKET

6.4.3.1 Mexico Smart Cities Market By Application ($Bn)

6.4.3.1.1 Mexico Smart Cities Market By Smart Transportation ($Bn)

6.4.3.1.2 Mexico Smart Cities Market By Smart Infrastructure ($Bn)

6.4.4 COLOMBIA SMART CITIES MARKET

6.4.4.1 Colombia Smart Cities Market By Application ($Bn)

6.4.4.1.1 Colombia Smart Cities Market By Smart Transportation ($Bn)

6.4.4.1.2 Colombia Smart Cities Market By Smart Infrastructure ($Bn)

6.4.5 REST OF SOUTH & CENTRAL AMERICA SMART CITIES MARKET

6.4.5.1 Rest of South & Central America Smart Cities Market By Application ($Bn)

6.4.5.1.1 Rest of South & Central America Smart Cities Market By Smart Transportation ($Bn)

6.4.5.1.2 Rest of South & Central America Smart Cities Market By Smart Infrastructure ($Bn)

6.5 Asia Pacific Smart Cities Market Size and Forecasts, 2019-2026 ($Bn)

6.5.1 ASIA PACIFIC SMART CITIES MARKET BY APPLICATION ($BN)

6.5.1.1 Asia Pacific Smart Cities By Smart Transportation ($Bn)

6.5.1.2 Asia Pacific Smart Cities By Smart Infrastructure ($Bn)

6.5.2 CHINA SMART CITIES MARKET

6.5.2.1 China Smart Cities Market By Application ($Bn)

6.5.2.1.1 China Smart Cities Market By Smart Transportation ($Bn)

6.5.2.1.2 China Smart Cities Market By Smart Infrastructure ($Bn)

6.5.3 INDIA SMART CITIES MARKET

6.5.3.1 India Smart Cities Market By Application ($Bn)

6.5.3.1.1 India Smart Cities Market By Smart Transportation ($Bn)

6.5.3.1.2 India Smart Cities Market By Smart Infrastructure ($Bn)

6.5.4 JAPAN SMART CITIES MARKET

6.5.4.1 Japan Smart Cities Market By Application ($Bn)

6.5.4.1.1 Japan Smart Cities Market By Smart Transportation ($Bn)

6.5.4.1.2 Japan Smart Cities Market By Smart Infrastructure ($Bn)

6.5.5 AUSTRALIA SMART CITIES MARKET

6.5.5.1 Australia Smart Cities Market By Application ($Bn)

6.5.5.1.1 Australia Smart Cities Market By Smart Transportation ($Bn)

6.5.5.1.2 Australia Smart Cities Market By Smart Infrastructure ($Bn)

6.5.6 REST OF ASIA PACIFIC SMART CITIES MARKET

6.5.6.1 Rest of Asia Pacific Smart Cities Market By Application ($Bn)

6.5.6.1.1 Rest of Asia Pacific Smart Cities Market By Smart Transportation ($Bn)

6.5.6.1.2 Rest of Asia Pacific Smart Cities Market By Smart Infrastructure ($Bn)

6.6 Middle East & Africa Smart Cities Market Size and Forecasts, 2019-2026 ($Bn)

6.6.1 MIDDLE EAST & AFRICA SMART CITIES MARKET BY APPLICATION ($BN)

6.6.1.1 Middle East & Africa Smart Cities By Smart Transportation ($Bn)

6.6.1.2 Middle East & Africa Smart Cities By Smart Infrastructure ($Bn)

6.6.2 SAUDI ARABIA SMART CITIES MARKET

6.6.2.1 Saudi Arabia Smart Cities Market By Application ($Bn)

6.6.2.1.1 Saudi Arabia Smart Cities Market By Smart Transportation ($Bn)

6.6.2.1.2 Saudi Arabia Smart Cities Market By Smart Infrastructure ($Bn)

6.6.3 UAE SMART CITIES MARKET

6.6.3.1 UAE Smart Cities Market By Application ($Bn)

6.6.3.1.1 UAE Smart Cities Market By Smart Transportation ($Bn)

6.6.3.1.2 UAE Smart Cities Market By Smart Infrastructure ($Bn)

6.6.4 SOUTH AFRICA SMART CITIES MARKET

6.6.4.1 South Africa Smart Cities Market By Application ($Bn)

6.6.4.1.1 South Africa Smart Cities Market By Smart Transportation ($Bn)

6.6.4.1.2 South Africa Smart Cities Market By Smart Infrastructure ($Bn)

6.6.5 REST OF MIDDLE EAST & AFRICA SMART CITIES MARKET

6.6.5.1 Rest of Middle East & Africa Smart Cities Market By Application ($Bn)

6.6.5.1.1 Rest of Middle East & Africa Smart Cities Market By Smart Transportation ($Bn)

6.6.5.1.2 Rest of Middle East & Africa Smart Cities Market By Smart Infrastructure ($Bn)

CHAPTER 07 Global Smart Cities Competitive Landscape

7.1 Smart Cities Vendor Snapshot

7.2 Smart Cities Competitive Analysis

7.2.1 COMPANY SNAPSHOT: MICROSOFT CORP

7.2.1.1 Company Overview and Financial Performance

7.2.1.2 Recent Developments

7.2.2 HIKVISION DIGITAL TECHNOLOGY CO LTD

7.2.2.1 Company Overview and Financial Performance

7.2.2.2 Recent Developments and Innovation

7.2.3 HITACHI LTD

7.2.3.1 Company Overview and Financial Performance

7.2.3.2 Recent Developments and Innovation

7.2.4 HONEYWELL INTERNATIONAL PLC

7.2.4.1 Company Overview and Financial Performance

7.2.4.2 Recent Developments and Innovation

7.2.5 ALIBABA GROUP HOLDING LTD

7.2.5.1 Company Overview and Financial Performance

7.2.5.2 Recent Developments and Innovation

7.2.6 CISCO SYSTEMS INC

7.2.6.1 Company Overview and Financial Performance

7.2.6.2 Recent Developments and Innovation

7.2.7 INTERNATIONAL BUSINESS MACHINES CORP (IBM)

7.2.7.1 Company Overview and Financial Performance

7.2.7.2 Recent Developments and Innovation

7.2.8 HUAWEI TECHNOLOGIES CO. LTD

7.2.8.1 Company Overview and Financial Performance

7.2.8.2 Recent Developments and Innovation

7.2.9 IFLYTEK CO LTD

7.2.9.1 Company Overview and Financial Performance

7.2.9.2 Recent Developments and Innovation

7.2.10 JOHNSON CONTROLS

7.2.10.1 Company Overview and Financial Performance

7.2.10.2 Recent Developments and Innovation

7.2.11 NOKIA CORP

7.2.11.1 Company Overview and Financial Performance

7.2.11.2 Recent Developments and Innovation

7.2.12 SCHNEIDER ELECTRIC SE

7.2.12.1 Company Overview and Financial Performance

7.2.12.2 Recent Developments and Innovation

7.2.13 ZTE CORP

7.2.13.1 Company Overview and Financial Performance

7.2.13.2 Recent Developments and Innovation

CHAPTER 08 Methodology and Scope

8.1 Information Procurement

8.2 Smart Cities Analysis

8.3 Market Opportunity Forecast – Research Methodology & Formulation

8.4 Competitive Index – Research Methodology & Formulation

8.5 Additional Resources

8.5.1 MARKET DEFINITIONS – APPLICATION SEGMENTS

Contact Us 

Table

Table 1 Key Trends Overview

Table 2 Smart City Challenges & Opportunities in the Americas

Table 3 Examples of Smart Cities Projects in the Americas

Table 4 Smart City Challenges & Opportunities in Europe

Table 5 Examples of Smart Cities Projects in Europe

Table 6 Smart City Challenges & Opportunities in Asia Pacific

Table 7 Examples of Smart Cities Projects in Asia Pacific

Table 8 Smart City Challenges & Opportunities in Middle East & Africa

Table 9 Examples of Smart Cities Projects in Middle East & Africa

Table 10 Global Smart Cities Market By Application, 2019 – 2026 ($Bn) 58

Table 11 Global Smart Cities Market By Smart Transportation, 2019 – 2026 ($Bn)

Table 12 Global Smart Cities Market By Smart Infrastructure, 2019 – 2026 ($Bn) 60

Table 1 Global Smart Cities Market By Region, 2019 – 2026 ($Bn)

Table 2 North America Smart Cities Market By Application, 2019 – 2026 ($Bn)

Table 3 North America Smart Cities Market By Smart Transportation, 2019 – 2026 ($Bn)

Table 4 North America Smart Cities Market By Smart Infrastructure, 2019 – 2026 ($Bn)

Table 5 US Smart Cities Market By Application, 2019 – 2026 ($Bn)

Table 6 US Smart Cities Market By Smart Transportation, 2019 – 2026 ($Bn)

Table 7 US Smart Cities Market By Smart Infrastructure, 2019 – 2026 ($Bn)

Table 8 Canada Smart Cities Market By Application, 2019 – 2026 ($Bn)

Table 9 Canada Smart Cities Market By Smart Transportation, 2019 – 2026 ($Bn)

Table 10 Canada Smart Cities Market By Smart Infrastructure, 2019 – 2026 ($Bn)

Table 11 Europe Smart Cities Market By Application, 2019 – 2026 ($Bn)

Table 12 Europe Smart Cities Market By Smart Transportation, 2019 – 2026 ($Bn)

Table 13 Europe Smart Cities Market By Smart Infrastructure, 2019 – 2026 ($Bn)

Table 14 UK Smart Cities Market By Application, 2019 – 2026 ($Bn)

Table 15 UK Smart Cities Market By Smart Transportation, 2019 – 2026 ($Bn)

Table 16 UK Smart Cities Market By Smart Infrastructure, 2019 – 2026 ($Bn)

Table 17 Germany Smart Cities Market By Application, 2019 – 2026 ($Bn)

Table 18 Germany Smart Cities Market By Smart Transportation, 2019 – 2026 ($Bn)

Table 19 Germany Smart Cities Market By Smart Infrastructure, 2019 – 2026 ($Bn)

Table 20 France Smart Cities Market By Application, 2019 – 2026 ($Bn)

Table 21 France Smart Cities Market By Smart Transportation, 2019 – 2026 ($Bn)

Table 22 France Smart Cities Market By Smart Infrastructure, 2019 – 2026 ($Bn)

Table 23 Spain Smart Cities Market By Application, 2019 – 2026 ($Bn)

Table 24 Spain Smart Cities Market By Smart Transportation, 2019 – 2026 ($Bn)

Table 25 Spain Smart Cities Market By Smart Infrastructure, 2019 – 2026 ($Bn)

Table 26 Italy Smart Cities Market By Application, 2019 – 2026 ($Bn)

Table 27 Italy Smart Cities Market By Smart Transportation, 2019 – 2026 ($Bn)

Table 28 Italy Smart Cities Market By Smart Infrastructure, 2019 – 2026 ($Bn)

Table 29 Rest of Europe Smart Cities Market By Application, 2019 – 2026 ($Bn)

Table 30 Rest of Europe Smart Cities Market By Smart Transportation, 2019 – 2026 ($Bn)

Table 31 Rest of Europe Smart Cities Market By Smart Infrastructure, 2019 – 2026 ($Bn)

Table 32 South & Central America Smart Cities Market By Application, 2019 – 2026 ($Bn)

Table 33 South & Central America Smart Cities Market By Smart Transportation, 2019 – 2026 ($Bn)

Table 34 South & Central America Smart Cities Market By Smart Infrastructure, 2019 – 2026 ($Bn)

Table 35 Brazil Smart Cities Market By Application, 2019 – 2026 ($Bn)

Table 36 Brazil Smart Cities Market By Smart Transportation, 2019 – 2026 ($Bn)

Table 37 Brazil Smart Cities Market By Smart Infrastructure, 2019 – 2026 ($Bn)

Table 38 Mexico Smart Cities Market By Application, 2019 – 2026 ($Bn)

Table 39 Mexico Smart Cities Market By Smart Transportation, 2019 – 2026 ($Bn)

Table 40 Mexico Smart Cities Market By Smart Infrastructure, 2019 – 2026 ($Bn)

Table 41 Colombia Smart Cities Market By Application, 2019 – 2026 ($Bn)

Table 42 Colombia Smart Cities Market By Smart Transportation, 2019 – 2026 ($Bn)

Table 43 Colombia Smart Cities Market By Smart Infrastructure, 2019 – 2026 ($Bn)

Table 44 Rest of South & Central America Smart Cities Market By Application, 2019 – 2026 s($Bn)

Table 45 Rest of South & Central America Smart Cities Market By Smart Transportation, 2019 – 2026 ($Bn)

Table 46 Rest of South & Central America Smart Cities Market By Smart Infrastructure, 2019 – 2026 ($Bn)

Table 47 Asia Pacific Smart Cities Market By Application, 2019 – 2026 ($Bn)

Table 48 Asia Pacific Smart Cities Market By Smart Transportation, 2019 – 2026 ($Bn)

Table 49 Asia Pacific Smart Cities Market By Smart Infrastructure, 2019 – 2026 ($Bn)

Table 50 China Smart Cities Market By Application, 2019 – 2026 ($Bn)

Table 51 China Smart Cities Market By Smart Transportation, 2019 – 2026 ($Bn)

Table 52 China Smart Cities Market By Smart Infrastructure, 2019 – 2026 ($Bn)

Table 53 India Smart Cities Market By Application, 2019 – 2026 ($Bn)

Table 54 India Smart Cities Market By Smart Transportation, 2019 – 2026 ($Bn)

Table 55 India Smart Cities Market By Smart Infrastructure, 2019 – 2026 ($Bn)

Table 56 Japan Smart Cities Market By Application, 2019 – 2026 ($Bn)

Table 57 Japan Smart Cities Market By Smart Transportation, 2019 – 2026 ($Bn)

Table 58 Japan Smart Cities Market By Smart Infrastructure, 2019 – 2026 ($Bn)

Table 59 Australia Smart Cities Market By Application, 2019 – 2026 ($Bn)

Table 60 Australia Smart Cities Market By Smart Transportation, 2019 – 2026 ($Bn)

Table 61 Australia Smart Cities Market By Smart Infrastructure, 2019 – 2026 ($Bn)

Table 62 Rest of Asia Pacific Smart Cities Market By Application, 2019 – 2026 ($Bn)

Table 63 Rest of Asia Pacific Smart Cities Market By Smart Transportation, 2019 – 2026 ($Bn)

Table 64 Rest of Asia Pacific Smart Cities Market By Smart Infrastructure, 2019 – 2026 ($Bn)

Table 65 Middle East & Africa Smart Cities Market By Application, 2019 – 2026 ($Bn)

Table 66 Middle East & Africa Smart Cities Market By Smart Transportation, 2019 – 2026 ($Bn)

Table 67 Middle East & Africa Smart Cities Market By Smart Infrastructure, 2019 – 2026 ($Bn)

Table 68 Saudi Arabia Smart Cities Market By Application, 2019 – 2026 ($Bn)

Table 69 Saudi Arabia Smart Cities Market By Smart Transportation, 2019 – 2026 ($Bn)

Table 70 Saudi Arabia Smart Cities Market By Smart Infrastructure, 2019 – 2026 ($Bn)

Table 71 UAE Smart Cities Market By Application, 2019 – 2026 ($Bn)

Table 72 UAE Smart Cities Market By Smart Transportation, 2019 – 2026 ($Bn)

Table 73 UAE Smart Cities Market By Smart Infrastructure, 2019 – 2026 ($Bn)

Table 74 South Africa Smart Cities Market By Application, 2019 – 2026 ($Bn)

Table 75 South Africa Smart Cities Market By Smart Transportation, 2019 – 2026 ($Bn)

Table 76 South Africa Smart Cities Market By Smart Infrastructure, 2019 – 2026 ($Bn)

Table 77 Rest of Middle East & Africa Smart Cities Market By Application, 2019 – 2026 ($Bn)

Table 78 Rest of Middle East & Africa Smart Cities Market By Smart Transportation, 2019 – 2026 ($Bn)

Table 79 Rest of Middle East & Africa Smart Cities Market By Smart Infrastructure, 2019 – 2026 ($Bn)

Figures

Fig.1 Smart Cities Market Snapshot

Fig.2 Smart Cities Market Segmentation

Fig.3 Smart Cities Industry Value Chain Analysis

Fig.4 The Smart City Value Chain: Smart City Platforms

Fig.5 Smart City Value Chain: Smart Buildings

Fig.6 The Smart Cities Value Chain: Smart Transportation

Fig.7 The Smart Cities Value Chain: Smart Infrastructure

Fig.8 The Smart Cities Value Chain: Smart Grid

Fig.9 The Smart Cities Value Chain: Smart City Services

Fig.10 Global Smart Cities PORTER’s Five Force Analysis

Fig.11 Smart Cities Market – Key Drivers Impact Analysis

Fig.12 Urban Vs Rural Population – 2021-2030

Fig.13 Smart Cities– Key Market Challenges/Impediments Impact Analysis

Fig.14 Impact of Pandemic on Economics of the Cities

Fig.15 Smart Cities– M&A Activity Dashboard

Fig.16 Smart Cities– Patent Activity Dashboard

Fig.17 Smart Cities– Job Analytics Dashboard

Fig.18 Smart Cities– Venture Financing Dashboard

Fig.19 Smart Cities– Social Media Analytics Dashboard

Fig.20 Global Smart Cities Market – Revenue Opportunity Forecast, 2019-2026 (US$ Billion)

Fig.21 Global Smart Cities Market By Application, 2019 2026 (US$ Billion)

Fig.22 Global Smart Cities Market By Smart Transportation, 2019 & 2026 (US$ Billion)

Fig.23 Global Smart Cities Market By Smart Infrastructure, 2019 & 2026 (US$ Billion)

Fig.24 Smart Cities– Market Overview

Fig.25 North America Smart Cities Market Snapshot

Fig.26 US Smart Cities By Application – 2021 & 2026 (US$B)

Fig.27 Canada Smart Cities By Application – 2021 & 2026 (US$B) 66

Fig.28 Europe Smart Cities Market Snapshot

Fig.29 UK Smart Cities By Application – 2021 & 2026 (US$B)

Fig.30 Germany Smart Cities By Application – 2021 & 2026 (US$B)

Fig.31 France Smart Cities By Application – 2021 & 2026 (US$B)

Fig.32 Spain Smart Cities By Application – 2021 & 2026 (US$B)

Fig.33 Italy Smart Cities By Application – 2021 & 2026 (US$B)

Fig.34 Rest of Europe Smart Cities By Application – 2021 & 2026 (US$B)

Fig.35 South & Central America Smart Cities Market Snapshot

Fig.36 Brazil Smart Cities By Application – 2021 & 2026 (US$B)

Fig.37 Mexico Smart Cities By Application – 2021 & 2026 (US$B)

Fig.38 Colombia Smart Cities By Application – 2021 & 2026 (US$B)

Fig.39 Rest of South & Central America Smart Cities By Application – 2021 & 2026 (US$B)

Fig.40 Asia Pacific Smart Cities Market Snapshot

Fig.41 China Smart Cities By Application – 2021 & 2026 (US$B)

Fig.42 India Smart Cities By Application – 2021 & 2026 (US$B)

Fig.43 Japan Smart Cities By Application – 2021 & 2026 (US$B)

Fig.44 Australia Smart Cities By Application – 2021 & 2026 (US$B)

Fig.45 Rest of Asia Pacific Smart Cities By Application – 2021 & 2026 (US$B)

Fig.46 Middle East & Africa Smart Cities Market Snapshot

Fig.47 Saudi Arabia Smart Cities By Application – 2021 & 2026 (US$B)

Fig.48 UAE Smart Cities By Application – 2021 & 2026 (US$B)

Fig.49 South Africa Smart Cities By Application – 2021 & 2026 (US$B)

Fig.50 Rest of Middle East & Africa Smart Cities By Application – 2021 & 2026 (US$B)

Fig.51 Smart Cities – Growth-Innovation Matrix

Fig.52 Information Procurement

Fig.53 Data Analysis

Fig.54 Research Workflow

Fig.55 Research Methodology

Fig.56 Market Definitions

Frequently asked questions

  • What was the smart cities market size in 2023?

    The smart cities market size will be valued at $581.89 billion in 2023.

  • What will be the smart cities market size in 2026?

    The smart cities market size is expected to reach US$ 744.1 billion by 2026.

  • What is the smart cities market growth rate?

    The smart cities market is expected to grow at a CAGR of 8.1% during the forecast period (2022-2026).

  • What are the key smart cities market drivers?

    The inclination of population to migrate to cities is one of the primary reasons for the world becoming increasingly urban. Cities cover only 2% of the Earth’s surface but account for 50% of its population, which has fueled the growth of smart cities.

  • What are the key smart cities market segments?

    Application: Smart Transportation, Smart Infrastructure, Smart Grid, Smart Building, and Smart City Platform

    Smart Transportation: Intelligent Transportation, Parking Management, and Smart Ticketing.

    Smart Infrastructure: City Surveillance, Smart Lighting, and Command & Control Systems

  • Which are the leading smart cities companies?

    The leading smart cities companies are Microsoft Corp, Accenture, IBM, Hitachi, Honeywell, Alibaba Group, Huawei Technologies Co. Ltd., and Hikvision, among others.

  • Is there a third level of segmentation in the report?

    GlobalData’s focus is on providing reliable and accurate data that is supported by robust research methodology. Our reports undergo rigorous quality checks and are based on primary and secondary research sources, ensuring that the numbers and insights provided are trustworthy.  However, despite the best efforts to gather comprehensive data, there could be instances where the available data is limited, making it challenging to provide third level segmentation. In such cases, GlobalData may choose to provide high-level insights and general trends rather than forcing segmentation that may not be backed by sufficient data. This approach ensures that the report’s overall quality and credibility are maintained.

Currency USD
$3,950

Can be used by individual purchaser only

$7,950

Can be shared globally by unlimited users within the purchasing corporation e.g. all employees of a single company


Undecided about purchasing this report?

Enquire Before Buying Request a Free Sample

Get in touch to find out about multi-purchase discounts

reportstore@globaldata.com
Tel +44 20 7947 2745

Every customer’s requirement is unique. With over 220,000 construction projects tracked, we can create a tailored dataset for you based on the types of projects you are looking for. Please get in touch with your specific requirements and we can send you a quote.

Sample Report

We are confident about Smart Cities Market Size, Share, Trends, Analysis and Forecast by Region, Application, Infrastructure, Grid and Segment Forecast to 2026 report's unique quality. However, we want you to make the most beneficial decision for your business, so we offer free sample pages to help you:

  • Assess the relevance of the report
  • Evaluate the quality of the report
  • Justify the cost

Download your copy of the sample report and make an informed decision about whether the full report will provide you with the insights and information you need.

Below is a sample report to understand what you are buying

See what our customers are saying

“The GlobalData platform is our go-to tool for intelligence services. GlobalData provides an easy way to access comprehensive intelligence data around multiple sectors, which essentially makes it a one-for-all intelligence platform, for tendering and approaching customers.

GlobalData is very customer orientated, with a high degree of personalised services, which benefits everyday use. The highly detailed project intelligence and forecast reports can be utilised across multiple departments and workflow scopes, from operational to strategic level, and often support strategic decisions. GlobalData Analytics and visualisation solutions has contributed positively when preparing management presentations and strategic papers.”

Business Intelligence & Marketing Manager, SAL Heavy Lift

“COVID-19 has caused significant interference to our business and the COVID-19 intelligence from GlobalData has helped us reach better decisions around strategy. These two highlights have helped enormously to understand the projections into the future concerning our business units, we also utilise the project database to source new projects for Liebherr-Werk to use as an additional source to pitch for new business.”

Market Analyst & Management, Liebherr-Werk

Your daily news has saved me a lot of time and keeps me up-to-date with what is happening in the market, I like that you almost always have a link to the source origin. We also use your market data in our Strategic Business Process to support our business decisions. By having everything in one place on the Intelligence Center it has saved me a lot of time versus looking on different sources, the alert function also helps with this.

Head of Key Accounts, Saab AB

Having used several other market research companies, I find that GlobalData manages to provide that ‘difficult-to-get’ market data that others can’t, as well as very diverse and complete consumer surveys.

Marketing Intelligence Manager, Portugal Foods

Our experience with GlobalData has been very good, from the platform itself to the people. I find that the analysts and the account team have a high level of customer focus and responsiveness and therefore I can always rely on. The platform is more holistic than other providers. It is convenient and almost like a one stop shop. The pricing suite is highly competitive and value for our organisation.

I like reports that inform new segments such as the analysis on generation Z, millennials, the impact of COVID 19 to our banking customers and their new channel habits. Secondly the specialist insight on affluent sector significantly increases our understanding about this group of customers. The combination of those give us depth and breadth of the evolving market.

I’m in the business of answering and helping people make decisions so with the intelligence center I can do that, effectively and efficiently. I can share quickly key insights that answer and satisfy our country stakeholders by giving them many quality studies and primary research about competitive landscape beyond the outlook of our bank. It helps me be seen as an advisory partner and that makes a big difference. A big benefit of our subscription is that no one holds the whole data and because it allows so many people, so many different parts of our organisation have access, it enables all teams to have the same level of knowledge and decision support.

Head of Customer Insight and Research, Standard Chartered

“I know that I can always rely on Globaldata’s work when I’m searching for the right consumer and market insights. I use Globaldata insights to understand the changing market & consumer landscape and help create better taste & wellbeing solutions for our customers in food, beverage and healthcare industries.

Globaldata has the right data and the reports are of very high quality compared to your competitors. Globaldata not only has overall market sizes & consumer insights on food & beverages but also provides insights at the ingredient & flavour level. That is key for B2B companies like Givaudan. This way we understand our customers’ business and also gain insight to our unique industry”

Head of Consumer Sensory Insights, Givaudan

GlobalData provides a great range of information and reports on various sectors that is highly relevant, timely, easy to access and utilise.  The reports and data dashboards help engagement with clients; they provide valuable industry and market insights that can enrich client conversations and can help in the shaping of value propositions. Moreover, using GlobalData products has helped increase my knowledge of the finance sector, the players within it, and the general threats and opportunities.

I find the consumer surveys that are carried out to be extremely beneficial and not something I have seen anywhere else. They provided an insightful view of why and which consumers take (or don’t) particular financial products. This can help shape conversations with clients to ensure they make the right strategic decisions for their business.

One of the challenges I have found is that data in the payments space is often piecemeal. With GD all of the data I need is in one place, but it also comes with additional market reports that provide useful extra context and information. Having the ability to set-up alerts on relevant movements in the industry, be it competitors or customers, and have them emailed directly to me, ensures I get early sight of industry activity and don’t have to search for news.

Senior Account Manager, TSYS
Go even deeper with GlobalData Intelligence Center

Every Company Report we produce is powered by the GlobalData Intelligence Center.

Subscribing to our intelligence platform means you can monitor developments at Smart Cities Market Size, Share, Trends, Analysis and Forecast by Region, Application, Infrastructure, Grid and Segment Forecast to 2026 in real time.

  • Access a live Smart Cities Market Size, Share, Trends, Analysis and Forecast by Region, Application, Infrastructure, Grid and Segment Forecast to 2026 dashboard for 12 months, with up-to-the-minute insights.
  • Fuel your decision making with real-time deal coverage and media activity.
  • Turn insights on financials, deals, products and pipelines into powerful agents of commercial advantage.