Surface Mining Equipment Market Analysis by Region, Population, Commodity and Forecast to 2030

Powered by

All the vital news, analysis, and commentary curated by our industry experts.

Explore the following trends and analysis from our ‘Surface Mining Equipment’ market report:

  • Understand the breakdown of equipment counts by region (Asia Pacific, Australasia, Europe, Former Soviet Union, Middle East & Africa, North America, and South & Central America).
  • Analyze the major mining countries such as Australia, Canada, Chile, China, India, Indonesia, Peru, Russia, South Africa, and the US.
  • Assess the total population by commodity to set smart business goals.
  • Learn the market shares of the leading OEMs by type of machine and region.

How is our ‘Surface Mining Equipment’ report unique from other reports in the market?

  • Assess the current population of each major type of equipment by country, region, and key commodity (coal, iron ore, gold, and copper) to get a better understanding of the market.
  • Predict counts of each machine through to 2030.
  • Analyze the key OEMs in each segment and region.
  • View counts of trucks by payload, as well as by numbers of autonomous and electric vehicles.

We recommend this valuable source of information to anyone involved in: 

  • Mining Companies
  • Heavy Industry /Automobiles Companies and Manufacturers
  • Primes/OEMs/Mining Technology Enterprises
  • Technology Leaders and Startups
  • Business Development and Market Intelligence
  • Investment Analysts and Portfolio Managers
  • Professional Services – Investment Banks, PE/VC firms
  • M&A/Investment, Management Consultants, and Consulting Firms

To Get a Snapshot of the Surface Mining Equipment Market Report

Download a Free Report Sample

Surface Mining Equipment Market Report Overview

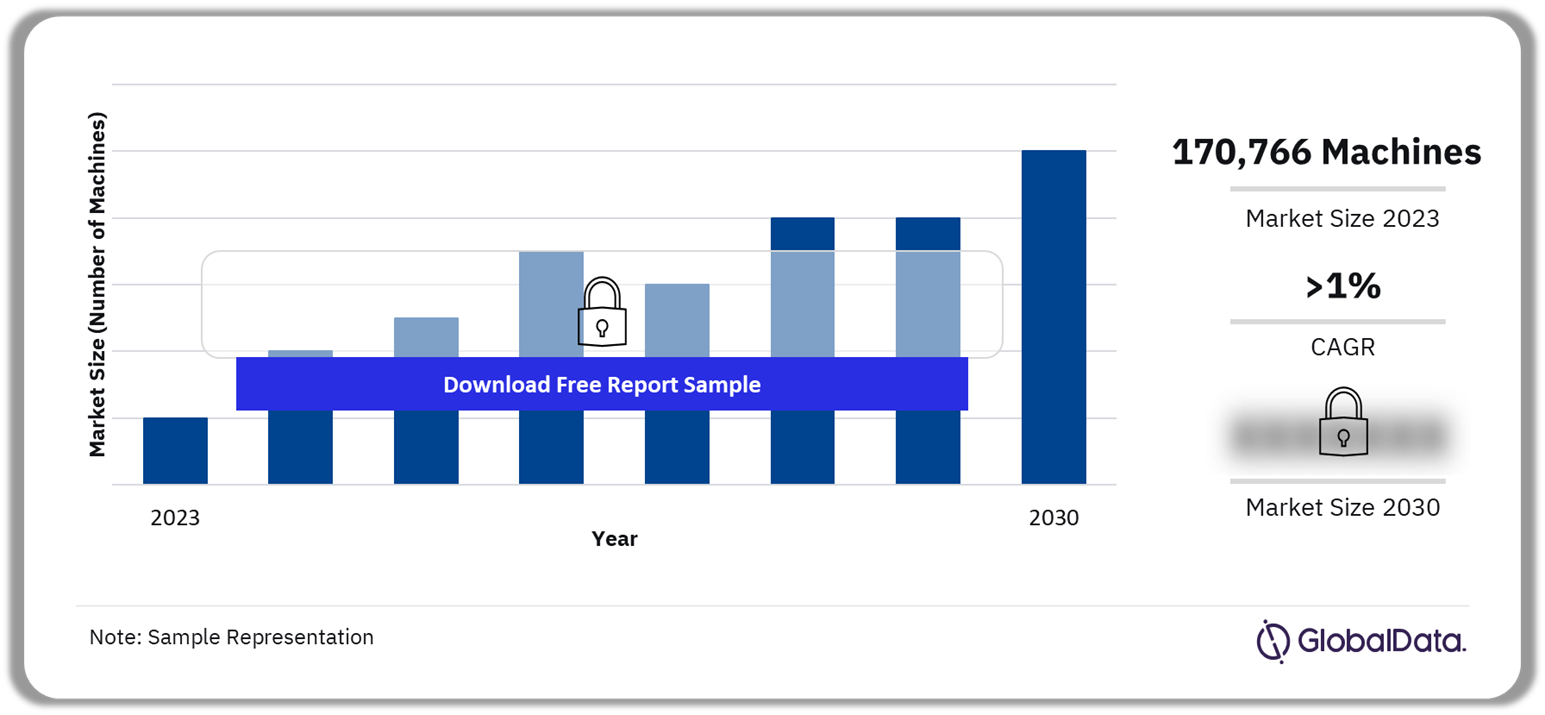
The total number of surface mining equipment was estimated at 170,766 in 2023. The surface mining equipment market is expected to grow at a CAGR of more than 1% from 2023 to 2030. Miners are seeking improved productivity and minimized emissions, which has increased the number of autonomous haul trucks. Also, the electrification of surface equipment is expected to gain traction in the upcoming years.

Surface Mining Equipment Market Outlook 2023-2030 (Number of Surface Mining Machines)

Surface Mining Equipment Market Outlook 2023-2030 (Number of Surface Mining Machines)

Buy the Full Report to Know More About the Surface Mining Equipment Market Forecast, Download a Free Sample Report

The surface mining equipment market research report provides detailed data and forecasts for different types of major surface mining equipment. The report uses our extensive mine-site research data and equipment models to generate a complete view of equipment counts globally. Furthermore, the report covers the number-wise breakdown of surface mining equipment by major regions, prominent mining countries, and key commodities.

Market Size (2023) 170,766 machines
CAGR (2023-2030) >1%
Key Regions ·        Asia-Pacific

·        Europe & FSU

·        Africa & ME

·        South & Central America

·        North America

·        Oceania

Key Machines ·        Mining Trucks

·        Hydraulic Excavators/Shovels

·        Electric Rope Shovels

·        Wheel Loaders

·        Dozers

·        Motor Graders

Leading OEMs ·        Caterpillar

·        Komatsu

·        Volvo

·        BEML

·        Hitachi

Enquire & Decide Discover the perfect solution for your business needs. Enquire now and let us help you make an informed decision before making a purchase.

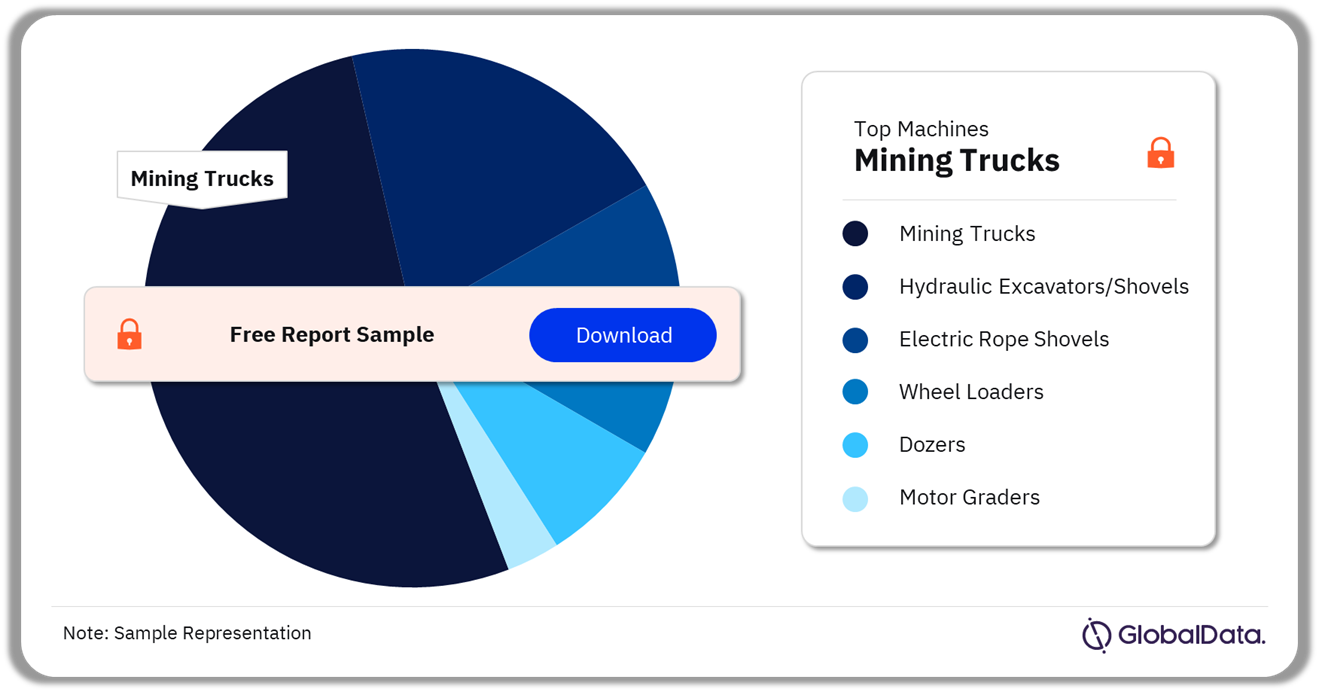
Surface Mining Equipment Market Segmentation by Machines

The key machines in the surface mining equipment market are mining trucks, hydraulic excavators/shovels, electric rope shovels, wheel loaders, dozers, and motor graders. In 2023, mining trucks accounted for the largest surface mining equipment market share, followed by dozers, and hydraulic excavators/shovels. The growth of the mining trucks segment can be attributed to the rising popularity of smaller-sized trucks with shorter lifespans. Mining trucks hold the largest share at coal mines, and by country, the largest number of trucks are in India.

Surface Mining Equipment Market Analysis by Machines, 2023 (%)

Surface Mining Equipment Market Analysis by Machines, 2023 (%)

Buy the Full Report for More Machine-Wise Insights in the Surface Mining Equipment Market,
Download the Free Sample Report

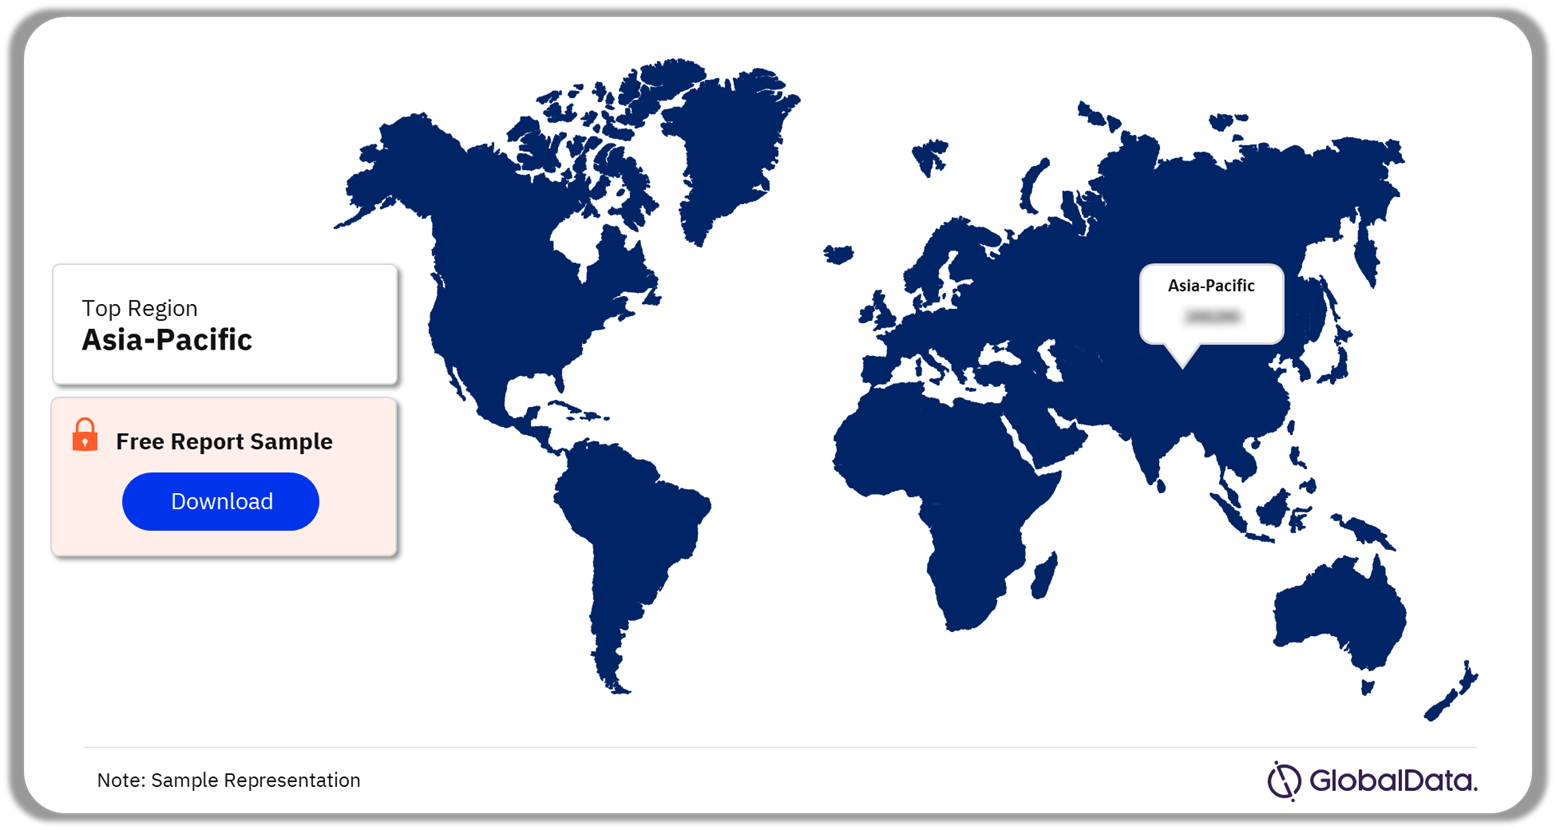
Surface Mining Equipment Market Segmentation by Regions

The key regions in the surface mining equipment market are Asia-Pacific, Europe & FSU, Africa & ME, South & Central America, North America, and Oceania. In 2023, Asia-Pacific accounted for the highest number of surface mining equipment, followed by the Middle East & Africa.

Surface Mining Equipment Market Analysis by Regions, 2023 (%)

Surface Mining Equipment Market Analysis by Regions, 2023 (%)

Buy the Full Report for More Region-Wise Insights in the Surface Mining Equipment Market,
Download the Free Sample Report

Surface Mining Equipment Market – Competitive Landscape

The leading OEMs in the surface mining equipment market are Caterpillar, Komatsu, Volvo, BEML, Hitachi, Belaz, Tata Motors, Scania, Liebherr, and Larsen & Toubro among others. In 2023, Caterpillar was the market leader in most segments. However, Komatsu was the leading provider of electric rope shovels.

Surface Mining Equipment Market Analysis by Leading OEMs, 2023 (%)

Surface Mining Equipment Market Analysis by Leading OEMs, 2023 (%)

Buy the Full Report for More Company-Wise Insights in the Surface Mining Equipment Market,
Download the Free Sample Report

Segments Covered in this Report

Surface Mining Equipment Type Outlook (Number of Machines, 2023)

  • Mining Trucks
  • Hydraulic Excavators/Shovels
  • Electric Rope Shovels
  • Wheel Loaders
  • Dozers
  • Motor Graders

Surface Mining Equipment Regional Outlook (Number of Machines, 2023)

  • Asia-Pacific
  • Europe & FSU
  • Africa & ME
  • South & Central America
  • North America
  • Oceania

Key Highlights

• The total number of trucks, hydraulic excavators, rope shovels, wheel loaders, motor graders and dozers across all operating mines (including those in care and maintenance), excluding quarries, at the end of 2023 was estimated at 170,766. The largest share of machines is in Asia Pacific, at 44%, followed by the Middle East & Africa at 12%. Including only active fleet, this figure was 153,277.

• With steady growth in output, as more mines ramp up and come on stream, the total number of active machines is forecast to rise to 176,543 by 2030, a CAGR of 2.0% from 2023 to 2030. The largest contributor to this growth will be trucks, and particularly the smaller-sized trucks with shorter lifespans.

•Of the total, the largest share is accounted for by trucks at 61%. Of these the most popular payload sizes are in the range of 50-99 metric tonne trucks (36%), with 35% below 50t. Next most numerous are dozers accounting for 14% of machines, ahead of hydraulic excavators/shovels at 11%.

Caterpillar
Komatsu
Liebherr
Volvo
Hitachi
BEML

Table of Contents

1 Executive summary

2 Global surface mining machinery populations by type and region

3 Mining trucks

4 Excavators & hydraulic shovels

5 Electric shovels

6 Loaders

7 Dozers

8 Graders

9 Leading OEMs

10 Methodology

Table

Table 1 Key Trends Overview

Table 2 Global Surface Mining Equipment Market By Type, 2019 – 2026 (Count)

Table 3 Global Surface Mining Equipment Market By Commodity Group, 2019 – 2026 (Count)

Table 4 North America Surface Mining Equipment Market By Type, 2019 – 2026 (Count)

Table 5 North America Surface Mining Equipment Market By Commodity Group, 2019 – 2026 (Count)

Table 6 US Surface Mining Equipment Market By Type, 2019 – 2026 (Count)

Table 7 US Surface Mining Equipment Market By Commodity Group, 2019 – 2026 (Count)

Table 8 Canada Surface Mining Equipment Market By Type, 2019 – 2026 (Count)

Table 9 Canada Surface Mining Equipment Market By Commodity Group, 2019 – 2026 (Count)

Table 10 Europe Surface Mining Equipment Market By Type, 2019 – 2026 (Count)

Table 11 Europe Surface Mining Equipment Market By Commodity Group, 2019 – 2026 (Count)

Table 12 Turkey Surface Mining Equipment Market By Type, 2019 – 2026 (Count)

Table 13 Turkey Surface Mining Equipment Market By Commodity Group, 2019 – 2026 (Count) 85

Table 14 Russia Surface Mining Equipment Market By Type, 2019 – 2026 (Count)

Table 15 Russia Surface Mining Equipment Market By Commodity Group, 2019 – 2026 (Count)

Table 16 Kazakhstan Surface Mining Equipment Market By Type, 2019 – 2026 (Count)

Table 17 Kazakhstan Surface Mining Equipment Market By Commodity Group, 2019 – 2026 (Count)

Table 18 Rest of Europe Surface Mining Equipment Market By Type, 2019 – 2026 (Count)

Table 19 Rest of Europe Surface Mining Equipment Market By Commodity Group, 2019 – 2026 (Count)

Table 20 Asia Pacific Surface Mining Equipment Market By Type, 2019 – 2026 (Count)

Table 21 Asia Pacific Surface Mining Equipment Market By Commodity Group, 2019 – 2026 (Count)

Table 22 China Surface Mining Equipment Market By Type, 2019 – 2026 (Count)

Table 23 China Surface Mining Equipment Market By Commodity Group, 2019 – 2026 (Count)

Table 24 India Surface Mining Equipment Market By Type, 2019 – 2026 (Count)

Table 25 India Surface Mining Equipment Market By Commodity Group, 2019 – 2026 (Count)

Table 26 Indonesia Surface Mining Equipment Market By Type, 2019 – 2026 (Count)

Table 27 Indonesia Surface Mining Equipment Market By Commodity Group, 2019 – 2026 (Count)

Table 28 Australia Surface Mining Equipment Market By Type, 2019 – 2026 (Count)

Table 29 Australia Surface Mining Equipment Market By Commodity Group, 2019 – 2026 (Count)

Table 30 Rest of Asia Pacific Surface Mining Equipment Market By Type, 2019 – 2026 (Count)

Table 31 Rest of Asia Pacific Surface Mining Equipment Market By Commodity Group, 2019 – 2026 (Count)

Table 32 South & Central America Surface Mining Equipment Market By Type, 2019 – 2026 (Count)

Table 33 South & Central America Surface Mining Equipment Market By Commodity Group, 2019 – 2026 (Count)

Table 34 Brazil Surface Mining Equipment Market By Type, 2019 – 2026 (Count)

Table 35 Brazil Surface Mining Equipment Market By Commodity Group, 2019 – 2026 (Count)

Table 36 Chile Surface Mining Equipment Market By Type, 2019 – 2026 (Count)

Table 37 Chile Surface Mining Equipment Market By Commodity Group, 2019 – 2026 (Count)

Table 38 Peru Surface Mining Equipment Market By Type, 2019 – 2026 (Count)

Table 39 Peru Surface Mining Equipment Market By Commodity Group, 2019 – 2026 (Count)

Table 40 Mexico Surface Mining Equipment Market By Type, 2019 – 2026 (Count)

Table 41 Mexico Surface Mining Equipment Market By Commodity Group, 2019 – 2026 (Count)

Table 42 Rest of South & Central America Surface Mining Equipment Market By Type, 2019 – 2026 (Count)

Table 43 Rest of South & Central America Surface Mining Equipment Market By Commodity Group, 2019 – 2026 (Count)

Table 44 Middle East & Africa Surface Mining Equipment Market By Type, 2019 – 2026 (Count)

Table 45 Middle East & Africa Surface Mining Equipment Market By Commodity Group, 2019 – 2026 (Count)

Table 46 South Africa Surface Mining Equipment Market By Type, 2019 – 2026 (Count)

Table 47 South Africa Surface Mining Equipment Market By Commodity Group, 2019 – 2026 (Count)

Table 48 Democratic Republic of Congo Surface Mining Equipment Market By Type, 2019 – 2026 (Count)

Table 49 Democratic Republic of Congo Surface Mining Equipment Market By Commodity Group, 2019 – 2026 (Count)

Table 50 Rest of Middle East & Africa Surface Mining Equipment Market By Type, 2019 – 2026 (Count)

Table 51 Rest of Middle East & Africa Surface Mining Equipment Market By Commodity Group, 2019 – 2026 (Count)

Table 52 Estimated Market Share by OEM Machine Type

Figures

Fig.1 Surface Mining Equipment Market Snapshot

Fig.2 Surface Mining Equipment Market Segmentation

Fig.3 Surface Mining Equipment Industry value chain analysis

Fig.4 Global Surface Mining Equipment PORTER’s Five Force Analysis

Fig.5 Surface Mining Equipment Market – Key Drivers Impact Analysis

Fig.6 Surface Mining Equipment– Key Market Challenges/Impediments Impact Analysis

Fig.7 Global Surface Mining Equipment Market – Volume Opportunity Forecast, 2019-2026 (Count)

Fig.8 Global Surface Mining Equipment Market By Type, 2019-2026 (Count)

Fig.9 Global Surface Mining Equipment Market By Commodity Group, 2019-2026 (Count)

Fig.10 Surface Mining Equipment– Market Overview

Fig.11 North America Surface Mining Equipment Market Snapshot

Fig.12 North America Surface Mining Equipment By Type Share – 2021 & 2026 (%)

Fig.13 North America Surface Mining Equipment Market By Commodity Group Share – 2021 & 2026 (%)

Fig.14 US Surface Mining Equipment Type Share – 2021 & 2026 (%)

Fig.15 US Surface Mining Equipment Commodity Group Share – 2021 & 2026 (%)

Fig.16 Canada Surface Mining Equipment Type Share – 2021 & 2026 (%)

Fig.17 Canada Surface Mining Equipment Commodity Group Share – 2021 & 2026 (%)

Fig.18 Europe Surface Mining Equipment Market Snapshot

Fig.19 Europe Surface Mining Equipment By Type Share – 2021 & 2026 (%)

Fig.20 Europe Surface Mining Equipment Market By Commodity Group Share – 2021 & 2026 (%)

Fig.21 Turkey Surface Mining Equipment Type Share – 2021 & 2026 (%)

Fig.22 Turkey Surface Mining Equipment Commodity Group Share – 2021 & 2026 (%)

Fig.23 Russia Surface Mining Equipment Type Share – 2021 & 2026 (%)

Fig.24 Russia Surface Mining Equipment Commodity Group Share – 2021 & 2026 (%)

Fig.25 Kazakhstan Surface Mining Equipment Type Share – 2021 & 2026 (%)

Fig.26 Kazakhstan Surface Mining Equipment Commodity Group Share – 2021 & 2026 (%)

Fig.27 Rest of Europe Surface Mining Equipment Type Share – 2021 & 2026 (%)

Fig.28 Rest of Europe Surface Mining Equipment Commodity Group Share – 2021 & 2026 (%)

Fig.29 Asia Pacific Surface Mining Equipment Market Snapshot

Fig.30 Asia Pacific Surface Mining Equipment By Type Share – 2021 & 2026 (%)

Fig.31 Asia Pacific Surface Mining Equipment Market By Commodity Group Share – 2021 & 2026 (%)

Fig.32 China Surface Mining Equipment Type Share – 2021 & 2026 (%)

Fig.33 China Surface Mining Equipment Commodity Group Share – 2021 & 2026 (%)

Fig.34 India Surface Mining Equipment Type Share – 2021 & 2026 (%)

Fig.35 India Surface Mining Equipment Commodity Group Share – 2021 & 2026 (%)

Fig.36 Indonesia Surface Mining Equipment Type Share – 2021 & 2026 (%)

Fig.37 Indonesia Surface Mining Equipment Commodity Group Share – 2021 & 2026 (%)

Fig.38 Australia Surface Mining Equipment Type Share – 2021 & 2026 (%)

Fig.39 Australia Surface Mining Equipment Commodity Group Share – 2021 & 2026 (%)

Fig.40 Rest of Asia Pacific Surface Mining Equipment Type Share – 2021 & 2026 (%)

Fig.41 Rest of Asia Pacific Surface Mining Equipment Commodity Group Share – 2021 & 2026 (%)

Fig.42 South & Central America Surface Mining Equipment Market Snapshot

Fig.43 South & Central America Surface Mining Equipment By Type Share – 2021 & 2026 (%)

Fig.44 South & Central America Surface Mining Equipment Market By Commodity Group Share – 2021 & 2026 (%)

Fig.45 Brazil Surface Mining Equipment Type Share – 2021 & 2026 (%)

Fig.46 Brazil Surface Mining Equipment Commodity Group Share – 2021 & 2026 (%)

Fig.47 Chile Surface Mining Equipment Type Share – 2021 & 2026 (%)

Fig.48 Chile Surface Mining Equipment Commodity Group Share – 2021 & 2026 (%)

Fig.49 Peru Surface Mining Equipment Type Share – 2021 & 2026 (%)

Fig.50 Peru Surface Mining Equipment Commodity Group Share – 2021 & 2026 (%)

Fig.51 Mexico Surface Mining Equipment Type Share – 2021 & 2026 (%)

Fig.52 Mexico Surface Mining Equipment Commodity Group Share – 2021 & 2026 (%)

Fig.53 Rest of South & Central America Surface Mining Equipment Type Share – 2021 & 2026 (%)

Fig.54 Rest of South & Central America Surface Mining Equipment Commodity Group Share – 2021 & 2026 (%)

Fig.55 Middle East & Africa Surface Mining Equipment Market Snapshot

Fig.56 Middle East & Africa Surface Mining Equipment By Type Share – 2021 & 2026 (%)

Fig.57 Middle East & Africa Surface Mining Equipment Market By Commodity Group Share – 2021 & 2026 (%)

Fig.58 South Africa Surface Mining Equipment Type Share – 2021 & 2026 (%)

Fig.59 South Africa Surface Mining Equipment Commodity Group Share – 2021 & 2026 (%)

Fig.60 Democratic Republic of Congo Surface Mining Equipment Type Share – 2021 & 2026 (%)

Fig.61 Democratic Republic of Congo Surface Mining Equipment Commodity Group Share – 2021 & 2026 (%)

Fig.62 Rest of Middle East & Africa Surface Mining Equipment Type Share – 2021 & 2026 (%)

Fig.63 Rest of Middle East & Africa Surface Mining Equipment Commodity Group Share – 2021 & 2026 (%)

Fig.64 Market Share Analysis – Mining Trucks

Fig.65 Market Share Analysis – Excavators & Hydraulic Shovels

Fig.66 Market Share Analysis – Electric Shovels

Fig.67 Market Share Analysis – Loaders

Fig.68 Market Share Analysis – Dozers

Fig.69 Market Share Analysis – Graders

Fig.70 Research Elements

Fig.71 Information Procurement

Fig.72 Data Analysis Model

Fig.73 ICT Survey Process

Fig.74 Research Methodology

Frequently asked questions

Surface Mining Equipment Market Analysis by Region, Population, Commodity and Forecast to 2030 standard reports
Currency USD
$3,995

Can be used by individual purchaser only

$11,985

Can be shared globally by unlimited users within the purchasing corporation e.g. all employees of a single company


Undecided about purchasing this report?

Enquire Before Buying Request a Free Sample

Get in touch to find out about multi-purchase discounts

reportstore@globaldata.com
Tel +44 20 7947 2745

Every customer’s requirement is unique. With over 220,000 construction projects tracked, we can create a tailored dataset for you based on the types of projects you are looking for. Please get in touch with your specific requirements and we can send you a quote.

Sample Report

Surface Mining Equipment Market Analysis by Region, Population, Commodity and Forecast to 2030 was curated by the best experts in the industry and we are confident about its unique quality. However, we want you to make the most beneficial decision for your business, so we offer free sample pages to help you:

  • Assess the relevance of the report
  • Evaluate the quality of the report
  • Justify the cost

Download your copy of the sample report and make an informed decision about whether the full report will provide you with the insights and information you need.

Below is a sample report to understand what you are buying

See what our customers are saying

“The GlobalData platform is our go-to tool for intelligence services. GlobalData provides an easy way to access comprehensive intelligence data around multiple sectors, which essentially makes it a one-for-all intelligence platform, for tendering and approaching customers.

GlobalData is very customer orientated, with a high degree of personalised services, which benefits everyday use. The highly detailed project intelligence and forecast reports can be utilised across multiple departments and workflow scopes, from operational to strategic level, and often support strategic decisions. GlobalData Analytics and visualisation solutions has contributed positively when preparing management presentations and strategic papers.”

Business Intelligence & Marketing Manager, SAL Heavy Lift

“COVID-19 has caused significant interference to our business and the COVID-19 intelligence from GlobalData has helped us reach better decisions around strategy. These two highlights have helped enormously to understand the projections into the future concerning our business units, we also utilise the project database to source new projects for Liebherr-Werk to use as an additional source to pitch for new business.”

Market Analyst & Management, Liebherr-Werk

Your daily news has saved me a lot of time and keeps me up-to-date with what is happening in the market, I like that you almost always have a link to the source origin. We also use your market data in our Strategic Business Process to support our business decisions. By having everything in one place on the Intelligence Center it has saved me a lot of time versus looking on different sources, the alert function also helps with this.

Head of Key Accounts, Saab AB

Having used several other market research companies, I find that GlobalData manages to provide that ‘difficult-to-get’ market data that others can’t, as well as very diverse and complete consumer surveys.

Marketing Intelligence Manager, Portugal Foods

Our experience with GlobalData has been very good, from the platform itself to the people. I find that the analysts and the account team have a high level of customer focus and responsiveness and therefore I can always rely on. The platform is more holistic than other providers. It is convenient and almost like a one stop shop. The pricing suite is highly competitive and value for our organisation.

I like reports that inform new segments such as the analysis on generation Z, millennials, the impact of COVID 19 to our banking customers and their new channel habits. Secondly the specialist insight on affluent sector significantly increases our understanding about this group of customers. The combination of those give us depth and breadth of the evolving market.

I’m in the business of answering and helping people make decisions so with the intelligence center I can do that, effectively and efficiently. I can share quickly key insights that answer and satisfy our country stakeholders by giving them many quality studies and primary research about competitive landscape beyond the outlook of our bank. It helps me be seen as an advisory partner and that makes a big difference. A big benefit of our subscription is that no one holds the whole data and because it allows so many people, so many different parts of our organisation have access, it enables all teams to have the same level of knowledge and decision support.

Head of Customer Insight and Research, Standard Chartered

“I know that I can always rely on Globaldata’s work when I’m searching for the right consumer and market insights. I use Globaldata insights to understand the changing market & consumer landscape and help create better taste & wellbeing solutions for our customers in food, beverage and healthcare industries.

Globaldata has the right data and the reports are of very high quality compared to your competitors. Globaldata not only has overall market sizes & consumer insights on food & beverages but also provides insights at the ingredient & flavour level. That is key for B2B companies like Givaudan. This way we understand our customers’ business and also gain insight to our unique industry”

Head of Consumer Sensory Insights, Givaudan

GlobalData provides a great range of information and reports on various sectors that is highly relevant, timely, easy to access and utilise.  The reports and data dashboards help engagement with clients; they provide valuable industry and market insights that can enrich client conversations and can help in the shaping of value propositions. Moreover, using GlobalData products has helped increase my knowledge of the finance sector, the players within it, and the general threats and opportunities.

I find the consumer surveys that are carried out to be extremely beneficial and not something I have seen anywhere else. They provided an insightful view of why and which consumers take (or don’t) particular financial products. This can help shape conversations with clients to ensure they make the right strategic decisions for their business.

One of the challenges I have found is that data in the payments space is often piecemeal. With GD all of the data I need is in one place, but it also comes with additional market reports that provide useful extra context and information. Having the ability to set-up alerts on relevant movements in the industry, be it competitors or customers, and have them emailed directly to me, ensures I get early sight of industry activity and don’t have to search for news.

Senior Account Manager, TSYS
Go even deeper with GlobalData Intelligence Center

Every Company Report we produce is powered by the GlobalData Intelligence Center.

Subscribing to our intelligence platform means you can monitor developments at Surface Mining Equipment Market Analysis by Region, Population, Commodity and Forecast to 2030 in real time.

  • Access a live Surface Mining Equipment Market Analysis by Region, Population, Commodity and Forecast to 2030 dashboard for 12 months, with up-to-the-minute insights.
  • Fuel your decision making with real-time deal coverage and media activity.
  • Turn insights on financials, deals, products and pipelines into powerful agents of commercial advantage.