Haynesville Shale in the United States of America (USA) – Oil and Gas Shale Market Analysis and Outlook to 2025
Powered by ![]()
All the vital news, analysis, and commentary curated by our industry experts.

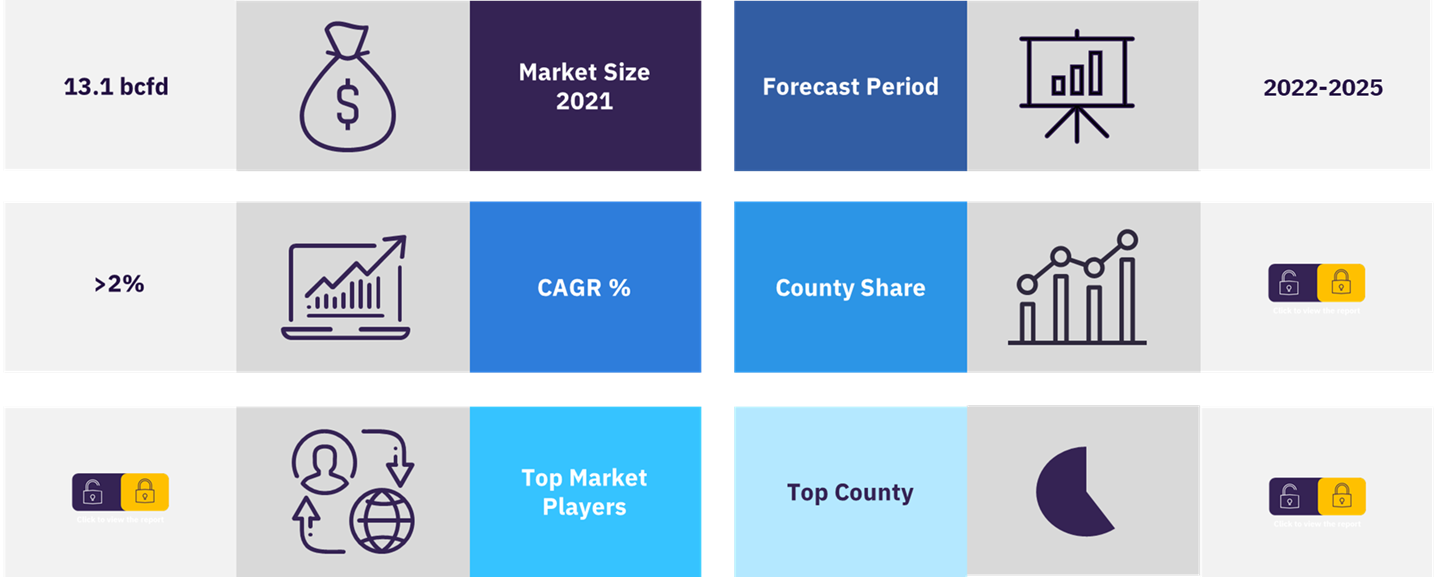
The total natural gas production from the Haynesville shale play in the US was 13.1 bcfd in 2021. The natural gas production in the Haynesville shale is projected to grow at a CAGR of more than 2% during the period 2022-2025. On the other hand, crude oil production in the shale is expected to maintain flatter recovery during the same period, showing a minimal CAGR of more than 0.5%. Both natural gas and crude oil commodities are being forecasted to maintain an upward trend throughout 2022-25.
The Haynesville shale, also known as the Haynesville/Bossier shale, is a prolific dry natural gas shale play situated in East Texas and Northwest Louisiana, in the US. The Haynesville shale is spread across 9,000 sq. miles with an average thickness of 200-300 feet. The most productive counties in the Haynesville shale from Louisiana are Caddo, Bienville, Bossier, De Soto, Red River, and Webster. In Texas, Harrison Panola, Shelby, and San Augustine counties are the most active locations for hydrocarbon appraisal and development in this play. The strategic location of the shale near the Gulf of Mexico makes it one of the most revenue-generating shale plays in the US. The petrochemical complexes and LNG export facilities around this shale formation help in rapid ‘spud-to-sale’ cycle time, thus, making it more attractive to investors.
Overview of the Haynesville shale market in the US
For more insights on this report, download a free report sample
What are the market dynamics in the Haynesville shale market in the US?
Drilling activity in the Haynesville shale formation began in 2008, led by independent operator Chesapeake Energy. Initially, natural gas extraction from Haynesville shale play was found to be somewhat unviable with the available technology at that time. Production was challenging because hydrocarbons deposits in this shale are located in deeper layers than most of the other shale gas formations, ranging from 10,500 ft. to 14,000 ft. This play observes higher wellhead treating pressure with bottomhole temperatures averaging 155°C (311°F), which necessitated the use of more advanced fluid chemistry for gas extraction. Over the years, innovation in drilling technology and updated completion techniques changed the competitive landscape of this play, thereby attracting more players to undertake drilling activities.
In the coming years, the production in the Haynesville shale is expected to grow further. Most of this production growth is expected to be driven by the demand from LNG liquefaction terminals and petrochemical plants on the Gulf Coast. The pipeline infrastructure in the Haynesville play presently, is quite well developed to transport natural gas from the producing wells to the Gulf Coast. Some more pipeline projects are being considered in Louisiana that would deliver gas to proposed LNG liquefaction terminals. The recent boom in LNG liquefaction terminals along the Gulf Coast has made the play even more attractive, as it primarily produces dry gas. The commencement of LNG production from Cheniere Energy’s Sabine Pass II LNG terminal in 2016 led to a wave of proposed LNG liquefaction projects across Texas and Louisiana. Cheniere presently operates five LNG trains at the Sabine Pass II LNG terminal and has recently taken the final investment decision (FID) to construct a sixth train at the terminal. Many more projects are being considered along the Gulf Coast that could potentially encourage shale gas producers in the Haynesville to sustain production growth in the coming years. Merger and acquisition activity in the Haynesville shale picked up in 2021 after the industry slowdown in 2020. The demand growth for commodities and crude oil price recovery encouraged operators in the Haynesville shale to expand their operations, which was reflected in the rise in number of deals during 2021.
Which are the major counties in the US Haynesville shale market?
The most productive counties in the Haynesville shale from Louisiana are Caddo, Bienville, Bossier, De Soto, Red River, and Webster. In Texas, Harrison Panola, Shelby, and San Augustine counties are the most active locations for hydrocarbon appraisal and development in this play.
Haynesville shale market in De Soto
De Soto County from Louisiana state was the top producer of natural gas in the Haynesville shale in 2020. The county accounted for more than 18% of the total natural gas production in the shale in 2020. Despite the COVID-19 pandemic, the county recorded an annual increase of over 2% in natural gas production in 2020.
Haynesville shale market in Panola and Caddo
Panola county in Texas state and Caddo county in Louisiana were the second and third largest natural gas producing counties in the Haynesville shale in 2020. Over 20% of the total natural production in the Haynesville shale was obtained from these two counties during the same period.
Other Counties
The other counties in the Haynesville shale market in the US include Harrison, San Augustine, Bossier, Red River, Nacogdoches, and Sabine.
Haynesville shale market in the US, by county

For more regional insights, download a free report sample
Which are the major players in the US Haynesville shale market?
Exxon Mobil, Comstock Resources, Southwestern Energy, Chesapeake Energy, Amplify Energy, BP Plc, Osaka Gas, Castleton Resources, Exco Resources, Chevron Corp, Matador Resources, and New Century Exploration are the major players in the US Haynesville shale market. Exxon Mobil was the largest leaseholder in the Haynesville shale. It held more than 600,000 net acres as of November 2021, spread across thirteen counties in Louisiana. Exxon Mobil is also one of the largest producers of crude oil and natural gas from the Haynesville shale. Comstock Resources was the second largest acreage holder in the shale with more than 320,000 net acres of leasehold.
COVID-19 sparked an economic slowdown that highlighted the importance to maintain a strong financial position to weather the cyclical nature of the industry. Therefore, many companies have realigned their strategies to focus on creating free cash flow to reduce their debt levels.
Haynesville shale market in the US, by key players
To know more about key players, download a free report sample
Market report scope
| Total natural gas production (Year – 2021) | 13.1 bcfd (billion cubic feet per day) |
| Growth rate (CAGR) | >2% |
| Base year for estimation | 2020 |
| Forecast period | 2022-2025 |
| Segmentation by county | De Soto, Panola, Caddo, Harrison, San Augustine, Bossier, Red River, Nacogdoches, Sabine, and other counties |
| Key players | Exxon Mobil, Comstock Resources, Southwestern Energy, Chesapeake Energy, Amplify Energy, BP Plc, Osaka Gas, Castleton Resources, Exco Resources, Chevron Corp, Matador Resources, and New Century Exploration |
Scope
The report analyses the crude oil and natural gas appraisal and production activities in the Haynesville shale in the US. The scope of the report includes:
- Comprehensive analysis of the crude oil and natural gas historical production and outlook during 2018-25.
- Detailed information of the impact on well development, permits and deals against the backdrop of the COVID–19 pandemic.
- In-depth information of well productivity and well completion parameters across the Haynesville shale.
- Analysis of the net acreage of top companies, planned capital expenditure, as well as crude oil and natural gas reserves and production stats in this shale play.
- Up-to-date information on the major mergers and acquisitions across the Haynesville shale from 2019 to 2021.
Reasons to Buy
- Develop business strategies with the help of specific insights into the Haynesville shale in the US.
- Plan your strategies based on economic viability and expected developments in the Haynesville shale.
- Keep yourself informed of the latest M&A activity across the Haynesville shale.
- Identify opportunities and challenges across the Haynesville shale
Table of Contents
Table
Figures
Frequently asked questions
-
What was the total natural gas production capacity for Haynesville shale market in US in 2021?
The total natural gas production capacity from Haynesville shale in the US was valued at 13.1 bcfd in 2021.
-
What was the growth rate of Haynesville shale market in the US?
The natural gas production in the Haynesville shale is projected to grow at a CAGR of more than 2% during the forecast period.
-
What are the key counties in the US Haynesville shale market?
Key counties in the US Haynesville shale market are De Soto, Panola, Caddo, Harrison, San Augustine, Bossier, Red River, Nacogdoches, Sabine, and other counties.
-
Which are the key players in the US Haynesville shale market?
Exxon Mobil, Comstock Resources, Southwestern Energy, Chesapeake Energy, Amplify Energy, BP Plc, Osaka Gas, Castleton Resources, Exco Resources, Chevron Corp, Matador Resources, and New Century Exploration are the key players in the US Haynesville shale market.
Get in touch to find out about multi-purchase discounts
reportstore@globaldata.com
Tel +44 20 7947 2745
Every customer’s requirement is unique. With over 220,000 construction projects tracked, we can create a tailored dataset for you based on the types of projects you are looking for. Please get in touch with your specific requirements and we can send you a quote.
Sample Report
Haynesville Shale in the United States of America (USA) – Oil and Gas Shale Market Analysis and Outlook to 2025 was curated by the best experts in the industry and we are confident about its unique quality. However, we want you to make the most beneficial decision for your business, so we offer free sample pages to help you:
- Assess the relevance of the report
- Evaluate the quality of the report
- Justify the cost
Download your copy of the sample report and make an informed decision about whether the full report will provide you with the insights and information you need.


