Marcellus and Utica Shales in the US, 2021 – Oil and Gas Shale Market Analysis and Outlook to 2025
Powered by ![]()
All the vital news, analysis, and commentary curated by our industry experts.

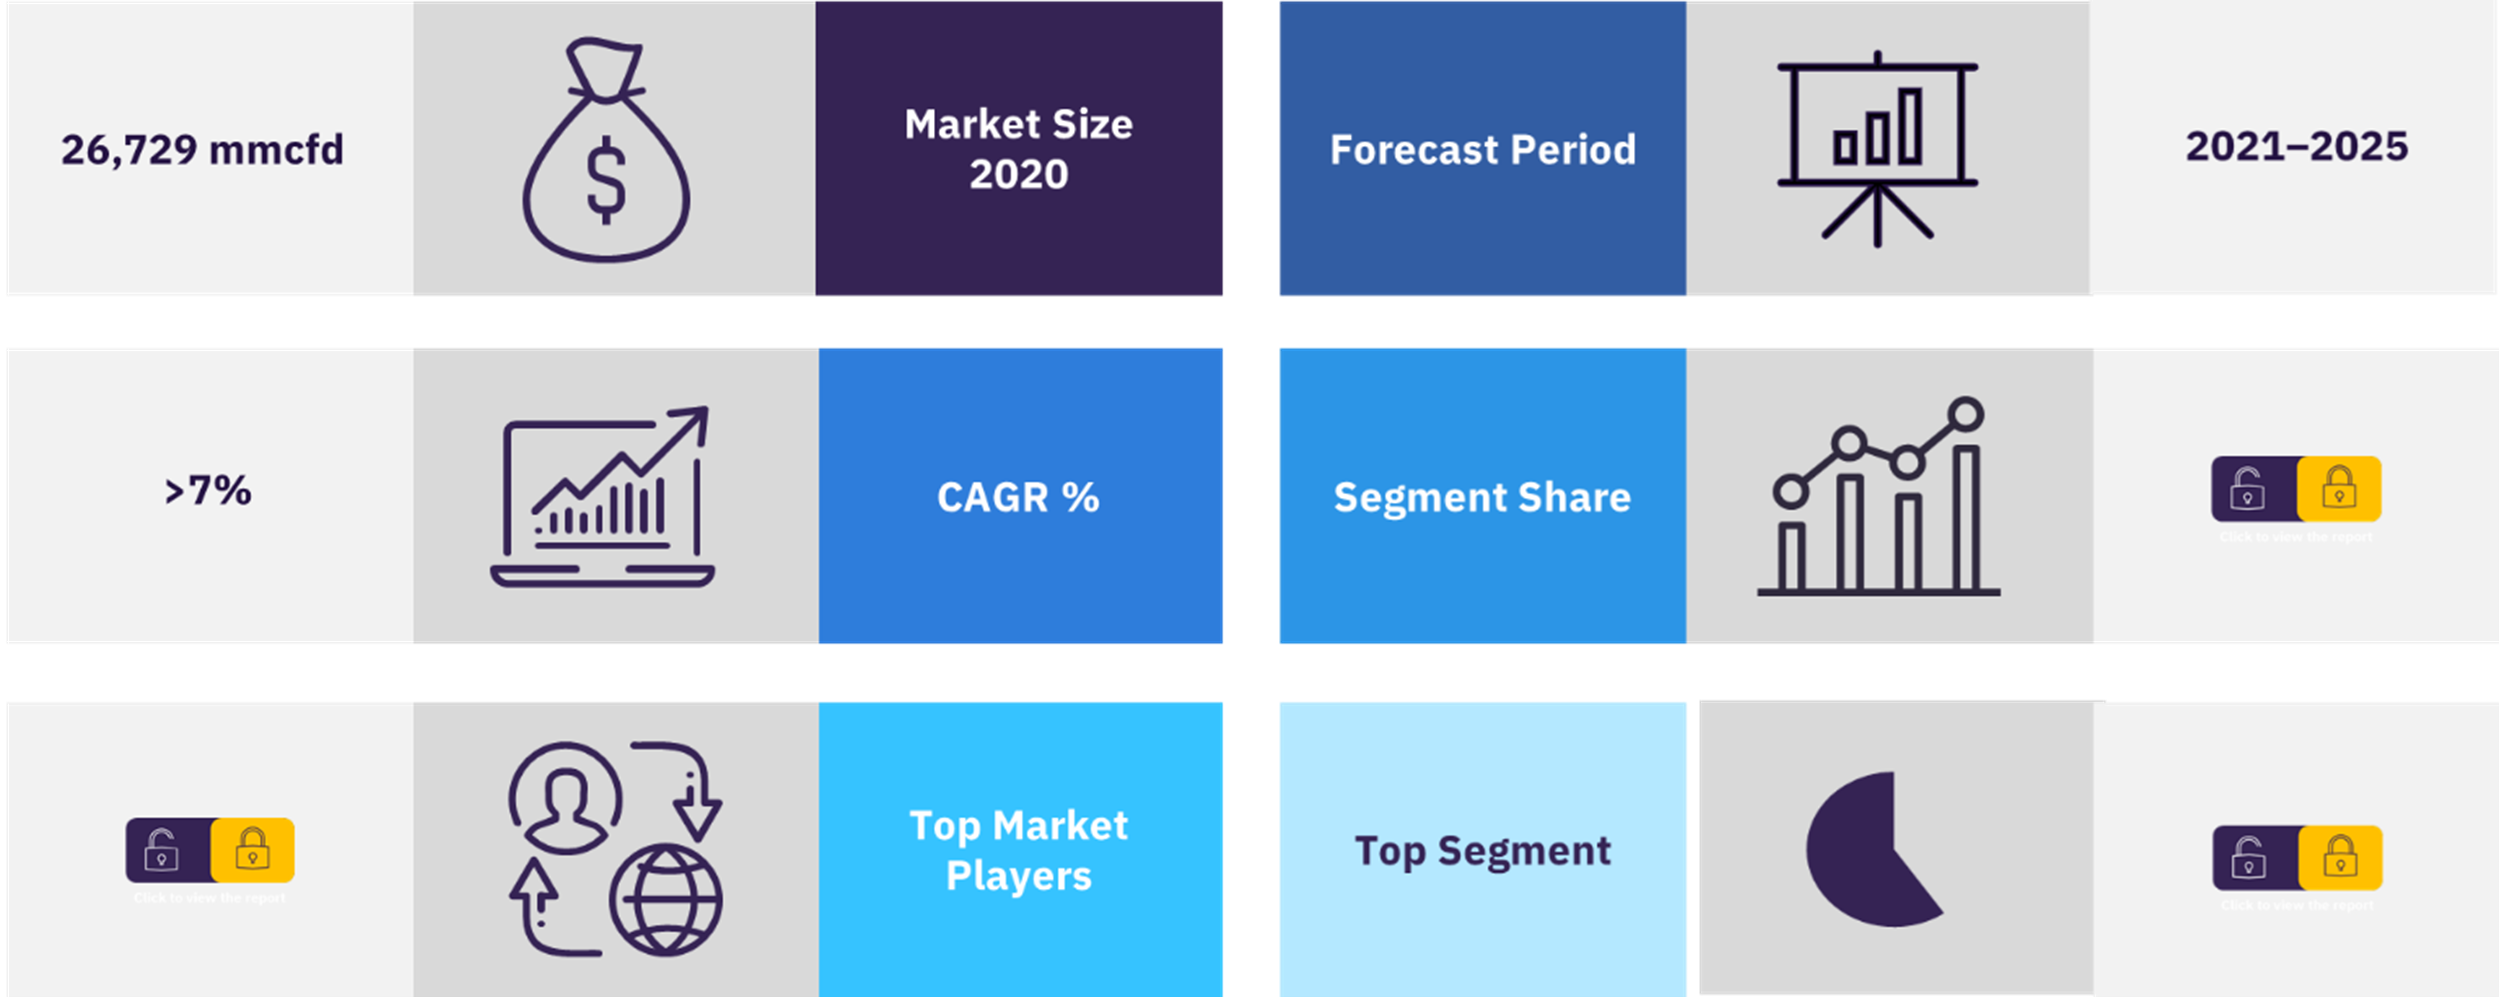
The natural gas production in the Marcellus and Utica shales in the US was 26,729 mmcfd and 6,232 mmcfd, respectively in 2020. According to GlobalData, the natural gas production outlook in the Marcellus shale is projected to maintain a stable growth trend during the forecast period of 2021-25. The market is projected to grow at a CAGR of more than 7% in the Marcellus shales and more than 16% in the Utica shales during the forecast period 2021-2025. On the other hand, crude oil production in the Utica shale is expected to stay almost flat during the forecasted period 2021-25.
The Marcellus and Utica shale plays are one of the largest and most highly concentrated natural gas resources in the US. The Marcellus and Utica plays are geologically placed in such a way that the Utica shale lies beneath the Marcellus shale in some states. Gas production in the Marcellus and Utica plays is carried out in the states of Pennsylvania, West Virginia, Ohio, and New York. The Marcellus and Utica plays have become one of the most progressive unconventional gas shales in the US. These plays are located across some of the most prosperous states in the country. In 2020, despite COVID-19 led demand destruction, production of crude oil and natural gas in the Marcellus shale grew annually by over 4% and 3%, respectively. On the other hand, crude oil production in the Utica shale was down by 23% in 2020, while natural gas production exhibited a marginal decline last year.
Overview of natural gas production in the Marcellus Shales
For more insights on this report, download a free report sample
What are the market dynamics in the US Marcellus and Utica shales market?
The Marcellus and Utica plays have become one of the most progressive unconventional gas shales in the US. These plays are located across some of the most prosperous states in the country. Incidentally, these are also in proximity to major manufacturing and financial hubs on the US East Coast, which are some of the biggest markets for natural gas consumption. This geographic location gives producers in the Marcellus and Utica shales a considerable edge in terms of obtaining better returns on their commodity due to lower transportation costs.
The Utica shale play has witnessed considerable development activities in the states of Ohio and Pennsylvania. Over the last couple of years, Ascent Resources, Gulfport Energy, and other major operators in this shale play have concentrated their drilling activities on leaseholds in Harrison, Jefferson, and Belmont counties in the state of Ohio. National Fuel Gas, another major producer in the Utica shale play, conducts drilling and completion activities across Elk, Cameron, McKean, and Tioga counties in Pennsylvania. Marcellus and Utica shale plays have observed steady growth in natural gas production over the last five years. This has supported the expansion of midstream infrastructure in the Appalachia Basin to facilitate the gathering and transportation of natural gas and NGLs. The Marcellus and Utica shales have a network of 22 active pipelines, of which 14 are gas pipelines. The gas pipeline network in these shale plays has an approximate cumulative length of 1,478 km, with the capacity to carry around 8,832 mmcfd of gas.
As companies continue to recover from the downturn in 2020, the M&A market has begun to see an increase in deal making throughout 2021. Among the largest M&A transactions within the upstream sector of the oil and gas industry, this year was EQT’s acquisition of ARD Operating and Alta Marcellus from Alta Resources for $2.9 billion. Announced in May 2021, the deal was finalized on July 21, 2021, with an effective date of January 1st, 2021.
Which are the major segments in the US Marcellus and Utica shales market?
The major segments found in the US Marcellus and Utica shales market are natural gas and crude oil. The report offers production analysis and outlook of natural gas and crude oil in the Marcellus and Utica shales by county.
Natural gas market in the Marcellus and Utica shales in the US
Susquehanna county of Pennsylvania was the major gas-producing county in the Marcellus shale during 2018-2020. Washington county of Pennsylvania was the second major natural gas-producing county in the shale. Greene and Bradford counties of Pennsylvania and Tyler county of West Virginia were the other leading natural gas-producing counties in the Marcellus shale. Belmont county of Ohio led the natural gas production in the Utica shale during 2018-2020. Jefferson and Harrison counties of Ohio were the other top producing counties in the Utica shale.
Crude oil market in the Marcellus and Utica shales in the US
Marshal county in West Virginia was the largest producer of crude oil in the Marcellus shale. Major shale operators, such as Southwestern Energy and Tug Hill Operating are active in this county. Ohio, Tyler, Brooke counties of West Virginia, and Guernsey county of Ohio were the other top counties in the Marcellus shale in terms of crude oil production. Ohio, Tyler, Brooke counties of West Virginia, and Guernsey county of Ohio were the other top counties in the Marcellus shale in terms of crude oil production in 2020.
Marcellus and Utica shales market in the US, by segment

For more segment insights, download a free report sample
Which are the major players in the US Marcellus and Utica shales market?
National Fuel Gas Co, CNX Resources Corp, EQT Corp, Southwestern Energy Co, Range Resources, Exxon Mobil, Antero Resources Corp, Chesapeake Energy Corp, Ascent Resources LLC, Gulfport Energy Corp, and Coterra Energy are the major players in the US Marcellus and Utica shales market. National Fuel Gas had the largest presence in the Marcellus and Utica shale plays, spanning over five counties in Pennsylvania state. The company is also one of the top gas producers in these shales. CNX Resources held the second-largest leaseholds in these shale plays. EQT Corp and Southwestern Energy were the third and fourth highest leaseholders in the Marcellus and Utica shales.
Marcellus and Utica shales market in the US, by key players

To know more about key players, download a free report sample
Market report scope
| Natural gas production in Marcellus shales (Year – 2020) | 26,729 mmcfd |
| Growth rate of natural gas in Marcellus shales (CAGR) | >7% |
| Base year for estimation | 2020 |
| Forecast period | 2021-2025 |
| Segments | Natural Gas and Crude Oil |
| Key players | National Fuel Gas Co, CNX Resources Corp, EQT Corp, Southwestern Energy Co, Range Resources, Exxon Mobil, Antero Resources Corp, Chesapeake Energy Corp, Ascent Resources LLC, Gulfport Energy Corp, and Coterra Energy |
Scope
The report analyses crude oil and natural gas appraisal and production activities in the Marcellus and Utica shales of the Appalachian Basin in the US. The scope of the report includes:
- Comprehensive analysis of crude oil and natural gas historical production and outlook during 2018-25.
- Detailed information on the impact on well development, permits, and deals against the backdrop of the COVID–19 pandemic.
- In-depth information on well productivity and well completion parameters across the Marcellus and Utica shales.
- Analysis of net acreage of top companies, planned capital expenditure, as well as crude oil and natural gas reserves and production stats in these shale plays.
- Up-to-date information on major mergers and acquisitions across the Marcellus and Utica shales from 2019 to 2021.
Reasons to Buy
- Develop business strategies with the help of specific insights into the Marcellus and Utica shales in the US.
- Plan your strategies based on economic viability and expected developments in the Marcellus and Utica shales.
- Keep yourself informed of the latest M&A activity across the Marcellus and Utica shales.
- Identify opportunities and challenges across the Marcellus and Utica shales.
Table of Contents
Table
Figures
Frequently asked questions
-
What was the total natural gas production for the US Marcellus and Utica shales market in 2020?
The natural gas production in the Marcellus and Utica shales in the US was 26,729 mmcfd and 6,232 mmcfd, respectively in 2020.
-
What is the growth rate of the Marcellus and Utica shales market in the US?
The market is projected to grow at a CAGR of more than 7% in the Marcellus shales and over 16% in the Utica shales during the forecast period 2021-2025.
-
What are the key segments in the US Marcellus and Utica shales market?
The major segments in the US Marcellus and Utica shales market are natural gas and crude oil.
-
Which are the key players in the US Marcellus and Utica shales market?
National Fuel Gas Co, CNX Resources Corp, EQT Corp, Southwestern Energy Co, Range Resources, Exxon Mobil, Antero Resources Corp, Chesapeake Energy Corp, Ascent Resources LLC, Gulfport Energy Corp, and Coterra Energy are the key players in the US Marcellus and Utica shales market.
Get in touch to find out about multi-purchase discounts
reportstore@globaldata.com
Tel +44 20 7947 2745
Every customer’s requirement is unique. With over 220,000 construction projects tracked, we can create a tailored dataset for you based on the types of projects you are looking for. Please get in touch with your specific requirements and we can send you a quote.
Sample Report
Marcellus and Utica Shales in the US, 2021 – Oil and Gas Shale Market Analysis and Outlook to 2025 was curated by the best experts in the industry and we are confident about its unique quality. However, we want you to make the most beneficial decision for your business, so we offer free sample pages to help you:
- Assess the relevance of the report
- Evaluate the quality of the report
- Justify the cost
Download your copy of the sample report and make an informed decision about whether the full report will provide you with the insights and information you need.


