Virtual Reality Market Size, Share and Trends Analysis Report by End-User Type (Enterprise, Consumer), IT Infrastructure (Hardware, Software) and Region (North America, Europe, Asia Pacific, Central & South America, Middle East & Africa) and Segment Forecast to 2030

Powered by

Access in-depth insight and stay ahead of the market

Virtual Reality Market Report Overview

The virtual reality (VR) market was valued at $12.3 Bn in 2023 and will grow at a compound annual growth rate (CAGR) of more than 23% over the forecast period. The growing use of VR technology in various industries, such as gaming & entertainment, healthcare, automotive, architecture, and education, is driving market expansion. The gaming & entertainment sector is anticipated to spearhead this growth, with companies increasingly focusing on creating new gaming content, software, and hardware. Additionally, the increasing popularity of theme parks, gaming arcades, and virtual worlds is also contributing to the growth of the virtual reality market.

Virtual Reality Market Overview, 2020-2030 ($ Bn)

Virtual Reality Market Overview, 2020-2030 ($ Bn)

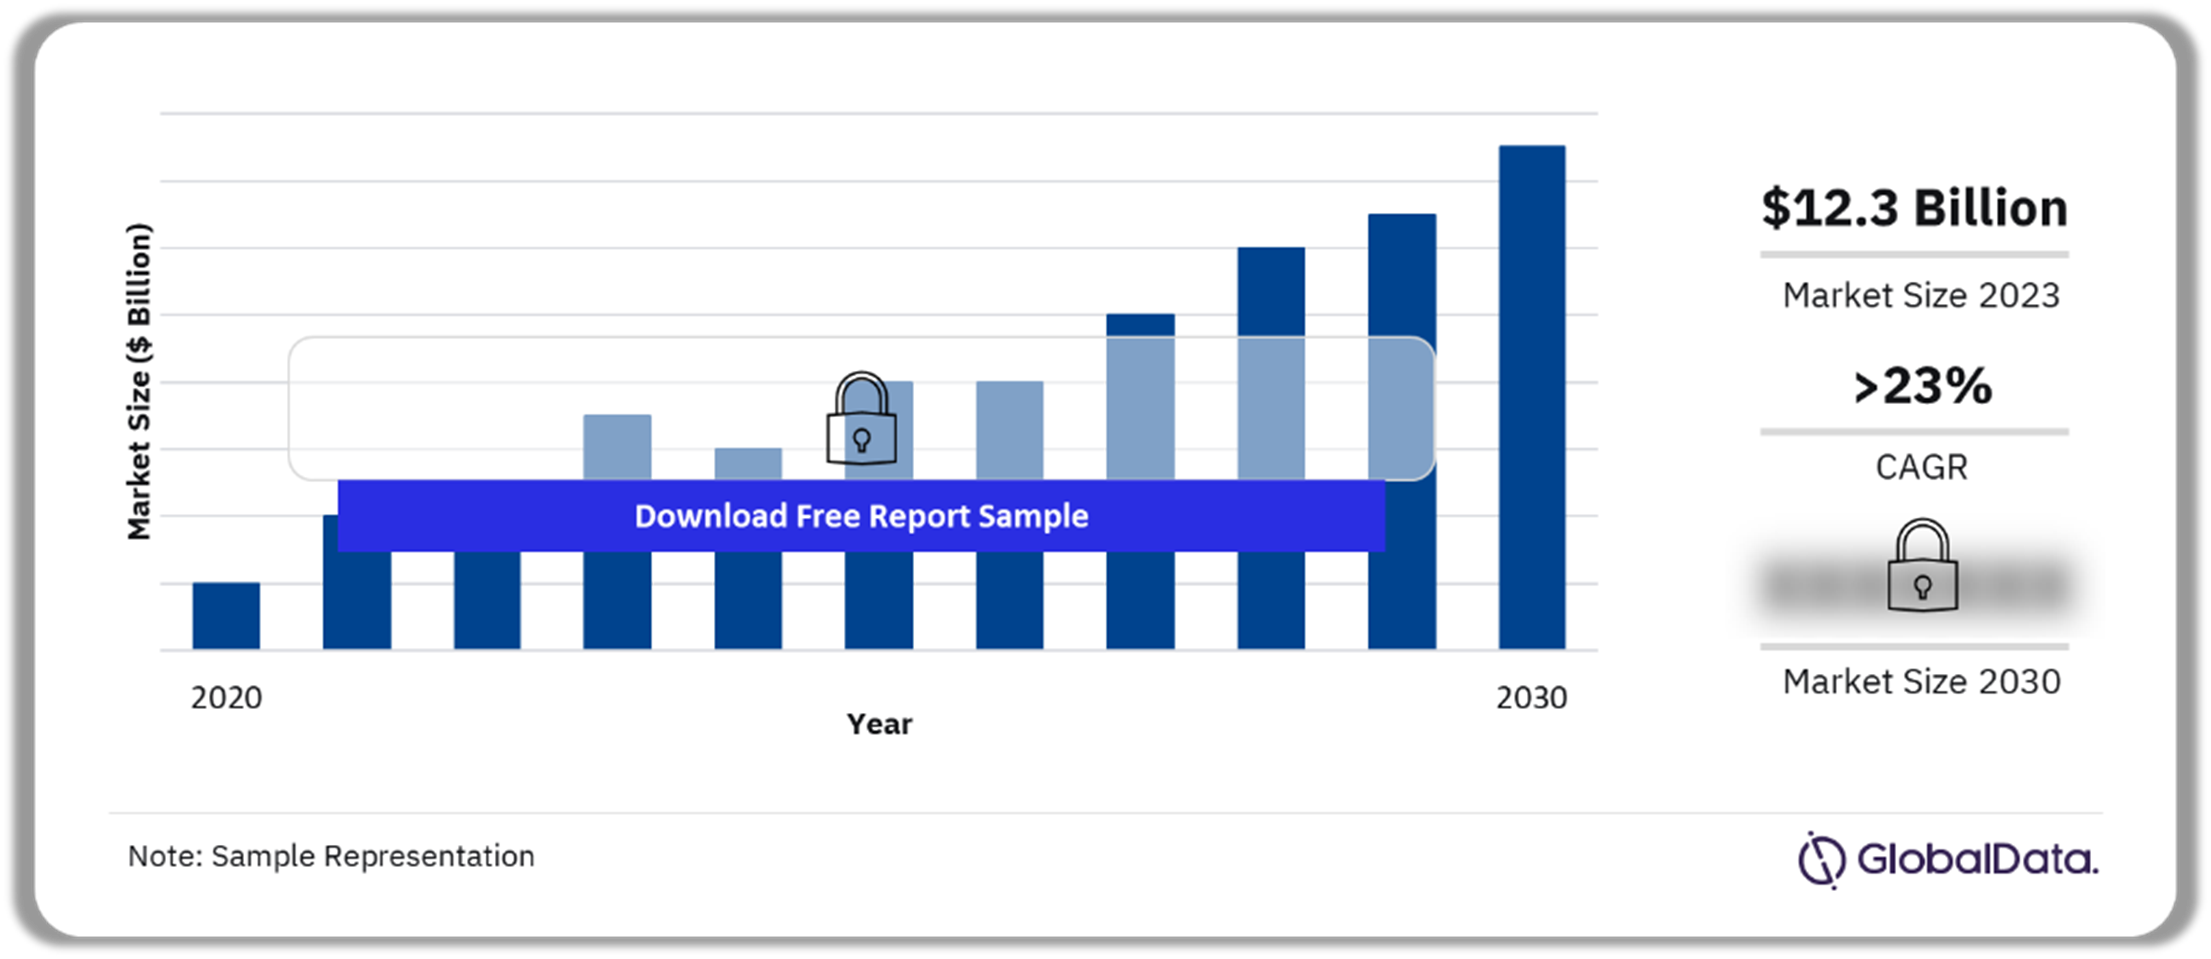
Buy the Full Report for Additional Insights into the Virtual Reality Market Forecast, Download a Free Report Sample

The VR industry has experienced significant growth in recent years, revolutionizing the interaction with technology. As this dynamic sector continues its expansion, the regulatory framework governing VR technologies has become a focal point. Unlike traditional industries, the VR sector operates in a constantly changing environment, presenting regulators with unique challenges and opportunities.

The rising popularity of virtual events and experiences is fueling the growth of the VR market. With a growing number of events and conferences transitioning to online formats, there is an increasing demand for VR technology as a hosting platform. This trend is driving adoption among both enterprises and consumers.

Technological advancements are driving the growth of the VR industry. Ongoing enhancements in VR hardware, such as headsets and controllers, are increasing the accessibility and user-friendliness of the technology. Simultaneously, progress in software development, including improvements in graphics rendering and tracking capabilities, is boosting the realism and immersion of VR experiences, thereby driving adoption even further.

Additionally, the growth of augmented reality (AR) and mixed reality (MR) technologies is aiding momentum in the overall expansion of the VR market. AR and MR technologies enhance VR by providing more comprehensive and adaptable immersive experiences, broadening the range of VR applications across various industries.

VR Market Size (2023) $12.3 Billion
CAGR (2022-2030) 23.6%
Forecast period 2022-2030
Historic Period 2019-2021
Report Scope & Coverage Revenue Forecast, Competitive Profiling, Company Market Share, and Growth Trends
End-user Type Segment Enterprise VR and Consumer VR
IT Infrastructure Segment Hardware and Software
Leading Companies Meta Platforms Inc., GoerTek Inc., Google LLC, Samsung Electronics, NVIDIA Corp., Microsoft Corp., Spectra7 Microsystems, Unity Technologies Ltd., HTC Corp., and Sunny Optical Technology

Virtual Reality Market Segmentation by End-Use Type

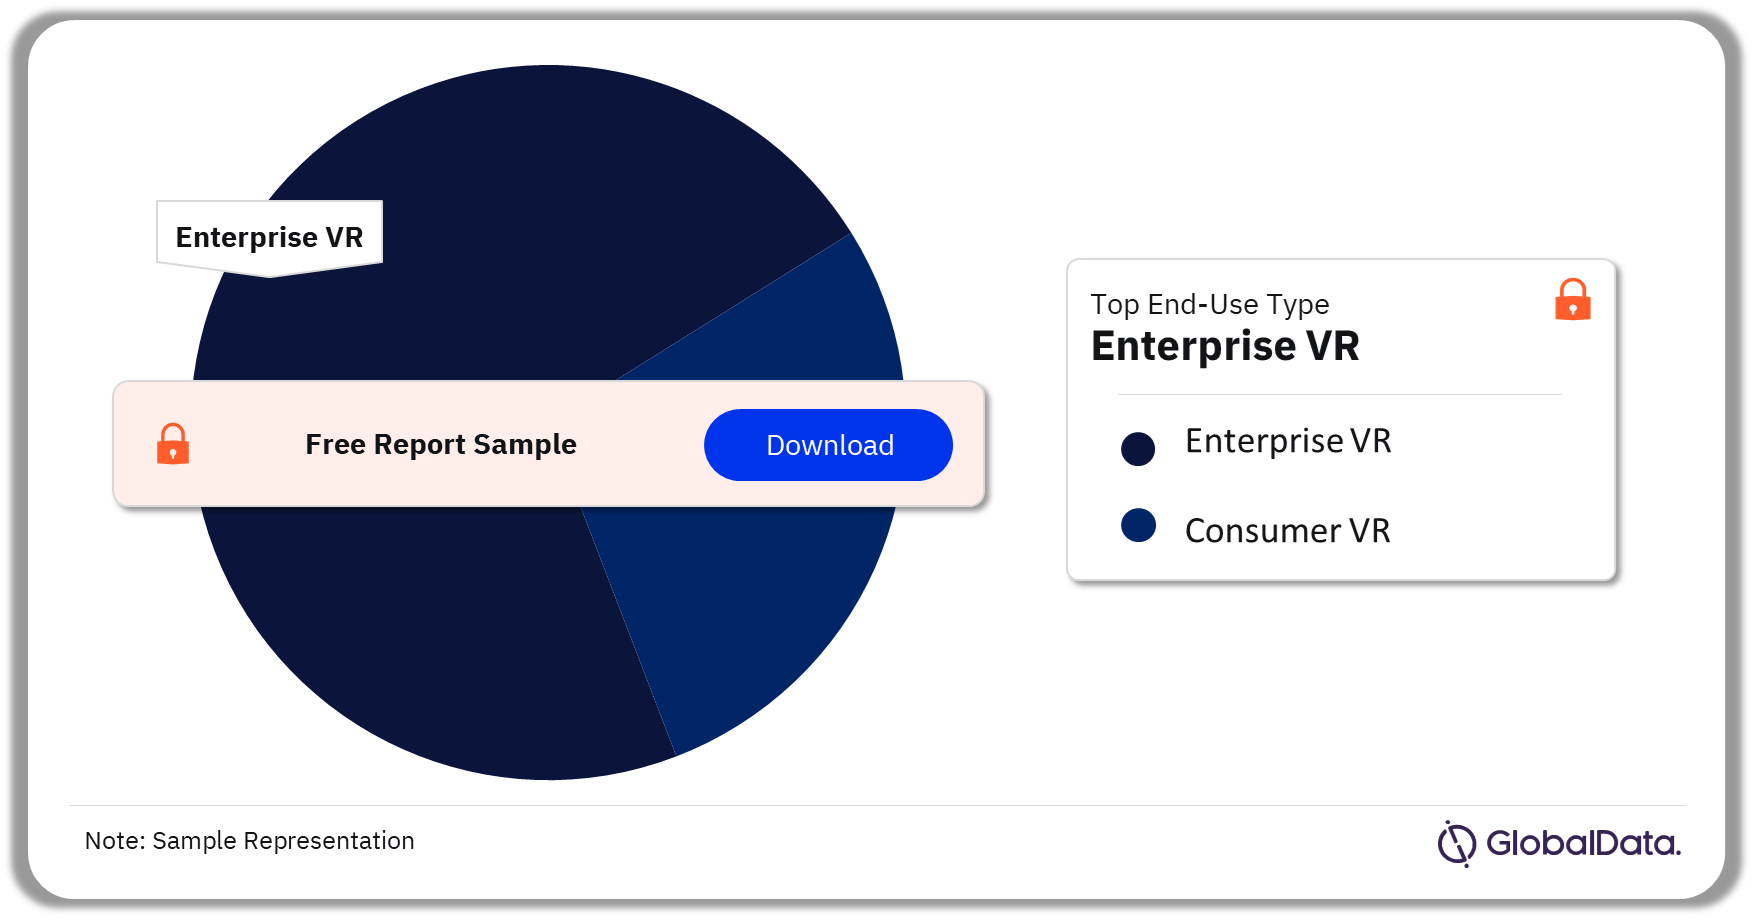
The VR market is categorized into enterprise and consumer markets, of which the enterprise VR market accounted for a higher market share compared to the consumer VR market in 2023. Enterprises frequently employ VR technologies for specialized purposes such as training, simulation, or design, necessitating custom hardware and software to meet their requirements. These tailored solutions contribute to increased revenue in the enterprise sector. Moreover, enterprises often need additional services such as installation, training, and ongoing support, which can substantially boost the overall revenue generated from enterprise VR solutions.

On the other hand, the consumer VR market is driven significantly by the gaming and entertainment sectors. The immersive and interactive features of the VR technology enrich gaming experiences, appealing to a broad and loyal consumer audience.

Virtual Reality Market Share by End-Use Type, 2023 (%)

Virtual Reality Market Share by End-Use Type, 2023 (%)

Buy the Full Report for Additional Insights into the Virtual Reality Market End-Use Type, Download a Free Report Sample

Virtual Reality Market Segmentation by IT Infrastructure

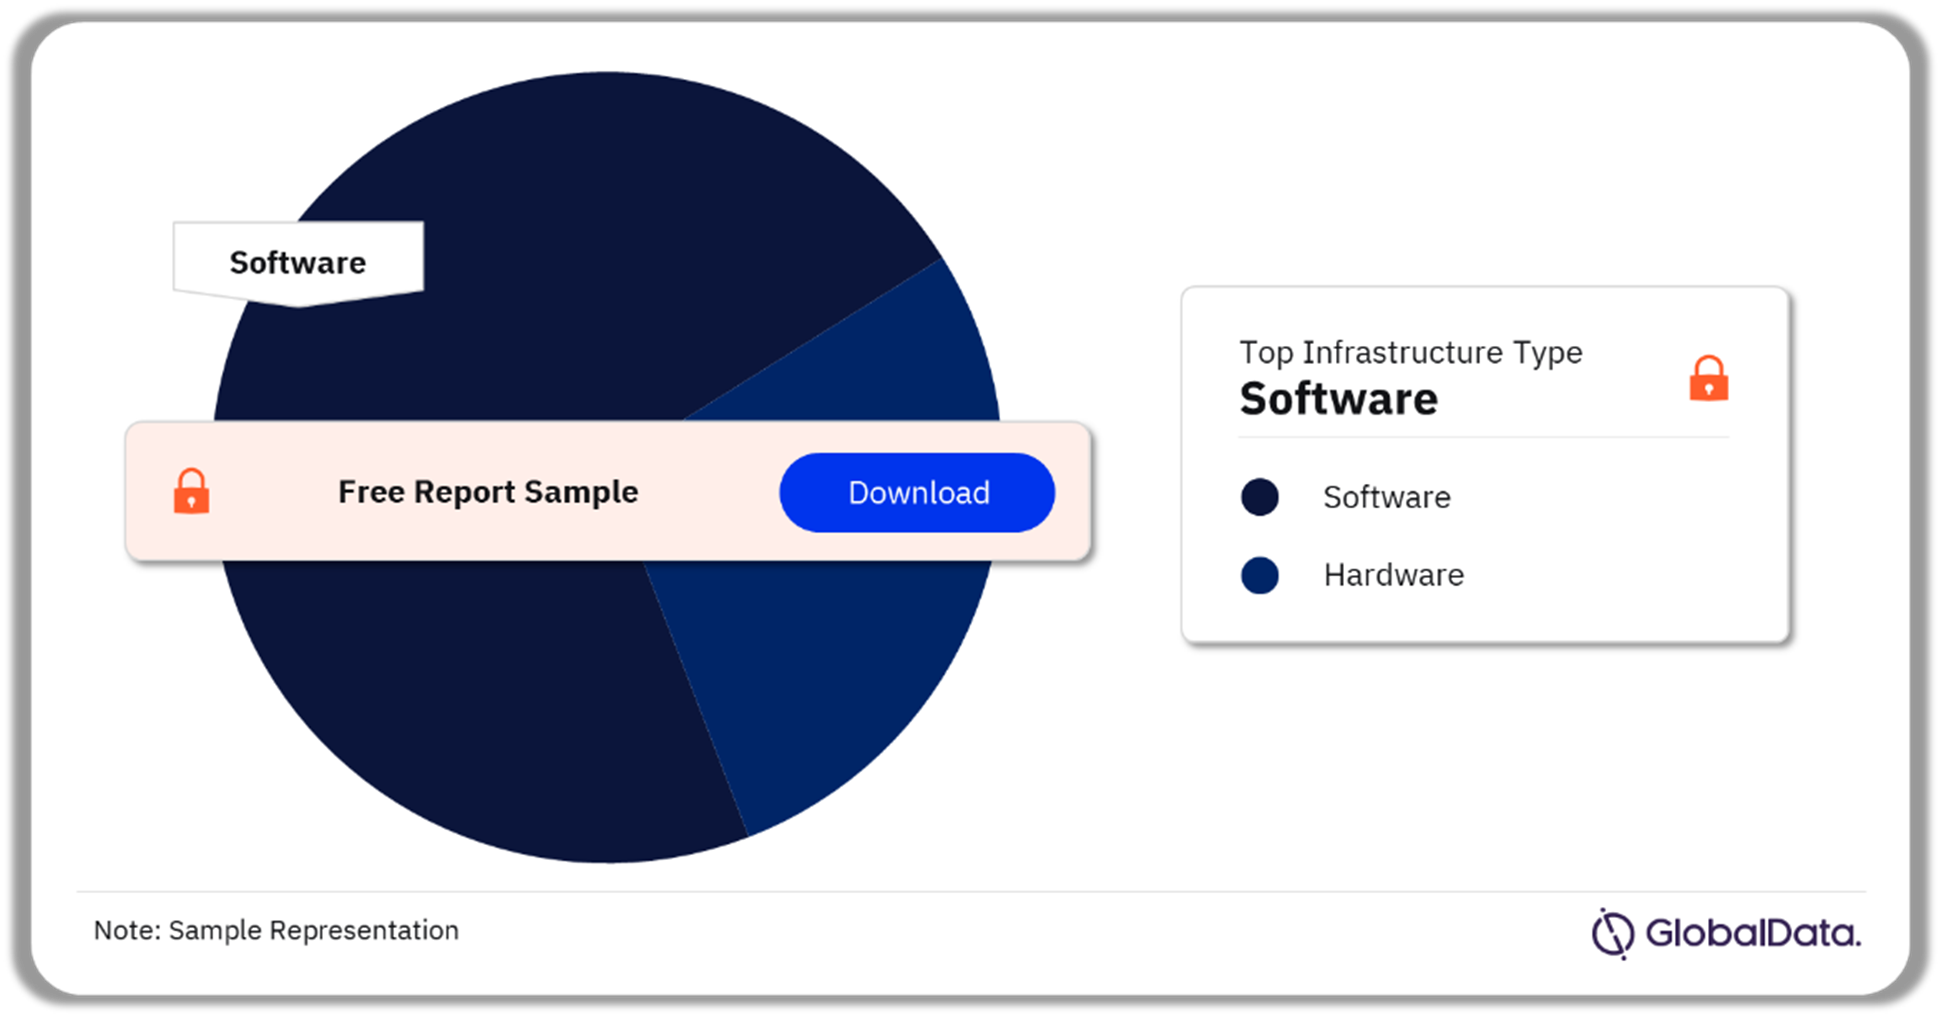
The VR market can be segmented into hardware and software, based on IT infrastructure type. In 2023, the VR software c compared to the VR hardware market. This can be primarily attributed to the huge surge in demand for VR software by enterprises to accommodate their remote workforce and revise their business planning and strategies with the emergence of the COVID-19 pandemic. Similarly, consumers shifted to leisure and gaming options, leading to a substantial increase in demand for VR games during the same period.

The VR software market can generate revenue through various channels, including game sales, in-app purchases, subscriptions, and advertising. This diversity in revenue streams can contribute to higher overall revenue compared to hardware.

Virtual Reality Market Share by IT Infrastructure, 2023 (%)

Virtual Reality Market Share by IT Infrastructure, 2023 (%)

Buy the Full Report for More Information on VR Market Infrastructure Types Download a Free Report Sample

Virtual Reality Market Analysis by Region

The North American VR market accounted for the largest share in 2023. The region’s dominance in the VR market is primarily attributed to its advanced technological infrastructure. Further, the region hosts a broad range of top-tier technology firms, research centers, and startups at the forefront of VR innovation. This thriving technological landscape creates an ideal environment for the advancement and acceptance of VR solutions, bolstering the region’s market leadership.

North America boasts a sizable and prosperous consumer demographic that eagerly embraces new technologies. The region’s robust consumer spending capacity and readiness to invest in state-of-the-art technology have rendered it a profitable market for VR enterprises. This consumer demand has propelled the expansion of the VR market in North America, strengthening its standing as the worldwide frontrunner.

Virtual Reality Market Share by Region, 2023 (%)

Buy the Full Report for Regional Insights into the Virtual Reality Market, Download a Free Report Sample.

North America also enjoys a regulatory environment and government programs that encourage technological innovation. These elements have cultivated an environment conducive to the success of VR enterprises, attracting both investment and skilled professionals to the region.

Virtual Reality Market ¬- Competitive Landscape

The VR industry is highly fragmented. Further, the market competition is intensifying owing to the growth of start-ups and new venture launches. Moreover, major companies are investing heavily in R&D to include pioneering technologies with a variety of features in their products. Microsoft’s Xbox Series X & Series S and Sony’s PlayStation 5 are likely to provide VR firms with new opportunities to strengthen their position in the consumer VR arena. With businesses realizing the importance of the VR enterprise sector they have already started reviving into this long-term profitable market. For instance, Microsoft and Samsung are devoted to developing VR headsets with immersive experiences to gain customer traction.

As the virtual reality market continues to grow, new developments in software and hardware paired with the need for regulation in the space will create disputes. More battles over intellectual property are to be some of the most prevalent as developers will have to start fiercely defending their intellectual property when the market becomes more saturated.

Further, the VR market is witnessing a rise in several big acquisitions which will further boost the degree of innovation in both hardware and software products. For instance, in January 2022, Goertek partnered with Sony to enhance the capabilities of the latter to mass-produce PlayStation VR 2. Similarly, VR companies are increasingly focusing on offering quality services to their users with innovative content and exploring new fields with VR solutions as the market becomes more competitive.

Leading Companies in the Virtual Reality Market

  • Meta Platforms Inc.
  • GoerTek Inc.
  • Google LLC
  • Samsung Electronics
  • NVIDIA Corp.
  • Microsoft Corp.
  • Spectra7 Microsystems
  • Unity Technologies Ltd.
  • HTC Corp.
  • Sunny Optical Technology

Other VR Market Vendors Mentioned

WiMi Hologram Cloud, One Digital Nation, Immersion Medical, Viotek, Vironit, Ninehertz, Groove Jones, PocketCake, Oculus VR, WorldViz, Bricks & Goggles.

Buy the Full Report to Know More About Leading VR Companies

Download a Free Report Sample

VR Market Scope

GlobalData Plc has segmented the VR market report by end user, product type, and region

VR Market End-user Type Outlook (Revenue, $ Mn, 2020-2030)

  • Enterprise
  • Consumer

VR Market IT Infrastructure Outlook (Revenue, $ Mn, 2020-2030)

  • Hardware
  • Software

VR Market Regional Outlook (Revenue, $ Mn, 2020-2030)

  • North America
  • US
  • Canada
  • Mexico
  • Europe 
  • Germany
  • UK
  • Italy
  • France
  • Spain
  • The Netherlands
  • Rest of Europe
  • Asia Pacific 
  • China
  • Japan
  • India
  • Australia
  • Rest of Asia Pacific
  • South & Central America
  • Brazil
  • Chile
  • Argentina
  • Rest of South & Central America
  • Middle East & Africa
  • United Arab Emirates (UAE)
  • Kingdom of Saudi Arabia (KSA)
  • Turkey
  • Rest of the Middle East & Africa

Key Players

Meta Platforms Inc
Goertek Inc
Google LLC
Samsung Electronics Co Ltd
NVIDIA Corp
Microsoft Corp
Spectra7 Microsystems Inc
Unity Technologies Inc
HTC Corp
Sunny Optical Technology Co Ltd

Table of Contents

  • 01. Executive Summary
  • 1.1 Virtual Reality Market Snapshot, 2021-30
  • 02. Research Scope & Segmentation
  • 03. Virtual Reality Market Industry Trend Analysis
  • 3.1 Virtual Reality Market – Industry Value Chain

    • 3.1.1 SEMICONDUCTORS
    • 3.1.2 CPUS
    • 3.1.3 GPUS
    • 3.1.4 VPUS
    • 3.1.5 IMAGE PROCESSORS
    • 3.1.6 COMMUNICATION CHIPS
    • 3.1.7 MEMS
    • 3.1.8 MEMORY CHIPS
    • 3.1.9 COMPONENTS
    • 3.1.10 MOTION TRACKING
    • 3.1.11 BATTERIES
    • 3.1.12 DISPLAYS
    • 3.1.13 CAMERAS AND 3D LENSES
    • 3.1.14 AUDIO COMPONENTS
    • 3.1.15 MACHINE VISION
    • 3.1.16 HEADSETS
    • 3.1.17 PLATFORMS
    • 3.1.18 AI
    • 3.1.19 APPLICATIONS AND CONTENT

  • 3.2 Virtual Reality Market Structure – PORTER’s Analysis
  • 3.3 Virtual Reality – Market Variables & Impact Analysis

    • 3.3.1 MARKET DRIVER ANALYSIS

      • 3.3.1.1 Gaming and Entertainment
      • 3.3.1.2 Immersive Virtual Events
      • 3.3.1.3 Learning and Training
      • 3.3.1.4 Technological Trends

    • 3.3.2 MARKET CHALLENGES/IMPEDIMENTS

      • 3.3.2.1 High Manufacturing Cost
      • 3.3.2.2 Technological Limitations with VR Devices
      • 3.3.2.3 Technology Limitations in Consumer Electronics
      • 3.3.2.4 Application Ecosystem

    • 3.3.3 COVID-19 IMPACT ANALYSIS
    • 3.3.4 TRENDS

      • 3.3.4.1 Technology Trends
      • 3.3.4.2 Macroeconomic Trends
      • 3.3.4.3 Regulatory Trends
      • 3.3.4.4 Media Trends

  • 3.4 Virtual Reality – Mergers & Acquisitions (M&A), 2018-2022 (YTD)

    • 3.4.1 M&A ACTIVITY DASHBOARD

  • 3.5 Virtual Reality – Patent Analysis, 2019-2021

    • 3.5.1 PATENT ANALYTICS DASHBOARD

  • 3.6 Virtual Reality – Job Analysis, 2021

    • 3.6.1 JOB ANALYTICS DASHBOARD

  • 3.7 Virtual Reality – Venture Financing Analysis, 2018-2022 (YTD)

    • 3.7.1 VENTURE FINANCING DASHBOARD

  • 3.8 Social Media Analysis, 2018-2022 (YTD)

    • 3.8.1 SOCIAL MEDIA ANALYTICS DASHBOARD

  • 04. Virtual Reality (VR) Revenue Opportunity
  • 4.1 Global Market Revenue Snapshot, 2020-2030 ($ Bn)
  • 4.2 Global Virtual Reality Market By Type, 2020-2030 ($ Bn)
  • 4.3 Global Virtual Reality Market By IT Infrastructure, 2020-2030 ($ Mn)
  • 05. Enterprise Virtual Reality Regional Outlook
  • 5.1 Enterprise Virtual Reality – Regional Deep Dive, 2021
  • 5.2 North America Enterprise Virtual Reality Market Snapshot

    • 5.2.1 NORTH AMERICA ENTERPRISE VIRTUAL REALITY MARKET, BY IT INFRASTRUCTURE, 2020-2030 ($ Mn)
    • 5.2.2 NORTH AMERICA ENTERPRISE VIRTUAL REALITY MARKET, BY HARDWARE, 2020-2030 ($ Mn)
    • 5.2.3 NORTH AMERICA ENTERPRISE VIRTUAL REALITY MARKET, BY SOFTWARE, 2020-2030 ($ Mn)
    • 5.2.4 US ENTERPRISE VIRTUAL REALITY MARKET

      • 5.2.4.1 US Enterprise Virtual Reality Market, By IT infrastructure, 2021 & 2030 ($ Mn)
      • 5.2.4.2 US Enterprise Virtual Reality Market, By Hardware, 2020-2030 ($ Mn)
      • 5.2.4.3 US Enterprise Virtual Reality Market, By Software, 2020-2030 ($ Mn)

    • 5.2.5 CANADA ENTERPRISE VIRTUAL REALITY MARKET

      • 5.2.5.1 Canada Enterprise Virtual Reality Market, By infrastructure Type, 2021 & 2030 ($ Mn)
      • 5.2.5.2 Canada Enterprise Virtual Reality Market By Hardware, 2020-2030 ($ Mn)
      • 5.2.5.3 Canada Enterprise Virtual Reality Market By Software, 2020-2030 ($ Mn)

    • 5.2.6 MEXICO ENTERPRISE VIRTUAL REALITY MARKET, 2020-2030 ($ Mn)

      • 5.2.6.1 Mexico Enterprise Virtual Reality Market By infrastructure Type, 2021 & 2030 ($ Mn)
      • 5.2.6.2 Mexico Enterprise Virtual Reality Market By Hardware, 2020 – 2030 ($ Mn)
      • 5.2.6.3 Mexico Enterprise Virtual Reality Market By Software, 2020-2030 ($ Mn)

  • 5.3 Europe Enterprise Virtual Reality Market Snapshot

    • 5.3.1 EUROPE ENTERPRISE VIRTUAL REALITY MARKET BY INFRASTRUCTURE TYPE, 2020 -2030 ($ Mn)
    • 5.3.2 EUROPE ENTERPRISE VIRTUAL REALITY MARKET BY HARDWARE, 2020-2030 ($ Mn)
    • 5.3.3 EUROPE ENTERPRISE VIRTUAL REALITY MARKET BY SOFTWARE, 2020-2030 ($ Mn)
    • 5.3.4 UNITED KINGDOM ENTERPRISE VIRTUAL REALITY MARKET

      • 5.3.4.1 United Kingdom Enterprise Virtual Reality Market By Infrastructure Type, 2020-2030 ($ Mn)
      • 5.3.4.2 United Kingdom Enterprise Virtual Reality Market By Hardware, 2020-2030 ($ Mn)
      • 5.3.4.3 United Kingdom Enterprise Virtual Reality Market By Software, 2020-2030 ($ Mn)

    • 5.3.5 FRANCE ENTERPRISE VIRTUAL REALITY MARKET

      • 5.3.5.1 France Enterprise Virtual Reality Market By Infrastructure Type, 2020-2030 ($ Mn)
      • 5.3.5.2 France Enterprise Virtual Reality Market By Hardware, 2020-2030 ($ Mn)
      • 5.3.5.3 France Enterprise Virtual Reality Market By Software, 2020-2030 ($ Mn)

    • 5.3.6 GERMANY ENTERPRISE VIRTUAL REALITY MARKET

      • 5.3.6.1 Germany Enterprise Virtual Reality Market By Infrastructure Type, 2020-2030 ($ Mn)
      • 5.3.6.2 Germany Enterprise Virtual Reality Market By Hardware, 2020-2030 ($ Mn)
      • 5.3.6.3 Germany Enterprise Virtual Reality Market By Software, 2020-2030 ($ Mn)

    • 5.3.7 NETHERLANDS ENTERPRISE VIRTUAL REALITY MARKET

      • 5.3.7.1 Netherlands Enterprise Virtual Reality Market By Infrastructure Type, 2020-2030 ($ Mn)
      • 5.3.7.2 Netherlands Enterprise Virtual Reality Market By Hardware, 2020-2030 ($ Mn)
      • 5.3.7.3 Netherlands Enterprise Virtual Reality Market By Software, 2020-2030 ($ Mn)

    • 5.3.8 ITALY ENTERPRISE VIRTUAL REALITY MARKET

      • 5.3.8.1 Italy Enterprise Virtual Reality Market By infrastructure Type, 2020-2030 ($ Mn)
      • 5.3.8.2 Italy Enterprise Virtual Reality Market By Hardware, 2020-2030 ($ Mn)
      • 5.3.8.3 Italy Enterprise Virtual Reality Market By Software, 2020-2030 ($ Mn)

    • 5.3.9 REST OF EUROPE ENTERPRISE VIRTUAL REALITY MARKET

      • 5.3.9.1 Rest of Europe Virtual Reality Market By Infrastructure Type, 2020-2030 ($ Mn)
      • 5.3.9.2 Rest of Europe Enterprise Virtual Reality Market By Hardware, 2020-2030 ($ Mn)
      • 5.3.9.3 Rest of Europe Enterprise Virtual Reality Market By Software, 2020-2030 ($ Mn)

  • 5.4 Asia-Pacific Enterprise Virtual Reality Market Snapshot

    • 5.4.1 ASIA-PACIFIC ENTERPRISE VIRTUAL REALITY MARKET BY INFRASTRUCTURE TYPE, 2020-2030 ($ Mn)
    • 5.4.2 ASIA-PACIFIC ENTERPRISE VIRTUAL REALITY MARKET BY HARDWARE, 2020-2030 ($ Mn)
    • 5.4.3 ASIA-PACIFIC ENTERPRISE VIRTUAL REALITY MARKET BY SOFTWARE, 2020-2030 ($ Mn)
    • 5.4.4 CHINA ENTERPRISE VIRTUAL REALITY MARKET

      • 5.4.4.1 China Enterprise Virtual Reality Market Size By Infrastructure Type, 2020-2030 ($ Mn)
      • 5.4.4.2 China Enterprise Virtual Reality Market By Hardware, 2020-2030 ($ Mn)
      • 5.4.4.3 China Enterprise Virtual Reality Market By Software, 2020-2030 ($ Mn)

    • 5.4.5 JAPAN ENTERPRISE VIRTUAL REALITY MARKET

      • 5.4.5.1 Japan Enterprise Virtual Reality Market by Infrastructure Type, 2020-2030 ($ Mn)
      • 5.4.5.2 Japan Enterprise Virtual Reality Market, By Hardware, 2020-2030 ($ Mn)
      • 5.4.5.3 Japan Enterprise Virtual Reality Market By Software, 2020-2030 ($ Mn)

    • 5.4.6 INDIA ENTERPRISE VIRTUAL REALITY MARKET

      • 5.4.6.1 India Enterprise Virtual Reality Market By Infrastructure Type, 2020-2030 ($ Mn)
      • 5.4.6.2 India Enterprise Virtual Reality Market By Hardware, 2020-2030 ($ Mn)
      • 5.4.6.3 India Enterprise Virtual Reality Market By Software, 2020-2030 ($ Mn)

    • 5.4.7 SOUTH KOREA ENTERPRISE VIRTUAL REALITY MARKET

      • 5.4.7.1 South Korea Enterprise Virtual Reality Market By Infrastructure Type, 2020-2030 ($ Mn)
      • 5.4.7.2 South Korea Enterprise Virtual Reality Market, By Hardware, 2020-2030 ($ Mn)
      • 5.4.7.3 South Korea Enterprise Virtual Reality Market By Software, 2020-2030 ($ Mn)

    • 5.4.8 AUSTRALIA ENTERPRISE VIRTUAL REALITY MARKET

      • 5.4.8.1 Australia Enterprise Virtual Reality Market By Infrastructure Type, 2020-2030 ($ Mn)
      • 5.4.8.2 Australia Enterprise Virtual Reality Market, By Hardware, 2020-2030 ($ Mn)
      • 5.4.8.3 Australia Enterprise Virtual Reality Market By Software, 2020-2030 ($ Mn)

    • 5.4.9 REST OF ASIA-PACIFIC ENTERPRISE VIRTUAL REALITY MARKET

      • 5.4.9.1 Rest of Asia-Pacific Enterprise Virtual Reality Market By Infrastructure Type, 2020-2030 ($ Mn)
      • 5.4.9.2 Rest of Asia-Pacific Enterprise Virtual Reality Market By Hardware, 2020-2030 ($ Mn)
      • 5.4.9.1 Rest of Asia-Pacific Enterprise Virtual Reality Market, By Software, 2020-2030 ($ Mn)

  • 5.5 Middle East & Africa Enterprise Virtual Reality Market Snapshot

    • 5.5.1 MIDDLE EAST & AFRICA ENTERPRISE VIRTUAL REALITY MARKET BY INFRASTRUCTURE TYPE, 2020-2030 ($ Mn)
    • 5.5.2 MIDDLE EAST & AFRICA ENTERPRISE VIRTUAL REALITY MARKET, BY HARDWARE, 2020-2030 ($ Mn)
    • 5.5.3 MIDDLE EAST & AFRICA ENTERPRISE VIRTUAL REALITY MARKET BY SOFTWARE, 2020-2030 ($ Mn)
    • 5.5.4 TURKEY ENTERPRISE VIRTUAL REALITY MARKET

      • 5.5.4.1 Turkey Enterprise Virtual Reality Market By Infrastructure Type, 2020-2030 ($ Mn)
      • 5.5.4.2 Turkey Enterprise Virtual Reality Market, By Hardware, 2020-2030 ($ Mn)
      • 5.5.4.3 Turkey Enterprise Virtual Reality Market By Software, 2020-2030 ($ Mn)

    • 5.5.5 SAUDI ARABIA ENTERPRISE VIRTUAL REALITY MARKET

      • 5.5.5.1 Saudi Arabia Enterprise Virtual Reality Market By Infrastructure Type, 2020-2030 ($ Mn)
      • 5.5.5.2 Saudi Arabia Enterprise Virtual Reality Market, By Hardware, 2020-2030 ($ Mn)
      • 5.5.5.3 Saudi Arabia Enterprise Virtual Reality Market By Software, 2020-2030 ($ Mn)

    • 5.5.6 SOUTH AFRICA ENTERPRISE VIRTUAL REALITY MARKET

      • 5.5.6.1 South Africa Enterprise Virtual Reality Market By Infrastructure Type, 2020-2030 ($ Mn)
      • 5.5.6.2 South Africa Enterprise Virtual Reality Market, By Hardware, 2020-2030 ($ Mn)
      • 5.5.6.3 South Africa Enterprise Virtual Reality Market By Software, 2020-2030 ($ Mn)

    • 5.5.7 UAE ENTERPRISE VIRTUAL REALITY MARKET

      • 5.5.7.1 UAE Enterprise Virtual Reality Market By Infrastructure Type, 2020-2030 ($ Mn)
      • 5.5.7.2 UAE Enterprise Virtual Reality Market, By Hardware, 2020-2030 ($ Mn)
      • 5.5.7.3 UAE Enterprise Virtual Reality Market By Software, 2020-2030 ($ Mn)

    • 5.5.8 REST OF MIDDLE EAST & AFRICA ENTERPRISE VIRTUAL REALITY MARKET

      • 5.5.8.1 Rest of Middle East & Africa Enterprise Virtual Reality Market By Infrastructure Type, 2020-2030 ($ Mn)
      • 5.5.8.2 Rest of Middle East & Africa Virtual Reality Market, By Hardware, 2020-2030 ($ Mn)
      • 5.5.8.3 Rest of Middle East & Africa Virtual Reality Market, By Software, 2020-2030 ($ Mn)

  • 5.6 South & Central America Enterprise Virtual Reality Market Snapshot

    • 5.6.1 BRAZIL ENTERPRISE VIRTUAL REALITY MARKET

      • 5.6.1.1 Brazil Enterprise Virtual Reality Market By Infrastructure Type, 2020-2030 ($ Mn)
      • 5.6.1.2 Brazil Enterprise Virtual Reality Market, By Hardware, 2020-2030 ($ Mn)
      • 5.6.1.3 Brazil Enterprise Virtual Reality Market By Software, 2020-2030 ($ Mn)

    • 5.6.2 CHILE ENTERPRISE VIRTUAL REALITY MARKET

      • 5.6.2.1 Chile Enterprise Virtual Reality Market By Infrastructure Type, 2020-2030 ($ Mn)
      • 5.6.2.2 Chile Enterprise Virtual Reality Market, By Hardware, 2020-2030 ($ Mn)
      • 5.6.2.3 Chile Enterprise Virtual Reality Market By Software, 2020-2030 ($ Mn)

    • 5.6.3 ARGENTINA ENTERPRISE VIRTUAL REALITY MARKET

      • 5.6.3.1 Argentina Enterprise Virtual Reality Market By Infrastructure Type, 2020-2030 ($ Mn)
      • 5.6.3.2 Argentina Enterprise Virtual Reality Market, By Hardware, 2020-2030 ($ Mn)
      • 5.6.3.3 Argentina Enterprise Virtual Reality Market By Software, 2020-2030 ($ Mn)

    • 5.6.4 REST OF SOUTH & CENTRAL AMERICA ENTERPRISE VIRTUAL REALITY MARKET

      • 5.6.4.1 Rest of South & Central America Enterprise Virtual Reality Market By Infrastructure Type, 2020-2030 ($ Mn)
      • 5.6.4.2 Rest of South & Central America Virtual Reality Market, By Hardware, 2020-2030 ($ Mn)
      • 5.6.4.3 Rest of South & Central America Virtual Reality Market, By Software, 2020-2030 ($ Mn)

  • 06. Consumer Virtual Reality Regional Outlook
  • 6.1 Consumer Virtual Reality – Regional Deep Dive
  • 6.2 North America Consumer Virtual Reality Market Snapshot

    • 6.2.1 NORTH AMERICA CONSUMER VIRTUAL REALITY MARKET, BY IT INFRASTRUCTURE, 2020-2030 ($ Mn)
    • 6.2.2 NORTH AMERICA CONSUMER VIRTUAL REALITY MARKET, BY HARDWARE, 2020-2030 ($ Mn)
    • 6.2.3 NORTH AMERICA CONSUMER VIRTUAL REALITY MARKET, BY SOFTWARE, 2020-2030 ($ Mn)
    • 6.2.4 US CONSUMER VIRTUAL REALITY MARKET

      • 6.2.4.1 US Consumer Virtual Reality Market By IT infrastructure, 2020-2030 ($ Mn)
      • 6.2.4.2 US Consumer Virtual Reality Market By Hardware, 2020-2030 ($ Mn)
      • 6.2.4.3 US Consumer Virtual Reality Market By Software, 2020-2030 ($ Mn)

    • 6.2.5 CANADA CONSUMER VIRTUAL REALITY MARKET

      • 6.2.5.1 Canada Consumer Virtual Reality Market By infrastructure Type, 2020-2030 ($ Mn)
      • 6.2.5.2 Canada Consumer Virtual Reality Market By Hardware, 2020-2030 ($ Mn)
      • 6.2.5.3 Canada Consumer Virtual Reality Market By Software, 2020-2030 ($ Mn)

    • 6.2.6 MEXICO CONSUMER VIRTUAL REALITY MARKET

      • 6.2.6.1 Mexico Consumer Virtual Reality Market By infrastructure Type, 2020-2030 ($ Mn)
      • 6.2.6.2 Mexico Consumer Virtual Reality Market By Hardware, 2020-2030 ($ Mn)
      • 6.2.6.3 Mexico Consumer Virtual Reality Market By Software, 2020-2030 ($ Mn)

  • 6.3 Europe Consumer Virtual Reality Market Snapshot

    • 6.3.1 EUROPE CONSUMER VIRTUAL REALITY MARKET, BY INFRASTRUCTURE TYPE, 2020-2030 ($ Mn)
    • 6.3.2 EUROPE CONSUMER VIRTUAL REALITY MARKET, BY HARDWARE, 2020-2030 ($ Mn)
    • 6.3.3 EUROPE CONSUMER VIRTUAL REALITY MARKET, BY SOFTWARE, 2020-2030 ($ Mn)
    • 6.3.4 UNITED KINGDOM CONSUMER VIRTUAL REALITY MARKET

      • 6.3.4.1 United Kingdom Consumer Virtual Reality Market, By Infrastructure Type, 2020-2030 ($ Mn)
      • 6.3.4.2 United Kingdom Consumer Virtual Reality Market By Hardware, 2020-2030 ($ Mn)
      • 6.3.4.3 United Kingdom Consumer Virtual Reality Market By Software, 2020-2030 ($ Mn)

    • 6.3.5 FRANCE CONSUMER VIRTUAL REALITY MARKET

      • 6.3.5.1 France Consumer Virtual Reality Market By Infrastructure Type, 2020-2030 ($ Mn)
      • 6.3.5.2 France Consumer Virtual Reality Market, By Hardware, 2020-2030 ($ Mn)
      • 6.3.5.3 France Consumer Virtual Reality Market, By Software, 2020-2030 ($ Mn)

    • 6.3.6 GERMANY CONSUMER VIRTUAL REALITY MARKET

      • 6.3.6.1 Germany Consumer Virtual Reality Market, By Infrastructure Type, 2020-2030 ($ Mn)
      • 6.3.6.2 Germany Consumer Virtual Reality Market, By Hardware, 2020-2030 ($ Mn)
      • 6.3.6.3 Germany Consumer Virtual Reality Market, By Software, 2020-2030 ($ Mn)

    • 6.3.7 NETHERLANDS CONSUMER VIRTUAL REALITY MARKET

      • 6.3.7.1 Netherlands Consumer Virtual Reality Market By Infrastructure Type, 2020-2030 ($ Mn)
      • 6.3.7.2 Netherlands Consumer Virtual Reality Market, By Hardware, 2020-2030 ($ Mn)
      • 6.3.7.3 Netherlands Consumer Virtual Reality Market, By Software, 2020-2030 ($ Mn)

    • 6.3.8 ITALY CONSUMER VIRTUAL REALITY MARKET

      • 6.3.8.1 Italy Consumer Virtual Reality Market By infrastructure Type, 2020-2030 ($ Mn)
      • 6.3.8.2 Italy Consumer Virtual Reality Market, By Hardware, 2020-2030 ($ Mn)
      • 6.3.8.3 Italy Consumer Virtual Reality Market By Software, 2020-2030 ($ Mn)

    • 6.3.9 REST OF EUROPE CONSUMER VIRTUAL REALITY MARKET

      • 6.3.9.1 Rest of Europe Consumer Virtual Reality Market By Infrastructure Type, 2020-2030 ($ Mn)
      • 6.3.9.2 Rest of Europe Consumer Virtual Reality Market, By Hardware, 2020-2030 ($ Mn)
      • 6.3.9.3 Rest of Europe Consumer Virtual Reality Market By Software, 2020-2030 ($ Mn)

  • 6.4 Asia-Pacific Consumer Virtual Reality Market Snapshot

    • 6.4.1 ASIA-PACIFIC CONSUMER VIRTUAL REALITY MARKET, BY INFRASTRUCTURE TYPE, 2020-2030 ($ Mn)
    • 6.4.2 ASIA-PACIFIC CONSUMER VIRTUAL REALITY MARKET, BY HARDWARE, 2020-2030 ($ Mn)
    • 6.4.3 ASIA-PACIFIC CONSUMER VIRTUAL REALITY MARKET BY SOFTWARE, 2020-2030 ($ Mn)
    • 6.4.4 CHINA CONSUMER VIRTUAL REALITY MARKET

      • 6.4.4.1 China Consumer Virtual Reality Market Size By Infrastructure Type, 2020-2030 ($ Mn)
      • 6.4.4.2 China Consumer Virtual Reality Market, By Hardware, 2020-2030 ($ Mn)
      • 6.4.4.3 China Consumer Virtual Reality Market By Software, 2020-2030 ($ Mn)

    • 6.4.5 JAPAN CONSUMER VIRTUAL REALITY MARKET

      • 6.4.5.1 Japan Consumer Virtual Reality Market by Infrastructure Type, 2020-2030 ($ Mn)
      • 6.4.5.2 Japan Consumer Virtual Reality Market, By Hardware, 2020-2030 ($ Mn)
      • 6.4.5.3 Japan Consumer Virtual Reality Market By Software, 2020-2030 ($ Mn)

    • 6.4.6 INDIA CONSUMER VIRTUAL REALITY MARKET

      • 6.4.6.1 India Consumer Virtual Reality Market By Infrastructure Type, 2020-2030 ($ Mn)
      • 6.4.6.2 India Consumer Virtual Reality Market, By Hardware, 2020-2030 ($ Mn)
      • 6.4.6.3 India Consumer Virtual Reality Market By Software, 2020-2030 ($ Mn)

    • 6.4.7 SOUTH KOREA CONSUMER VIRTUAL REALITY MARKET

      • 6.4.7.1 South Korea Consumer Virtual Reality Market By Infrastructure Type, 2020-2030 ($ Mn)
      • 6.4.7.2 South Korea Consumer Virtual Reality Market, By Hardware, 2020-2030 ($ Mn)
      • 6.4.7.3 South Korea Consumer Virtual Reality Market By Software, 2020-2030 ($ Mn)

    • 6.4.8 AUSTRALIA CONSUMER VIRTUAL REALITY MARKET

      • 6.4.8.1 Australia Consumer Virtual Reality Market By Infrastructure Type, 2020-2030 ($ Mn)
      • 6.4.8.2 Australia Consumer Virtual Reality Market, By Hardware, 2020-2030 ($ Mn)
      • 6.4.8.3 Australia Consumer Virtual Reality Market By Software, 2020-2030 ($ Mn)

    • 6.4.9 REST OF ASIA-PACIFIC CONSUMER VIRTUAL REALITY MARKET

      • 6.4.9.1 Rest of Asia-Pacific Consumer Virtual Reality Market By Infrastructure Type, 2020-2030 ($ Mn)
      • 6.4.9.2 Rest of Asia-Pacific Consumer Virtual Reality Market, By Hardware, 2020-2030 ($ Mn)
      • 6.4.9.3 Rest of Asia-Pacific Consumer Virtual Reality Market, By Software, 2020-2030 ($ Mn)

  • 6.5 Middle East & Africa Consumer Virtual Reality Market Snapshot

    • 6.5.1 MIDDLE EAST & AFRICA CONSUMER VIRTUAL REALITY MARKET BY INFRASTRUCTURE TYPE, 2020-2030 ($ Mn)
    • 6.5.2 MIDDLE EAST & AFRICA CONSUMER VIRTUAL REALITY MARKET, BY HARDWARE, 2020-2030 ($ Mn)
    • 6.5.3 MIDDLE EAST & AFRICA CONSUMER VIRTUAL REALITY MARKET BY SOFTWARE, 2020-2030 ($ Mn)
    • 6.5.4 TURKEY CONSUMER VIRTUAL REALITY MARKET

      • 6.5.4.1 Turkey Consumer Virtual Reality Market By Infrastructure Type, 2020-2030 ($ Mn)
      • 6.5.4.2 Turkey Consumer Virtual Reality Market, By Hardware, 2020-2030 ($ Mn)
      • 6.5.4.3 Turkey Consumer Virtual Reality Market By Software, 2020-2030 ($ Mn)

    • 6.5.5 SAUDI ARABIA CONSUMER VIRTUAL REALITY MARKET

      • 6.5.5.1 Saudi Arabia Consumer Virtual Reality Market By Infrastructure Type, 2020-2030 ($ Mn)
      • 6.5.5.2 Saudi Arabia Consumer Virtual Reality Market, By Hardware, 2020-2030 ($ Mn)
      • 6.5.5.3 Saudi Arabia Consumer Virtual Reality Market By Software, 2020-2030 ($ Mn)

    • 6.5.6 SOUTH AFRICA CONSUMER VIRTUAL REALITY MARKET

      • 6.5.6.1 South Africa Consumer Virtual Reality Market By Infrastructure Type, 2020-2030 ($ Mn)
      • 6.5.6.2 South Africa Consumer Virtual Reality Market, By Hardware, 2020-2030 ($ Mn)
      • 6.5.6.3 South Africa Consumer Virtual Reality Market By Software, 2020-2030 ($ Mn)

    • 6.5.7 UAE CONSUMER VIRTUAL REALITY MARKET

      • 6.5.7.1 UAE Consumer Virtual Reality Market By Infrastructure Type, 2020-2030 ($ Mn)
      • 6.5.7.2 UAE Consumer Virtual Reality Market, By Hardware, 2020-2030 ($ Mn)
      • 6.5.7.3 UAE Consumer Virtual Reality Market By Software, 2020-2030 ($ Mn)

    • 6.5.8 Rest of Middle East & AFRICA CONSUMER VIRTUAL REALITY MARKET

      • 6.5.8.1 Rest of Middle East & Africa Consumer Virtual Reality Market By Infrastructure Type, 2020-2030 ($ Mn)
      • 6.5.8.2 Rest of Middle East & Africa Consumer Virtual Reality Market, By Hardware, 2020-2030 ($ Mn)
      • 6.5.8.3 Rest of Middle East & Africa Consumer Virtual Reality Market, By Software, 2020-2030 ($ Mn)

  • 6.6 South & Central America Consumer Virtual Reality Market Snapshot

    • 6.6.1 SOUTH & CENTRAL AMERICA CONSUMER VIRTUAL REALITY MARKET BY INFRASTRUCTURE TYPE, 2020-2030 ($ Mn)
    • 6.6.2 SOUTH & CENTRAL AMERICA CONSUMER VIRTUAL REALITY MARKET, BY HARDWARE, 2020-2030 ($ Mn)
    • 6.6.3 SOUTH & CENTRAL AMERICA CONSUMER VIRTUAL REALITY MARKET BY SOFTWARE, 2020-2030 ($ Mn)
    • 6.6.4 BRAZIL CONSUMER VIRTUAL REALITY MARKET

      • 6.6.4.1 Brazil Consumer Virtual Reality Market By Infrastructure Type, 2020-2030 ($ Mn)
      • 6.6.4.2 Brazil Consumer Virtual Reality Market, By Hardware, 2020-2030 ($ Mn)
      • 6.6.4.3 Brazil Consumer Virtual Reality Market By Software, 2020-2030 ($ Mn)

    • 6.6.5 CHILE CONSUMER VIRTUAL REALITY MARKET

      • 6.6.5.1 Chile Consumer Virtual Reality Market By Infrastructure Type, 2020-2030 ($ Mn)
      • 6.6.5.2 Chile Consumer Virtual Reality Market, By Hardware, 2020-2030 ($ Mn)
      • 6.6.5.3 Chile Consumer Virtual Reality Market By Software, 2020-2030 ($ Mn)

    • 6.6.6 ARGENTINA CONSUMER VIRTUAL REALITY MARKET

      • 6.6.6.1 Argentina Consumer Virtual Reality Market By Infrastructure Type, 2020-2030 ($ Mn)
      • 6.6.6.2 Argentina Consumer Virtual Reality Market, By Hardware, 2020-2030 ($ Mn)
      • 6.6.6.3 Argentina Consumer Virtual Reality Market By Software, 2020-2030 ($ Mn)

    • 6.6.7 REST OF SOUTH & CENTRAL AMERICA CONSUMER VIRTUAL REALITY MARKET

      • 6.6.7.1 Rest of South & Central America Consumer Virtual Reality Market By Infrastructure Type, 2020-2030 ($ Mn)
      • 6.6.7.2 Rest of South & Central America Consumer Virtual Reality Market, By Hardware, 2020-2030 ($ Mn)
      • 6.6.7.3 Rest of South & Central America Consumer Virtual Reality Market, By Software, 2020-2030 ($ Mn)

  • 07. Global Virtual Reality Competitive Landscape
  • 7.1 Virtual Reality Competitive Analysis
  • 7.2 Key Virtual Reality Vendor Profiles

    • 7.2.1 META PLATFORMS INC.

      • 7.2.1.1 Company Overview and Financial Performance
      • 7.2.1.1 Recent Developments and Innovations

    • 7.2.2 GOERTEK INC.

      • 7.2.2.1 Company Overview and Financial Performance
      • 7.2.2.2 Recent Developments and Innovations

    • 7.2.3 GOOGLE LLC

      • 7.2.3.1 Company Overview and Financial Performance
      • 7.2.3.2 Recent Developments and Innovations

    • 7.2.4 SAMSUNG ELECTRONICS CO LTD.

      • 7.2.4.1 Company Overview and Financial Performance
      • 7.2.4.2 Recent Developments and Innovations

    • 7.2.5 NVIDIA CORP

      • 7.2.5.1 Company Overview and Financial Performance
      • 7.2.5.2 Recent Developments and Innovations

    • 7.2.6 MICROSOFT CORP.

      • 7.2.6.1 Company Overview and Financial Performance
      • 7.2.6.2 Recent Developments and Innovations

    • 7.2.7 SPECTRA7 MICROSYSTEMS INC.

      • 7.2.7.1 Company Overview and Financial Performance
      • 7.2.7.2 Recent Developments and Innovations

    • 7.2.8 UNITY TECHNOLOGIES INC.

      • 7.2.8.1 Company Overview and Financial Performance
      • 7.2.8.2 Recent Developments and Innovations

    • 7.2.9 HTC CORP.

      • 7.2.9.1 Company Overview and Financial Performance
      • 7.2.9.2 Recent Developments and Innovations

    • 7.2.10 SUNNY OPTICAL TECHNOLOGY CO LTD.

      • 7.2.10.1 Company Overview and Financial Performance

  • 7.3 Other Major Players in the Virtual Reality Market

    • 7.3.1 WIMI HOLOGRAM CLOUD INC
    • 7.3.2 ONE DIGITAL NATION
    • 7.3.3 IMMERSION MEDICAL
    • 7.3.4 VIOTEK
    • 7.3.5 VIRONIT
    • 7.3.6 NINEHERTZ
    • 7.3.7 ITECHART
    • 7.3.8 OCULUS VR
    • 7.3.9 GROOVE JONES
    • 7.3.10 WORLDVIZ LLC
    • 7.3.11 SCIENCESOFT USA CORPORATION
    • 7.3.12 VRMAGIC, INC.
    • 7.3.13 POCKETCAKE
    • 7.3.14 BRICKS & GOGGLES
    • 7.3.15 RETINAD ANALYTICS
    • 7.3.16 OWLCHEMY LABS
    • 7.3.17 APPLE INC
    • 7.3.18 BOSCH
    • 7.3.19 HUAWEI TECHNOLOGIES CO LTD
    • 7.3.20 MEDIATEK INC

  • 08. Methodology and Scope
  • 8.1 Information Procurement
  • 8.2 Virtual Reality Analysis
  • 8.3 Market Opportunity Forecast – Research Methodology & Formulation
  • 8.4 Additional Resources

    • 8.4.1 MARKET DEFINITIONS – PRODUCT/SERVICE SEGMENTS

  • Contact Us
  • List of Tables
  • Table 1 Key Trends Overview
  • Table 2 Global Virtual Reality Market By Type, 2020 – 2030 ($Bn)
  • Table 3 North America Virtual Reality Market By IT Infrastructure, 2020 – 2030 ($Mn)
  • Table 4 US Enterprise Virtual Reality Market By Infrastructure Type, 2020 – 2030 ($ Mn)
  • Table 5 Canada Enterprise Virtual Reality Market By Infrastructure Type, 2020 – 2030 ($Mn)
  • Table 6 Mexico Enterprise Virtual Reality Market By Infrastructure Type, 2020 – 2030 ($Mn)
  • Table 7 Europe Enterprise Virtual Reality Market By Infrastructure Type, 2020 – 2030 ($ Mn)
  • Table 8 United Kingdom Enterprise Virtual Reality Market By Infrastructure Type, 2020 – 2030 ($ Mn)
  • Table 9 France Enterprise Virtual Reality Market By Infrastructure Type, 2020 – 2030 ($ Mn)
  • Table 10 Germany Enterprise Virtual Reality Market By Infrastructure Type, 2020 – 2030 ($Mn)
  • Table 11 Netherlands Enterprise Virtual Reality Market By Infrastructure Type, 2020 – 2030 ($ Mn)
  • Table 12 Italy Enterprise Virtual Reality Market By infrastructure Type, 2020 – 2030 ($ Mn)
  • Table 13 Rest of Europe Enterprise Virtual Reality Market By Infrastructure Type, 2020 – 2030 ($ Mn)
  • Table 14 Asia-Pacific Enterprise Virtual Reality Market By Infrastructure Type, 2020 – 2030 ($ Mn)
  • Table 15 China Enterprise Virtual Reality Market By Infrastructure Type, 2020 – 2030 ($ Mn)
  • Table 16 Japan Enterprise Virtual Reality Market By Infrastructure Type, 2020 – 2030 ($ Mn)
  • Table 17 India Enterprise Virtual Reality Market By Infrastructure Type, 2020 – 2030 ($ Mn)
  • Table 18 South Korea Enterprise Virtual Reality Market By Infrastructure Type, 2020 – 2030 ($ Mn)
  • Table 19 Australia Enterprise Virtual Reality Market By Infrastructure Type, 2020 – 2030 ($ Mn)
  • Table 20 Rest of Asia-Pacific Enterprise Virtual Reality Market By Infrastructure Type, 2020 – 2030 ($ Mn)
  • Table 21 Middle East & Africa Enterprise Virtual Reality Market By Infrastructure Type, 2020 – 2030 ($ Mn)
  • Table 22 Turkey Enterprise Virtual Reality Market By Infrastructure Type, 2020 – 2030 ($ Mn)
  • Table 23 Saudi Arabia Enterprise Virtual Reality Market By Infrastructure Type, 2020 – 2030 ($ Mn)
  • Table 24 South Africa Enterprise Virtual Reality Market By Infrastructure Type, 2020 – 2030 ($ Mn)
  • Table 25 UAE Enterprise Virtual Reality Market By Infrastructure Type, 2020 – 2030 ($ Mn)
  • Table 26 Rest of Middle East & Africa Virtual Reality Market By Infrastructure Type, 2020 – 2030 ($ Mn)
  • Table 27 Brazil Enterprise Virtual Reality Market By Infrastructure Type, 2020 – 2030 ($ Mn)
  • Table 28 Chile Enterprise Virtual Reality Market By Infrastructure Type, 2020 – 2030 ($ Mn)
  • Table 29 Argentina Enterprise Virtual Reality Market By Infrastructure Type, 2020 – 2030 ($ Mn)
  • Table 30 Rest of South & Central America Virtual Reality Market By Infrastructure Type, 2020 – 2030 ($ Mn)
  • Table 31 North America Consumer Virtual Reality Market By IT Infrastructure, 2020 – 2030 ($Mn)
  • Table 32 North America Consumer Virtual Reality Market By Software, 2020 – 2030 ($Mn)
  • Table 33 US Consumer Virtual Reality Market By Infrastructure Type, 2020 – 2030 ($ Mn)
  • Table 34 US Consumer Virtual Reality Market By Infrastructure Type, 2020 – 2030 ($ Mn)
  • Table 35 Canada Consumer Virtual Reality Market By Infrastructure Type, 2020 – 2030 ($Mn)
  • Table 36 Canada Consumer Virtual Reality Market By Software, 2020 – 2030 ($ Mn)
  • Table 37 Mexico Consumer Virtual Reality Market By Infrastructure Type, 2020 – 2030 ($Mn)
  • Table 38 Mexico Consumer Virtual Reality Market By Software, 2020 – 2030 ($ Mn)
  • Table 39 Europe Consumer Virtual Reality Market By Infrastructure Type, 2020 – 2030 ($ Mn)
  • Table 40 Europe Consumer Virtual Reality Market By Infrastructure Type, 2020 – 2030 ($ Mn)
  • Table 41 United Kingdom Consumer Virtual Reality Market, By Infrastructure Type, 2020 – 2030 ($ Mn)
  • Table 42 United Kingdom Consumer Virtual Reality Market By Software, 2020 – 2030 ($ Mn)
  • Table 43 France Consumer Virtual Reality Market By Infrastructure Type, 2020 – 2030 ($ Mn)
  • Table 44 France Consumer Virtual Reality Market By Software, 2020 – 2030 ($ Mn)
  • Table 45 Germany Consumer Virtual Reality Market By Infrastructure Type, 2020 – 2030 ($Mn)
  • Table 46 Germany Consumer Virtual Reality Market By Software, 2020 – 2030 ($ Mn)
  • Table 47 Netherlands Consumer Virtual Reality Market By Infrastructure Type, 2020 – 2030 ($ Mn)
  • Table 48 Netherlands Consumer Virtual Reality Market By Software, 2020 – 2030 ($ Mn)
  • Table 49 Italy Consumer Virtual Reality Market By infrastructure Type, 2020 – 2030 ($ Mn)
  • Table 50 Italy Consumer Virtual Reality Market By Software, 2020 – 2030 ($ Mn)
  • Table 51 Rest of Europe Consumer Virtual Reality Market By Infrastructure Type, 2020 – 2030 ($ Mn)
  • Table 52 Rest of Europe Consumer Virtual Reality Market By Software, 2020 – 2030 ($ Mn)
  • Table 53 Asia-Pacific Consumer Virtual Reality Market By Infrastructure Type, 2020 – 2030 ($ Mn)
  • Table 54 Asia-Pacific Consumer Virtual Reality Market By Software, 2020 – 2030 ($ Mn)
  • Table 55 China Consumer Virtual Reality Market By Infrastructure Type, 2020 – 2030 ($ Mn)
  • Table 56 China Consumer Virtual Reality Market By

Table

Table 1 Key Trends Overview

Table 2 Global Virtual Reality Market By Type, 2020 – 2030 ($Bn)

Table 3 North America Virtual Reality Market By IT Infrastructure, 2020 – 2030 ($Mn)

Table 4 US Enterprise Virtual Reality Market By Infrastructure Type, 2020 – 2030 ($ Mn)

Table 5 Canada Enterprise Virtual Reality Market By Infrastructure Type, 2020 – 2030 ($Mn)

Table 6 Mexico Enterprise Virtual Reality Market By Infrastructure Type, 2020 – 2030 ($Mn)

Table 7 Europe Enterprise Virtual Reality Market By Infrastructure Type, 2020 – 2030 ($ Mn)

Table 8 United Kingdom Enterprise Virtual Reality Market By Infrastructure Type, 2020 – 2030 ($ Mn)

Table 9 France Enterprise Virtual Reality Market By Infrastructure Type, 2020 – 2030 ($ Mn)

Table 10 Germany Enterprise Virtual Reality Market By Infrastructure Type, 2020 – 2030 ($Mn)

Table 11 Netherlands Enterprise Virtual Reality Market By Infrastructure Type, 2020 – 2030 ($ Mn)

Table 12 Italy Enterprise Virtual Reality Market By infrastructure Type, 2020 – 2030 ($ Mn)

Table 13 Rest of Europe Enterprise Virtual Reality Market By Infrastructure Type, 2020 – 2030 ($ Mn)

Table 14 Asia-Pacific Enterprise Virtual Reality Market By Infrastructure Type, 2020 – 2030 ($ Mn)

Table 15 China Enterprise Virtual Reality Market By Infrastructure Type, 2020 – 2030 ($ Mn)

Table 16 Japan Enterprise Virtual Reality Market By Infrastructure Type, 2020 – 2030 ($ Mn)

Table 17 India Enterprise Virtual Reality Market By Infrastructure Type, 2020 – 2030 ($ Mn)

Table 18 South Korea Enterprise Virtual Reality Market By Infrastructure Type, 2020 – 2030 ($ Mn)

Table 19 Australia Enterprise Virtual Reality Market By Infrastructure Type, 2020 – 2030 ($ Mn)

Table 20 Rest of Asia-Pacific Enterprise Virtual Reality Market By Infrastructure Type, 2020 – 2030 ($ Mn)

Table 21 Middle East & Africa Enterprise Virtual Reality Market By Infrastructure Type, 2020 – 2030 ($ Mn)

Table 22 Turkey Enterprise Virtual Reality Market By Infrastructure Type, 2020 – 2030 ($ Mn)

Table 23 Saudi Arabia Enterprise Virtual Reality Market By Infrastructure Type, 2020 – 2030 ($ Mn)

Table 24 South Africa Enterprise Virtual Reality Market By Infrastructure Type, 2020 – 2030 ($ Mn)

Table 25 UAE Enterprise Virtual Reality Market By Infrastructure Type, 2020 – 2030 ($ Mn)

Table 26 Rest of Middle East & Africa Virtual Reality Market By Infrastructure Type, 2020 – 2030 ($ Mn)

Table 27 Brazil Enterprise Virtual Reality Market By Infrastructure Type, 2020 – 2030 ($ Mn)

Table 28 Chile Enterprise Virtual Reality Market By Infrastructure Type, 2020 – 2030 ($ Mn)

Table 29 Argentina Enterprise Virtual Reality Market By Infrastructure Type, 2020 – 2030 ($ Mn)

Table 30 Rest of South & Central America Virtual Reality Market By Infrastructure Type, 2020 – 2030 ($ Mn)

Table 31 North America Consumer Virtual Reality Market By IT Infrastructure, 2020 – 2030 ($Mn)

Table 32 North America Consumer Virtual Reality Market By Software, 2020 – 2030 ($Mn)

Table 33 US Consumer Virtual Reality Market By Infrastructure Type, 2020 – 2030 ($ Mn)

Table 34 US Consumer Virtual Reality Market By Infrastructure Type, 2020 – 2030 ($ Mn)

Table 35 Canada Consumer Virtual Reality Market By Infrastructure Type, 2020 – 2030 ($Mn)

Table 36 Canada Consumer Virtual Reality Market By Software, 2020 – 2030 ($ Mn)

Table 37 Mexico Consumer Virtual Reality Market By Infrastructure Type, 2020 – 2030 ($Mn)

Table 38 Mexico Consumer Virtual Reality Market By Software, 2020 – 2030 ($ Mn)

Table 39 Europe Consumer Virtual Reality Market By Infrastructure Type, 2020 – 2030 ($ Mn)

Table 40 Europe Consumer Virtual Reality Market By Infrastructure Type, 2020 – 2030 ($ Mn)

Table 41 United Kingdom Consumer Virtual Reality Market, By Infrastructure Type, 2020 – 2030 ($ Mn)

Table 42 United Kingdom Consumer Virtual Reality Market By Software, 2020 – 2030 ($ Mn)

Table 43 France Consumer Virtual Reality Market By Infrastructure Type, 2020 – 2030 ($ Mn)

Table 44 France Consumer Virtual Reality Market By Software, 2020 – 2030 ($ Mn)

Table 45 Germany Consumer Virtual Reality Market By Infrastructure Type, 2020 – 2030 ($Mn)

Table 46 Germany Consumer Virtual Reality Market By Software, 2020 – 2030 ($ Mn)

Table 47 Netherlands Consumer Virtual Reality Market By Infrastructure Type, 2020 – 2030 ($ Mn)

Table 48 Netherlands Consumer Virtual Reality Market By Software, 2020 – 2030 ($ Mn)

Table 49 Italy Consumer Virtual Reality Market By infrastructure Type, 2020 – 2030 ($ Mn)

Table 50 Italy Consumer Virtual Reality Market By Software, 2020 – 2030 ($ Mn)

Table 51 Rest of Europe Consumer Virtual Reality Market By Infrastructure Type, 2020 – 2030 ($ Mn)

Table 52 Rest of Europe Consumer Virtual Reality Market By Software, 2020 – 2030 ($ Mn)

Table 53 Asia-Pacific Consumer Virtual Reality Market By Infrastructure Type, 2020 – 2030 ($ Mn)

Table 54 Asia-Pacific Consumer Virtual Reality Market By Software, 2020 – 2030 ($ Mn)

Table 55 China Consumer Virtual Reality Market By Infrastructure Type, 2020 – 2030 ($ Mn)

Table 56 China Consumer Virtual Reality Market By Software, 2020 – 2030 ($ Mn)

Table 57 Japan Consumer Virtual Reality Market By Infrastructure Type, 2020 – 2030 ($ Mn)

Table 58 Japan Consumer Virtual Reality Market By Software, 2020 – 2030 ($ Mn)

Table 59 India Consumer Virtual Reality Market By Infrastructure Type, 2020 – 2030 ($ Mn)

Table 60 India Consumer Virtual Reality Market By Software, 2020 – 2030 ($ Mn)

Table 61 South Korea Consumer Virtual Reality Market By Infrastructure Type, 2020 – 2030 ($ Mn)

Table 62 South Korea Consumer Virtual Reality Market By Software, 2020 – 2030 ($ Mn)

Table 63 Australia Consumer Virtual Reality Market By Infrastructure Type, 2020 – 2030 ($ Mn)

Table 64 Australia Consumer Virtual Reality Market By Software, 2020 – 2030 ($ Mn)

Table 65 Rest of Asia-Pacific Consumer Virtual Reality Market By Infrastructure Type, 2020 – 2030 ($ Mn)

Table 66 Rest of Asia-Pacific Consumer Virtual Reality Market By Software, 2020 – 2030 ($ Mn)

Table 67 Middle East & Africa Consumer Virtual Reality Market By Infrastructure Type, 2020 – 2030 ($ Mn)

Table 68 Middle East & Africa Consumer Virtual Reality Market By Software, 2020 – 2030 ($ Mn)

Table 69 Turkey Consumer Virtual Reality Market By Infrastructure Type, 2020 – 2030 ($ Mn)

Table 70 Turkey Consumer Virtual Reality Market By Software, 2020 – 2030 ($ Mn)

Table 71 Saudi Arabia Enterprise Virtual Reality Market By Infrastructure Type, 2020 – 2030 ($ Mn)

Table 72 Saudi Arabia Consumer Virtual Reality Market By Software, 2020 – 2030 ($ Mn)

Table 73 South Africa Consumer Virtual Reality Market By Infrastructure Type, 2020 – 2030 ($ Mn)

Table 74 South Africa Consumer Virtual Reality Market By Software, 2020 – 2030 ($ Mn)

Table 75 UAE Consumer Virtual Reality Market By Infrastructure Type, 2020 – 2030 ($ Mn)

Table 76 UAE Consumer Virtual Reality Market By Software, 2020 – 2030 ($ Mn)

Table 77 Rest of Middle East & Africa Consumer Virtual Reality Market By Infrastructure Type, 2020 – 2030 ($ Mn)

Table 78 Rest of Middle East & Africa Consumer Virtual Reality Market By Software, 2020 – 2030 ($ Mn)

Table 79 South & Central America Consumer Virtual Reality Market By Infrastructure Type, 2020 – 2030 ($ Mn)

Table 80 South & Central America Consumer Virtual Reality Market By Software, 2020 – 2030 ($ Mn)

Table 81 Brazil Consumer Virtual Reality Market By Infrastructure Type, 2020 – 2030 ($ Mn)

Table 82 Brazil Consumer Virtual Reality Market By Software, 2020 – 2030 ($ Mn)

Table 83 Chile Consumer Virtual Reality Market By Infrastructure Type, 2020 – 2030 ($ Mn)

Table 84 Chile Consumer Virtual Reality Market By Software, 2020 – 2030 ($ Mn)

Table 85 Argentina Consumer Virtual Reality Market By Infrastructure Type, 2020 – 2030 ($ Mn)

Table 86 Argentina Consumer Virtual Reality Market By Software, 2020 – 2030 ($ Mn)

Table 87 Rest of South & Central America Virtual Reality Market By Infrastructure Type, 2020 – 2030 ($ Mn)

Table 88 Rest of South & Central America Virtual Reality Market By Infrastructure Type, 2020 – 2030 ($ Mn)

Figures

Fig.1 Virtual Reality Market Snapshot

Fig.2 Virtual Reality Market Segmentation

Fig.3 Virtual Reality Industry value chain analysis

Fig.4 Global Virtual Reality PORTER’s Five Force Analysis

Fig.5 Virtual Reality Market – Key Drivers Impact Analysis

Fig.6 Virtual Reality– Key Market Challenges/Impediments Impact Analysis

Fig.7 Virtual Reality– M&A Activity Dashboard

Fig.8 Virtual Reality– Patent Activity Dashboard

Fig.9 Virtual Reality– Job Analytics Dashboard

Fig.10 Virtual Reality – Venture Financing Dashboard

Fig.11 Virtual Reality– Social Media Analytics Dashboard

Fig.12 Global Virtual Reality (VR) Market – Revenue Opportunity Forecast, 2020-2030 (US$ Billion)

Fig.13 Global Virtual Reality Market By Type, 2020-2030 (US$ Billion)

Fig.14 Virtual Reality Market By IT Infrastructure, 2020-2030 (US$ Million)

Fig.15 Enterprise Virtual Reality– Market Overview

Fig.16 North America Enterprise Virtual Reality Market Snapshot

Fig.17 North America Enterprise Virtual Reality By Hardware – 2020 – 2030 ($ Mn)

Fig.18 North America Enterprise Virtual Reality Market By Software – 2020 – 2030 ($ Mn)

Fig.19 US Virtual Reality Market by IT Infrastructure – 2021 & 2030 ($ Mn)

Fig.20 US Enterprise Virtual Reality Market by Hardware – 2020 – 2030 ($ Mn)

Fig.21 US Enterprise Virtual Reality Market by Software – 2020 – 2030 ($ Mn)

Fig.22 Canada Enterprise Virtual Reality Market by Infrastructure Type – 2021 & 2030 ($ Mn)

Fig.23 Canada Enterprise Virtual Reality Market by Hardware – 2020 – 2030 ($ Mn)

Fig.24 Canada Enterprise Virtual Reality Market by Software – 2020 – 2030 ($ Mn)

Fig.25 Mexico Enterprise Virtual Reality Market by Infrastructure Type – 2021 & 2030 ($ Mn)

Fig.26 Mexico Enterprise Virtual Reality Market by Hardware – 2020 – 2030 ($ Mn)

Fig.27 Mexico Enterprise Virtual Reality Market by Software – 2020 – 2030 ($ Mn)

Fig.28 Europe Enterprise Virtual Reality Market Snapshot

Fig.29 Europe Enterprise Virtual Reality Market By Hardware – 2020 – 2030 ($ Mn)

Fig.30 Europe Virtual Reality Market By Software – 2021 & 2030 ($ Mn)

Fig.31 United Kingdom Enterprise Virtual Reality By Infrastructure Type – 2021 & 2030 ($ Mn)

Fig.32 United Kingdom Enterprise Virtual Reality Market By Hardware – 2020 – 2030 ($ Mn)

Fig.33 United Kingdom Enterprise Virtual Reality Market By Software – 2020 – 2030 ($ Mn)

Fig.34 France Enterprise Virtual Reality Market by Infrastructure Type – 2021 & 2030 ($ Mn)

Fig.35 France Enterprise Virtual Reality Market By Hardware – 2020 – 2030 ($ Mn)

Fig.36 France Enterprise Virtual Reality Market By Software – 2020 – 2030 ($ Mn)

Fig.37 Germany Enterprise Virtual Reality By Infrastructure Type – 2021 & 2030 ($ Mn)

Fig.38 Germany Enterprise Virtual Reality Market By Hardware – 2020 – 2030 ($ Mn)

Fig.39 Germany Enterprise Virtual Reality Market By Software – 2020 – 2030 ($ Mn)

Fig.40 Netherlands Enterprise Virtual Reality Market By Infrastructure Type – 2021 & 2030 ($ Mn)

Fig.41 Netherlands Enterprise Virtual Reality Market By Hardware – 2020 – 2030 ($ Mn)

Fig.42 Netherlands Enterprise Virtual Reality Market By Software – 2020 – 2030 ($ Mn)

Fig.43 Italy Enterprise Virtual Reality Market By Infrastructure Type – 2021 & 2030 ($ Mn)

Fig.44 Italy Enterprise Virtual Reality By Hardware – 2020 – 2030 ($ Mn)

Fig.45 Italy Enterprise Virtual Reality Market By Software – 2020 – 2030 ($ Mn)

Fig.46 Rest of Europe Enterprise Virtual Reality Market By Infrastructure Type – 2021 & 2030 ($ Mn)

Fig.47 Rest of Europe Enterprise Virtual Reality Market By Hardware – 2020 – 2030 ($ Mn)

Fig.48 Rest of Europe Enterprise Virtual Reality Market By Software – 2020 – 2030 ($ Mn)

Fig.49 Asia-Pacific Enterprise Virtual Reality Market Snapshot

Fig.50 Asia-Pacific Enterprise Virtual Reality Market By Hardware – 2020 – 2030 ($ Mn)

Fig.51 South & Central America Enterprise Virtual Reality Market By Software – 2020 – 2030 ($ Mn)

Fig.52 China Enterprise Virtual Reality Market By Infrastructure Type – 2021 & 2030 ($ Mn)

Fig.53 China Enterprise Virtual Reality Market, By Hardware – 2020 – 2030 ($ Mn)

Fig.54 China Enterprise Virtual Reality Market By Software– 2020 – 2030 ($ Mn)

Fig.55 Japan Enterprise Virtual Reality Market By Hardware – 2021 & 2030 ($ Mn)

Fig.56 Japan Enterprise Virtual Reality Market By Hardware – 2020 – 2030 ($ Mn)

Fig.57 Japan Enterprise Virtual Reality Market By Software – 2020 – 2030 ($ Mn)

Fig.58 India Enterprise Virtual Reality Market By Infrastructure Type – 2021 & 2030 ($ Mn)

Fig.59 India Enterprise Virtual Reality Market By Hardware – 2020 – 2030 ($ Mn)

Fig.60 India Enterprise Virtual Reality Market By Software – 2020 – 2030 ($ Mn)

Fig.61 South Korea Enterprise Virtual Reality Market By Infrastructure Type – 2021 & 2030 ($ Mn)

Fig.62 South Korea Enterprise Virtual Reality Market By Hardware – 2020 – 2030 ($ Mn)

Fig.63 South Korea Enterprise Virtual Reality Market By Software – 2020 – 2030 ($ Mn)

Fig.64 Australia Enterprise Virtual Reality Market By Infrastructure Type – 2021 & 2030 ($ Mn)

Fig.65 Australia Enterprise Virtual Reality Market By Hardware – 2020 – 2030 ($ Mn)

Fig.66 Australia Enterprise Virtual Reality Market By Software – 2020 – 2030 ($ Mn)

Fig.67 Rest of Asia-Pacific Enterprise Virtual Reality By Infrastructure Type – 2021 & 2030 ($ Mn)

Fig.68 Rest of Asia-Pacific Enterprise Virtual Reality Market By Hardware – 2020 – 2030 ($ Mn)

Fig.69 Rest of Asia-Pacific Enterprise Virtual Reality Market By Software – 2020 – 2030 ($ Mn)

Fig.70 Middle East & Africa Enterprise Virtual Reality Market Snapshot

Fig.71 Middle East & Africa Enterprise Virtual Reality Market, By Hardware – 2020 – 2030 ($ Mn)

Fig.72 Middle East & Africa Enterprise Virtual Reality Market By Software – 2020 – 2030 ($ Mn)

Fig.73 Turkey Enterprise Virtual Reality Market By Infrastructure Type – 2021 & 2030 ($ Mn)

Fig.74 Turkey Enterprise Virtual Reality Market, By Hardware – 2020 – 2030 ($ Mn)

Fig.75 Turkey Enterprise Virtual Reality Market By Software – 2020 – 2030 ($ Mn)

Fig.76 Saudi Arabia Enterprise Virtual Reality Market By Infrastructure Type – 2021 & 2030 ($ Mn)

Fig.77 Saudi Arabia Enterprise Virtual Reality Market, By Hardware – 2020 – 2030 ($ Mn)

Fig.78 Saudi Arabia Enterprise Virtual Reality Market By Software – 2020 – 2030 ($ Mn)

Fig.79 South Africa Enterprise Virtual Reality Market By Infrastructure Type – 2021 & 2030 ($ Mn)

Fig.80 South Africa Enterprise Virtual Reality Market, By Hardware – 2020 – 2030 ($ Mn)

Fig.81 South Africa Enterprise Virtual Reality Market By Software – 2020 – 2030 ($ Mn)

Fig.82 UAE Enterprise Virtual Reality Market By Infrastructure Type – 2021 & 2030 ($ Mn)

Fig.83 UAE Enterprise Virtual Reality Market, By Hardware – 2020 – 2030 ($ Mn)

Fig.84 UAE Enterprise Virtual Reality Market By Software – 2020 – 2030 ($ Mn)

Fig.85 Rest of Middle East & Africa Virtual Reality By Infrastructure Type – 2021 & 2030 ($ Mn)

Fig.86 Rest of Middle East & Africa Virtual Reality Market By Hardware – 2020 – 2030 ($ Mn)

Fig.87 Rest of Middle East & Africa Virtual Reality Market By Software – 2020 – 2030 ($ Mn)

Fig.88 South & Central America Enterprise Virtual Reality Market Snapshot

Fig.89 Brazil Enterprise Virtual Reality Market By Infrastructure Type – 2021 & 2030 ($ Mn)

Fig.90 Brazil Enterprise Virtual Reality Market, By Hardware – 2020 – 2030 ($ Mn)

Fig.91 Saudi Arabia Enterprise Virtual Reality Market By Software – 2020 – 2030 ($ Mn)

Fig.92 Chile Enterprise Virtual Reality Market By Infrastructure Type – 2021 & 2030 ($ Mn)

Fig.93 Chile Enterprise Virtual Reality Market, By Hardware – 2020 – 2030 ($ Mn)

Fig.94 Chile Enterprise Virtual Reality Market By Software – 2020 – 2030 ($ Mn)

Fig.95 Argentina Enterprise Virtual Reality Market By Infrastructure Type – 2021 & 2030 ($ Mn)

Fig.96 Argentina Enterprise Virtual Reality Market, By Hardware – 2020 – 2030 ($ Mn)

Fig.97 Argentina Enterprise Virtual Reality Market By Software – 2020 – 2030 ($ Mn)

Fig.98 Rest of South & Central America Virtual Reality By Infrastructure Type – 2021 & 2030 ($ Mn)

Fig.99 Rest of Middle East & Africa Virtual Reality Market By Hardware – 2020 – 2030 ($ Mn)

Fig.100 Rest of Middle East & Africa Virtual Reality Market By Software – 2020 – 2030 ($ Mn)

Fig.101 Virtual Reality– Market Overview

Fig.102 North America Consumer Virtual Reality Market Snapshot

Fig.103 North America Consumer Virtual Reality By Hardware – 2020 – 2030 ($ Mn)

Fig.104 North America Consumer Virtual Reality Market By Software – 2021 & 2030 ($ Mn)

Fig.105 US Consumer Virtual Reality Market by IT Infrastructure – 2021 & 2030 ($ Mn)

Fig.106 US Consumer Virtual Reality Market by Hardware – 2020 – 2030 ($ Mn)

Fig.107 US Consumer Virtual Reality Market by Software – 2021 – 2030 ($ Mn)

Fig.108 Canada Consumer Virtual Reality Market by Infrastructure Type – 2021 & 2030 ($ Mn)

Fig.109 Canada Consumer Virtual Reality Market by Hardware – 2020 – 2030 ($ Mn)

Fig.110 Canada Consumer Virtual Reality Market by Software – 2021 & 2030 ($ Mn)

Fig.111 Mexico Consumer Virtual Reality Market by Infrastructure Type – 2021 & 2030 ($ Mn)

Fig.112 Mexico Consumer Virtual Reality Market by Hardware – 2020 – 2030 ($ Mn)

Fig.113 Mexico Consumer Virtual Reality Market by Software – 2021 & 2030 ($ Mn)

Fig.114 Europe Consumer Virtual Reality Market Snapshot

Fig.115 Europe Consumer Virtual Reality Market By Hardware – 2020 – 2030 ($ Mn)

Fig.116 Europe Consumer Virtual Reality Market By Software – 2021 & 2030 ($ Mn)

Fig.117 United Kingdom Consumer Virtual Reality By Infrastructure Type – 2021 & 2030 ($ Mn)

Fig.118 United Kingdom Consumer Virtual Reality Market By Hardware – 2020 – 2030 ($ Mn)

Fig.119 United Kingdom Consumer Virtual Reality Market By Software – 2020 – 2030 ($ Mn)

Fig.120 France Consumer Virtual Reality Market by Infrastructure Type – 2021 – 2030 ($ Mn)

Fig.121 France Consumer Virtual Reality Market By Hardware – 2020 – 2030 ($ Mn)

Fig.122 France Consumer Virtual Reality Market By Software – 2021 & 2030 ($ Mn)

Fig.123 Germany Consumer Virtual Reality By Infrastructure Type – 2021 & 2030 ($ Mn)

Fig.124 Germany Consumer Virtual Reality Market By Hardware – 2020 – 2030 ($ Mn)

Fig.125 Germany Consumer Virtual Reality Market By Software – 2021 & 2030 ($ Mn)

Fig.126 Netherlands Consumer Virtual Reality Market By Infrastructure Type – 2021 & 2030 ($ Mn)

Fig.127 Netherlands Consumer Virtual Reality Market By Hardware – 2020 – 2030 ($ Mn)

Fig.128 Netherlands Consumer Virtual Reality Market By Software – 2021 & 2030 ($ Mn)

Fig.129 Italy Consumer Virtual Reality Market By Infrastructure Type – 2021 & 2030 ($ Mn)

Fig.130 Italy Consumer Virtual Reality By Hardware – 2020 – 2030 ($ Mn)

Fig.131 Italy Consumer Virtual Reality Market By Software – 2021 & 2030 ($ Mn)

Fig.132 Rest of Europe Consumer Virtual Reality Market By Infrastructure Type – 2021 & 2030 ($ Mn)

Fig.133 Rest of Europe Consumer Virtual Reality Market By Hardware – 2020 – 2030 ($ Mn)

Fig.134 Rest of Europe Consumer Virtual Reality Market By Software – 2021 & 2030 ($ Mn)

Fig.135 Asia-Pacific Consumer Virtual Reality Market Snapshot

Fig.136 Asia-Pacific Consumer Virtual Reality Market By Hardware – 2020 – 2030 ($ Mn)

Fig.137 Asia-Pacific Consumer Virtual Reality Market By Software – 2020 & 2030 ($ Mn)

Fig.138 China Consumer Virtual Reality Market By Infrastructure Type – 2021 & 2030 ($ Mn)

Fig.139 China Consumer Virtual Reality Market, By Hardware – 2020 – 2030 ($ Mn)

Fig.140 China Consumer Virtual Reality Market By Software– 2021 & 2030 ($ Mn)

Fig.141 Japan Consumer Virtual Reality Market By Hardware – 2021 & 2030 ($ Mn)

Fig.142 Japan Consumer Virtual Reality Market By Hardware – 2020 – 2030 ($ Mn)

Fig.143 Japan Consumer Virtual Reality Market By Software – 2021 & 2030 ($ Mn)

Fig.144 India Consumer Virtual Reality Market By Infrastructure Type – 2021 & 2030 ($ Mn)

Fig.145 India Enterprise Virtual Reality Market By Hardware – 2020 – 2030 ($ Mn)

Fig.146 India Consumer Virtual Reality Market By Software – 2021 & 2030 ($ Mn)

Fig.147 South Korea Consumer Virtual Reality Market By Infrastructure Type – 2021 & 2030 ($ Mn)

Fig.148 South Korea Consumer Virtual Reality Market By Hardware – 2020 – 2030 ($ Mn)

Fig.149 South Korea Consumer Virtual Reality Market By Software – 2021 & 2030 ($ Mn)

Fig.150 Australia Consumer Virtual Reality Market By Infrastructure Type – 2021 & 2030 ($ Mn)

Fig.151 Australia Consumer Virtual Reality Market By Hardware – 2020 – 2030 ($ Mn)

Fig.152 Australia Consumer Virtual Reality Market By Software – 2021 & 2030 ($ Mn)

Fig.153 Rest of Asia-Pacific Consumer Virtual Reality By Infrastructure Type – 2021 & 2030 ($ Mn)

Fig.154 Rest of Asia-Pacific Consumer Virtual Reality Market By Hardware – 2020 – 2030 ($ Mn)

Fig.155 Rest of Asia-Pacific Consumer Virtual Reality Market By Software – 2021 & 2030 ($ Mn)

Fig.156 Middle East & Africa Consumer Virtual Reality Market Snapshot

Fig.157 Middle East & Africa Consumer Virtual Reality Market, By Hardware – 2020 – 2030 ($ Mn)

Fig.158 Middle East & Africa Consumer Virtual Reality Market By Software – 2021 & 2030 ($ Mn)

Fig.159 Turkey Consumer Virtual Reality Market By Infrastructure Type – 2021 & 2030 ($ Mn)

Fig.160 Turkey Consumer Virtual Reality Market, By Hardware – 2020 – 2030 ($ Mn)

Fig.161 Turkey Consumer Virtual Reality Market By Software – 2021 & 2030 ($ Mn)

Fig.162 Saudi Arabia Consumer Virtual Reality Market By Infrastructure Type – 2021 & 2030 ($ Mn)

Fig.163 Saudi Arabia Consumer Virtual Reality Market, By Hardware – 2020 – 2030 ($ Mn)

Fig.164 Saudi Arabia Consumer Virtual Reality Market By Software – 2021 & 2030 ($ Mn)

Fig.165 South Africa Consumer Virtual Reality Market By Infrastructure Type – 2021 & 2030 ($ Mn)

Fig.166 South Africa Consumer Virtual Reality Market, By Hardware – 2020 – 2030 ($ Mn)

Fig.167 South Africa Consumer Virtual Reality Market By Software – 2021 & 2030 ($ Mn)

Fig.168 UAE Consumer Virtual Reality Market By Infrastructure Type – 2021 & 2030 ($ Mn)

Fig.169 UAE Consumer Virtual Reality Market, By Hardware – 2020 – 2030 ($ Mn)

Fig.170 UAE Consumer Virtual Reality Market By Software – 2021 & 2030 ($ Mn)

Fig.171 Rest of Middle East & Africa Consumer Virtual Reality By Infrastructure Type – 2021 & 2030 ($ Mn)

Fig.172 Rest of Middle East & Africa Consumer Virtual Reality Market By Hardware – 2020 – 2030 ($ Mn)

Fig.173 Rest of Middle East & Africa Consumer Virtual Reality Market By Software – 2021 & 2030 ($ Mn)

Fig.174 South & Central America Consumer Virtual Reality Market Snapshot

Fig.175 South & Central America Consumer Virtual Reality Market, By Hardware – 2020 – 2030 ($ Mn)

Fig.176 South & central America Consumer Virtual Reality Market By Software – 2021 & 2030 ($ Mn)

Fig.177 Brazil Consumer Virtual Reality Market By Infrastructure Type – 2021 & 2030 ($ Mn)

Fig.178 Brazil Consumer Virtual Reality Market, By Hardware – 2020 – 2030 ($ Mn)

Fig.179 Saudi Arabia Consumer Virtual Reality Market By Software – 2021 & 2030 ($ Mn)

Fig.180 Chile Consumer Virtual Reality Market By Infrastructure Type – 2021 & 2030 ($ Mn)

Fig.181 Chile Consumer Virtual Reality Market, By Hardware – 2020 – 2030 ($ Mn)

Fig.182 Chile Consumer Virtual Reality Market By Software – 2021 & 2030 ($ Mn)

Fig.183 Argentina Consumer Virtual Reality Market By Infrastructure Type – 2021 & 2030 ($ Mn)

Fig.184 Argentina Consumer Virtual Reality Market, By Hardware – 2020 – 2030 ($ Mn)

Fig.185 Argentina Consumer Virtual Reality Market By Software – 2021 & 2030 ($ Mn)

Fig.186 Rest of South & Central America Consumer Virtual Reality By Infrastructure Type – 2021 & 2030 ($ Mn)

Fig.187 Rest of South & Central America Consumer Virtual Reality Market By Hardware – 2020 – 2030 ($ Mn)

Fig.188 Rest of South & Central America Consumer Virtual Reality Market By Software – 2021 & 2030 ($ Mn)

Fig.189 Information Procurement

Fig.190 Data Analysis Model

Fig.191 Market Survey Process

Fig.192 Research Methodology

Fig.193 Market Definitions

Frequently asked questions

Currency USD
$3,950

Can be used by individual purchaser only

$7,950

Can be shared globally by unlimited users within the purchasing corporation e.g. all employees of a single company


Undecided about purchasing this report?

Enquire Before Buying Request a Free Sample

Get in touch to find out about multi-purchase discounts

reportstore@globaldata.com
Tel +44 20 7947 2745

Every customer’s requirement is unique. With over 220,000 construction projects tracked, we can create a tailored dataset for you based on the types of projects you are looking for. Please get in touch with your specific requirements and we can send you a quote.

Sample Report

We are confident about Virtual Reality Market Size, Share and Trends Analysis Report by End-User Type (Enterprise, Consumer), IT Infrastructure (Hardware, Software) and Region (North America, Europe, Asia Pacific, Central & South America, Middle East & Africa) and Segment Forecast to 2030 report's unique quality. However, we want you to make the most beneficial decision for your business, so we offer free sample pages to help you:

  • Assess the relevance of the report
  • Evaluate the quality of the report
  • Justify the cost

Download your copy of the sample report and make an informed decision about whether the full report will provide you with the insights and information you need.

Below is a sample report to understand what you are buying

See what our customers are saying

“The GlobalData platform is our go-to tool for intelligence services. GlobalData provides an easy way to access comprehensive intelligence data around multiple sectors, which essentially makes it a one-for-all intelligence platform, for tendering and approaching customers.

GlobalData is very customer orientated, with a high degree of personalised services, which benefits everyday use. The highly detailed project intelligence and forecast reports can be utilised across multiple departments and workflow scopes, from operational to strategic level, and often support strategic decisions. GlobalData Analytics and visualisation solutions has contributed positively when preparing management presentations and strategic papers.”

Business Intelligence & Marketing Manager, SAL Heavy Lift

“COVID-19 has caused significant interference to our business and the COVID-19 intelligence from GlobalData has helped us reach better decisions around strategy. These two highlights have helped enormously to understand the projections into the future concerning our business units, we also utilise the project database to source new projects for Liebherr-Werk to use as an additional source to pitch for new business.”

Market Analyst & Management, Liebherr-Werk

Your daily news has saved me a lot of time and keeps me up-to-date with what is happening in the market, I like that you almost always have a link to the source origin. We also use your market data in our Strategic Business Process to support our business decisions. By having everything in one place on the Intelligence Center it has saved me a lot of time versus looking on different sources, the alert function also helps with this.

Head of Key Accounts, Saab AB

Having used several other market research companies, I find that GlobalData manages to provide that ‘difficult-to-get’ market data that others can’t, as well as very diverse and complete consumer surveys.

Marketing Intelligence Manager, Portugal Foods

Our experience with GlobalData has been very good, from the platform itself to the people. I find that the analysts and the account team have a high level of customer focus and responsiveness and therefore I can always rely on. The platform is more holistic than other providers. It is convenient and almost like a one stop shop. The pricing suite is highly competitive and value for our organisation.

I like reports that inform new segments such as the analysis on generation Z, millennials, the impact of COVID 19 to our banking customers and their new channel habits. Secondly the specialist insight on affluent sector significantly increases our understanding about this group of customers. The combination of those give us depth and breadth of the evolving market.

I’m in the business of answering and helping people make decisions so with the intelligence center I can do that, effectively and efficiently. I can share quickly key insights that answer and satisfy our country stakeholders by giving them many quality studies and primary research about competitive landscape beyond the outlook of our bank. It helps me be seen as an advisory partner and that makes a big difference. A big benefit of our subscription is that no one holds the whole data and because it allows so many people, so many different parts of our organisation have access, it enables all teams to have the same level of knowledge and decision support.

Head of Customer Insight and Research, Standard Chartered

“I know that I can always rely on Globaldata’s work when I’m searching for the right consumer and market insights. I use Globaldata insights to understand the changing market & consumer landscape and help create better taste & wellbeing solutions for our customers in food, beverage and healthcare industries.

Globaldata has the right data and the reports are of very high quality compared to your competitors. Globaldata not only has overall market sizes & consumer insights on food & beverages but also provides insights at the ingredient & flavour level. That is key for B2B companies like Givaudan. This way we understand our customers’ business and also gain insight to our unique industry”

Head of Consumer Sensory Insights, Givaudan

GlobalData provides a great range of information and reports on various sectors that is highly relevant, timely, easy to access and utilise.  The reports and data dashboards help engagement with clients; they provide valuable industry and market insights that can enrich client conversations and can help in the shaping of value propositions. Moreover, using GlobalData products has helped increase my knowledge of the finance sector, the players within it, and the general threats and opportunities.

I find the consumer surveys that are carried out to be extremely beneficial and not something I have seen anywhere else. They provided an insightful view of why and which consumers take (or don’t) particular financial products. This can help shape conversations with clients to ensure they make the right strategic decisions for their business.

One of the challenges I have found is that data in the payments space is often piecemeal. With GD all of the data I need is in one place, but it also comes with additional market reports that provide useful extra context and information. Having the ability to set-up alerts on relevant movements in the industry, be it competitors or customers, and have them emailed directly to me, ensures I get early sight of industry activity and don’t have to search for news.

Senior Account Manager, TSYS
Go even deeper with GlobalData Intelligence Center

Every Company Report we produce is powered by the GlobalData Intelligence Center.

Subscribing to our intelligence platform means you can monitor developments at Virtual Reality Market Size, Share and Trends Analysis Report by End-User Type (Enterprise, Consumer), IT Infrastructure (Hardware, Software) and Region (North America, Europe, Asia Pacific, Central & South America, Middle East & Africa) and Segment Forecast to 2030 in real time.

  • Access a live Virtual Reality Market Size, Share and Trends Analysis Report by End-User Type (Enterprise, Consumer), IT Infrastructure (Hardware, Software) and Region (North America, Europe, Asia Pacific, Central & South America, Middle East & Africa) and Segment Forecast to 2030 dashboard for 12 months, with up-to-the-minute insights.
  • Fuel your decision making with real-time deal coverage and media activity.
  • Turn insights on financials, deals, products and pipelines into powerful agents of commercial advantage.