Wind Turbines Market Size, Share and Trends Analysis by Technology, Installed Capacity, Generation, Key Players and Forecast to 2027

Powered by

All the vital news, analysis, and commentary curated by our industry experts.

Wind Turbines Market Report Overview

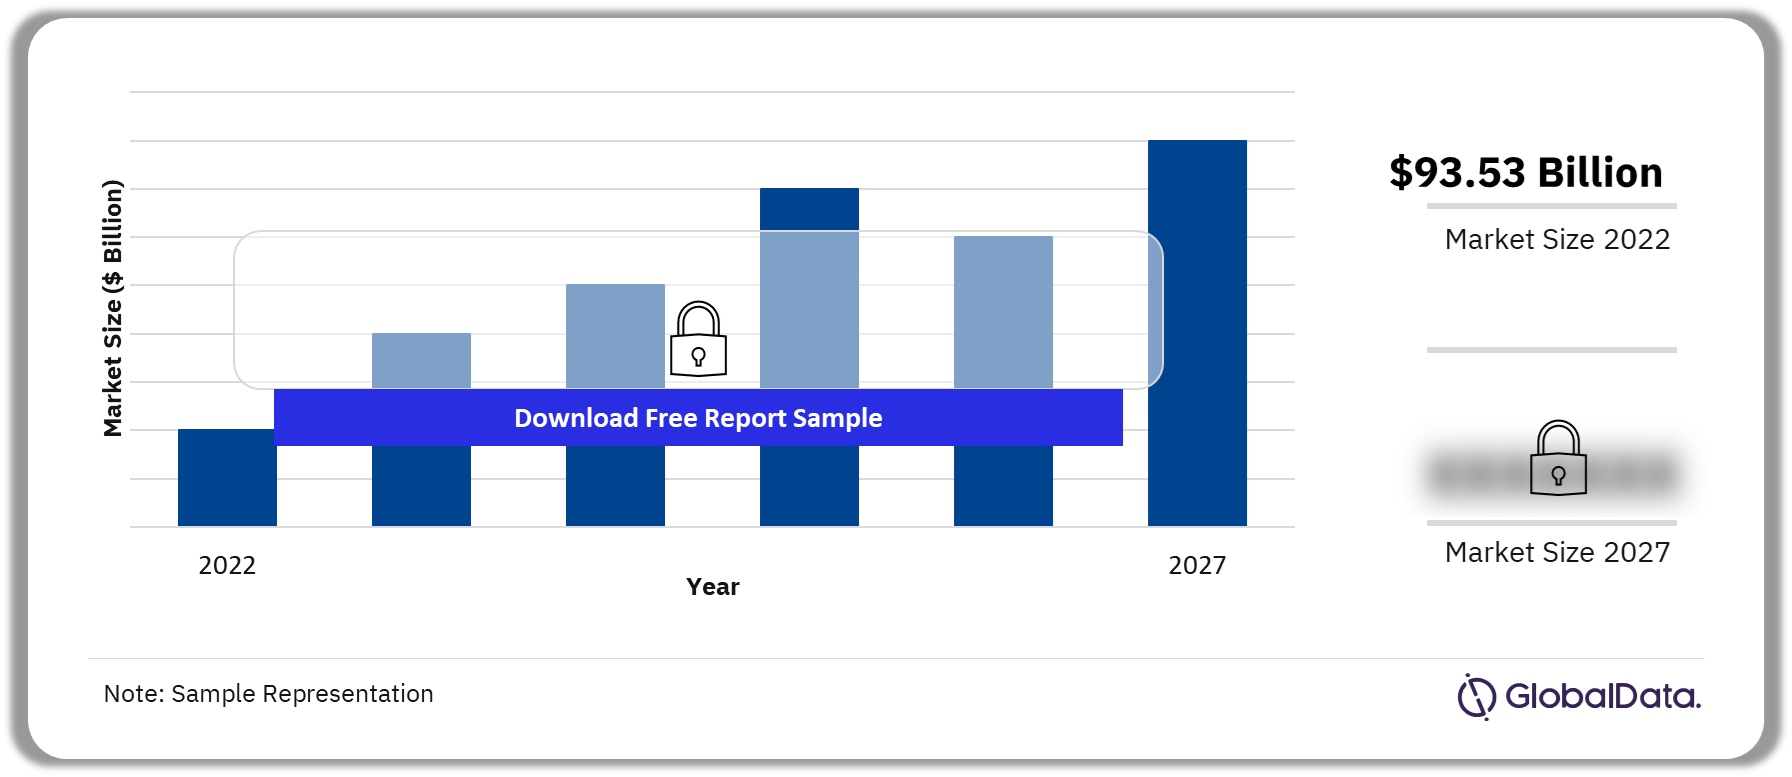
The wind turbine market size was $93.53 billion in 2022. With the focus shifting to renewable energy, the wind power sector offers tremendous growth opportunities and is expected to increase its share to more than 13% in the global cumulative installed capacity by 2027. In 2022, the annual global installation of wind turbines stood at 77.37GW (68.85GW onshore and 8.53GW offshore).

Wind Turbines Market Outlook, 2022-2027 ($ Billion)

Wind Turbines Market Outlook, 2022-2027 ($ Billion)

Buy Full Report for More Insights on Wind Turbines Market Forecast

Download a Free Sample Report

The wind turbines market research report offers comprehensive information on trends and drivers shaping the market. The report provides an in-depth analysis of the market capacity and value for the key regions over the historical and forecast period. Our analysts have also reviewed key countries in these regions along with their installations, policies, and regulatory environment, as well as deals and contracts.

Gain a competitive advantage and get familiarized with the strategy of major players through our elaborate analysis of the competitive landscape at the global level for the year 2022 and detailed profiling of top companies.

Market Size (2022) $93.53 Billion
Forecast Period 2023-2027
Historical Period 2018-2022
Key Regions •       Americas

•       Europe and The Middle East and Africa (EMEA)

•       APAC

Key Types •       Onshore

•       Offshore

Key Countries •       The US

•       Canada

•       Brazil

•       China

•       India

•       Australia

•       Germany

•       The UK

•       Spain

Leading Companies •       Xinjiang Goldwind Science & Technology Co Ltd

•       Vestas Wind Systems AS

•       GE Renewable Energy

•       Envision Energy Ltd

•       Siemens Gamesa Renewable Energy SA

Enquire & Decide Discover the perfect solution for your business needs. Enquire now and let us help you make an informed decision before making a purchase.

Wind Turbines Market Dynamics

Factors such as a rise in renewable energy auctions growing concerns about environmental impact, increasing global electricity demand, favorable government policies, feed-in tariffs (FiTs), and other financial incentives along with a huge untapped potential for offshore wind power will drive the wind turbines market in the coming years. For instance, over the past few years, countries such as Argentina, Brazil, Chile, Mexico, Peru, Russia, India, and South Africa adopted renewable energy auctions. This enabled them to allocate capacity at a competitive market price. In addition, fixed tariffs (FiTs) proved to be an important mode of government support for the growth of wind capacity installations. Under this policy, the government provided a fixed tariff to the developers for every unit of electricity produced for a long-term contract.

However, challenges such as regulatory uncertainty and geopolitical conflicts, technological challenges and underdeveloped grid infrastructure, shortage of skilled workforce, and resistance from local communities continue to hinder the market growth.

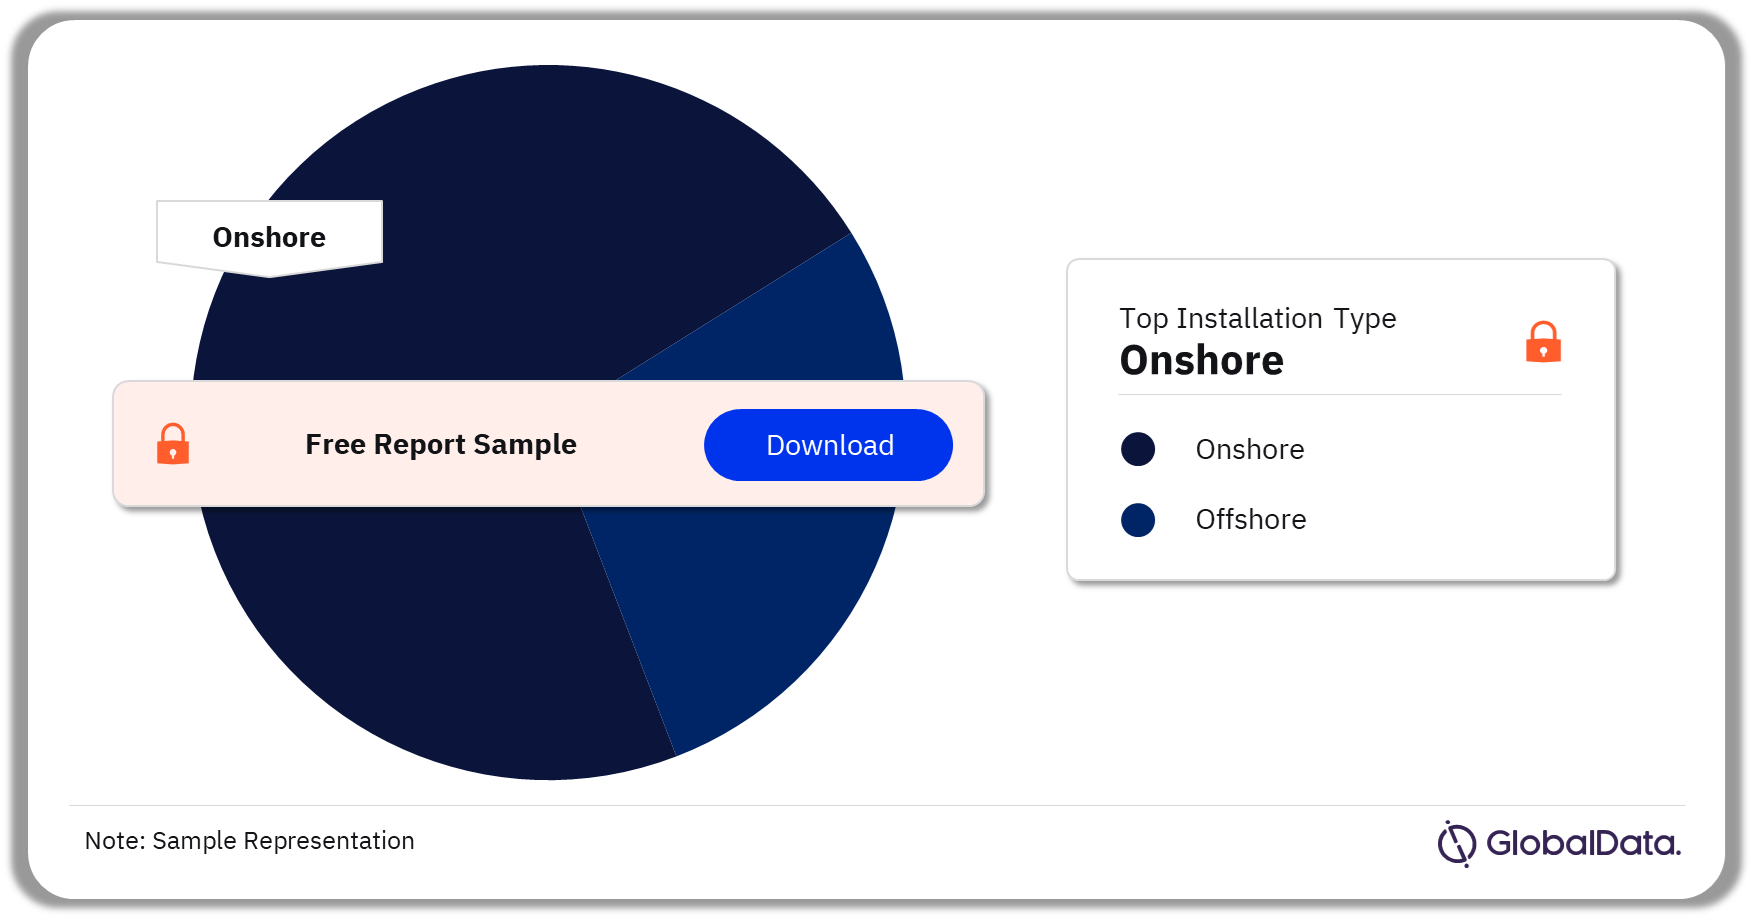
Wind Turbines Market Segmentation by Installation Types

The key installation types in the wind turbine market are onshore and offshore. In 2022, onshore installations dominated the wind turbines market. Onshore wind turbines with a capacity of 3MW and above are expected to register an increase during the forecast years owing to the high demand for large-sized turbines by wind power developers.

The share of offshore wind turbines in the global wind turbine market value is expected to grow considerably during the forecast period owing to the growing preference for offshore installations in many major countries.

Wind Turbines Market Analysis, by Installation Type, 2022 (%)

Wind Turbines Market Analysis, by Installation Type, 2022 (%)

Buy Full Report for More Insights on Installation Types in the Wind Turbines Market

Download a Free Sample Report

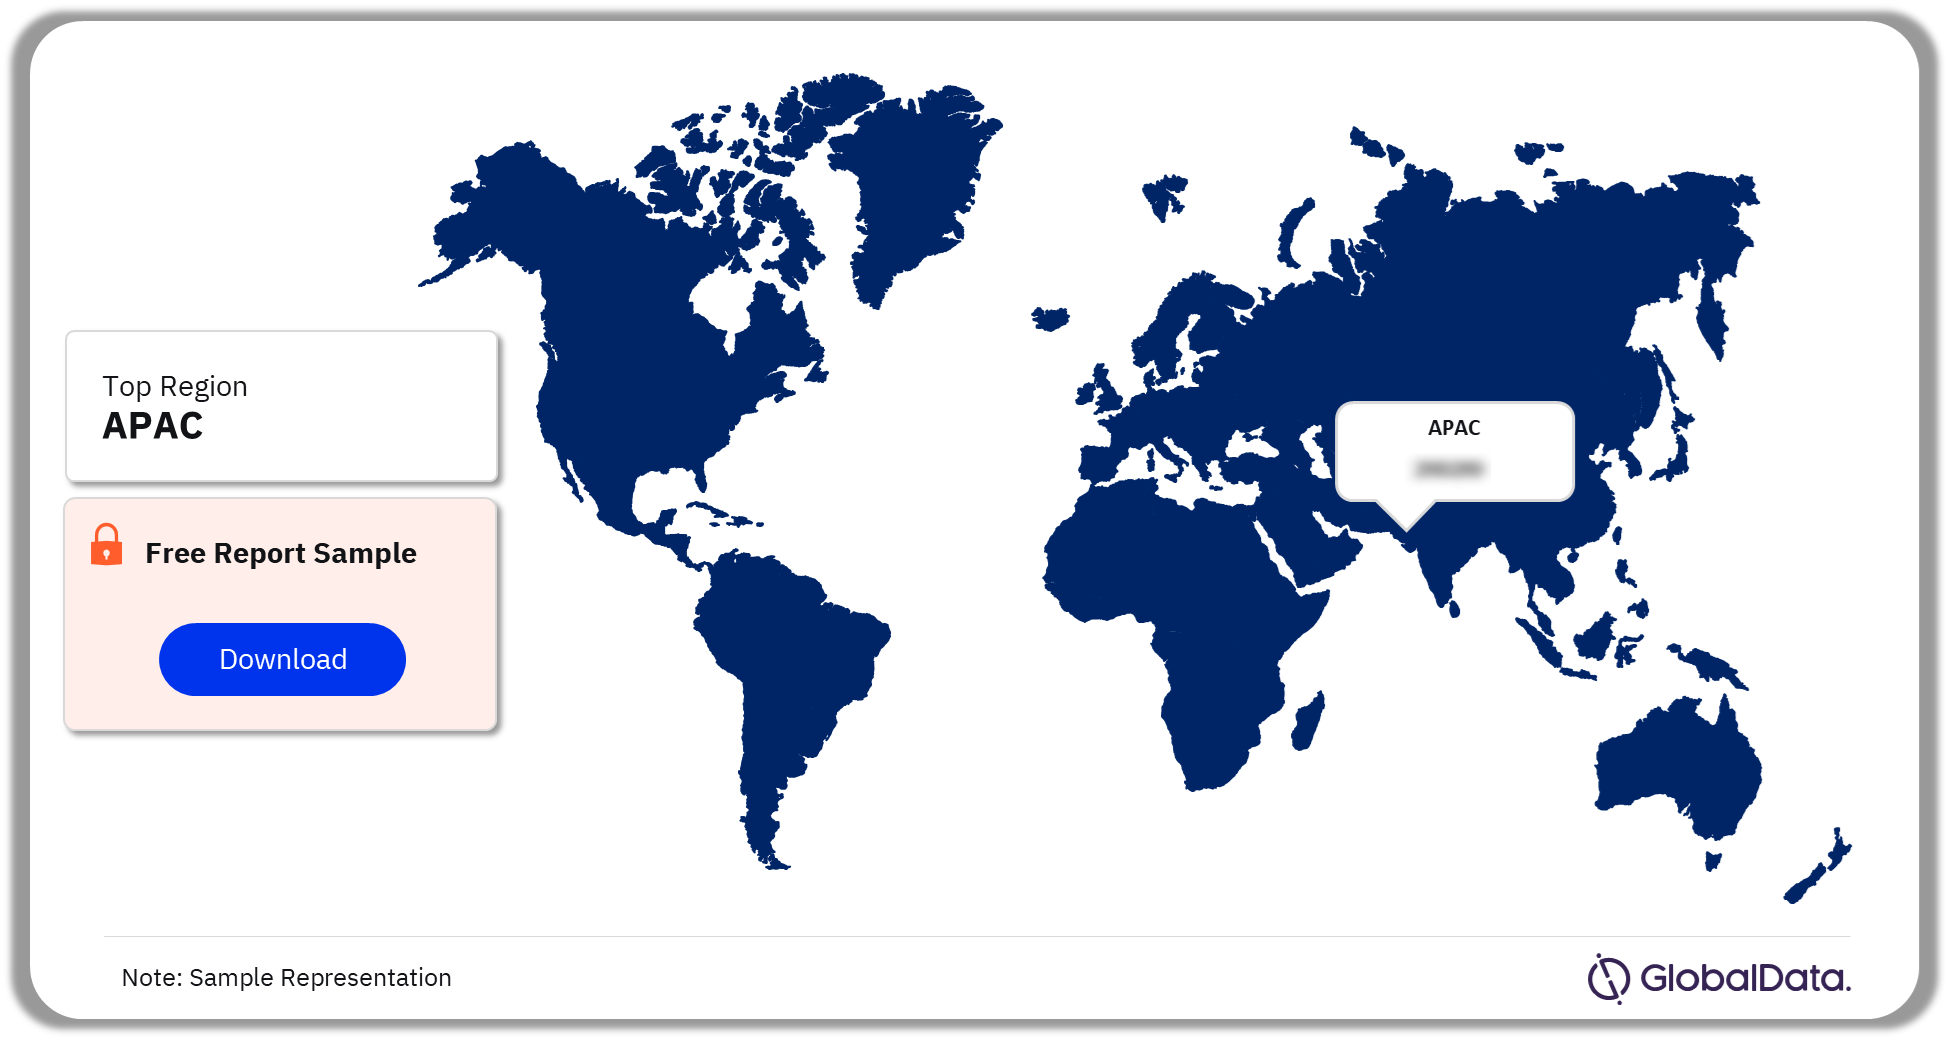
Wind Turbines Market Segmentation by Geography

Asia-Pacific was the frontrunner in 2022

The key regions in the wind turbine market are the Americas, Asia-Pacific, and EMEA. In 2022, Asia-Pacific was followed by EMEA and the Americas. Countries such as China, India, Australia, the Republic of Korea, and Japan have set renewable generation targets for the next decade. Owing to this the region will become a major market for wind turbines and associated equipment, and services in the forecast years.

The key countries of the wind turbine market discussed in the report are the US, Canada, Brazil, China, India, Australia, Germany, the UK, and Spain.

Wind Turbines Market Analysis, by Regions, 2022 (%)

Wind Turbines Market Analysis, by Regions, 2022 (%)

Buy Full Report for More Regional Insights into the Wind Turbines Market

Download a Free Sample Report

Wind Turbines Market – Competitive Landscape

Xinjiang Goldwind Science & Technology Co Ltd was the market leader in 2022

The key companies in the wind turbine market are Xinjiang Goldwind Science & Technology Co Ltd, Vestas Wind Systems AS, GE Renewable Energy, Envision Energy Ltd, and Siemens Gamesa Renewable Energy SA among others. Owing to the increase in the installation of wind turbines and the decrease in wind power tariffs., leading turbine manufacturers and other OEMs are planning on to leverage global supply-chain economies and tap the high-growth markets. For instance, as of November 2023, Goldwind strives to develop and introduce differentiated products through eight R&D centers. The company has also launched the GWHV12 platform, which is designed for both the low-to-medium and medium-to-high wind speed markets for onshore use.

Wind Turbines Market Analysis, by Companies, 2022 (%)

Buy Full Report for More Company Insights into the Wind Turbines Market

Download a Free Sample Report

Segments Covered in the Report

Wind Turbines Market Types Outlook (Value, $ Billion, 2018-2027)

  • Onshore
  • Offshore

Wind Turbines Market Regions Outlook (Value, $ Billion, 2018-2027)

  • Americas
  • Asia-Pacific
  • EMEA

Wind Turbines Market Countries Outlook (Value, $ Billion, 2018-2027)

  • The US
  • Canada
  • Brazil
  • China
  • India
  • Australia
  • Germany
  • The UK
  • Spain

Scope

The report provides:

  • An analysis of the wind turbine market.
  • Analysis of the market trends with a focus on market value and capacity at the global and regional level (Americas, Asia-Pacific, and Europe Middle East and Africa).
  • Overview of the key countries of the US, Canada, Brazil, China, India, Australia, Germany, the UK, and Spain.
  • Assessment of the market capacity and value for the key markets over the historical (2018–2022) and forecast (2023–2027) periods.
  • Competitive landscape at the global level for the year 2022, upcoming wind projects, and profiles of major global players in the market.
  • Detailed coverage of market drivers and restraints along with their impact on the market and key policies and regulatory environment.

Reasons to Buy

The report will enhance your decision-making capability in a more rapid and time-sensitive manner. It will help to:

  • Develop strategies based on developments in the market.
  • Make decisions by analyzing historical and forecast data on the wind turbine market.
  • Identify key partners and business-development avenues, based on an understanding of the activities of major competitors in the market.
  • Respond to your competitors’ business structure, strategies, and prospects.

Vestas Wind Systems AS
Xinjiang Goldwind Science & Technology Co Ltd
Siemens Gamesa Renewable Energy SA
Envision Energy Ltd
GE Renewable Energy
China Ming Yang Wind Power Group Ltd
Nordex SE

Table of Contents

About GlobalData

Table of Contents

1 Executive Summary

1.1 Global Wind Turbine Market Aggregate Installation Likely to Reach

590.90GW by

2027.

1.2 China, the UK, and the US to Lead Aggregate Offshore Wind Turbine Installations by 2027

2 Introduction

2.1 Wind Turbine Definition

2.2 Wind Turbine Classification

– Wind Turbines by Axis Type

– Wind Turbines by Installation Site Location

– Wind Turbines by Application Segment

2.3 Wind Turbines, Value Chain

2.4 Wind Turbines, Key Components

– Turbine Tower

– Turbine Blade

– Rotor Hub

– Drivetrain

– Gearbox

– Generator

– Electrical System

– Nacelle Housing

– Yaw Control System

– Pitch Control System

2.5 Wind Turbines, Cost-Component Analysis

2.6 Wind Turbines, Supply Chain

2.7 Wind Turbines, GlobalData Report Guidance

3 Wind Turbines, Global

3.1 Wind Turbines, Global, Market Overview

3.2 Wind Turbines, Global, Market Drivers and Restraints

– Wind Turbines, Global, Market Drivers and Impact Analysis

– Battery Energy Storage Market, Global, Market Restraints and Impact Analysis

3.3 Wind Turbines, Global, Market Volume by Installations, 2018–2027

3.4 Wind Turbines, Global, Onshore and Offshore Capacity by Turbine Size, 2018–2027

3.5 Wind Turbines, Global, Market Value by Technology, 2018–2027

3.6 Wind Turbines, Global, Competitive Landscape, 2022

4 Wind Turbines, Americas

4.1 Wind Turbines, Americas, Market Overview

4.2 Wind Turbines, Americas, Market Volume by Installations, 2018–2027

4.3 Wind Turbines, Americas, Onshore and Offshore Capacity by Turbine Size, 2018–2027

4.4 Wind Turbines, Americas, Market Value by Technology, 2018–2027

5 Wind Turbines, US

5.1 Wind Turbines, US, Market Overview

5.2 Wind Turbines, US, Key Policies and Regulatory Environment

– Renewable Energy Market Overview

– Federal Initiatives

5.3 Wind Turbines, US, Market Drivers and Restraints

– Wind Turbines, US, Market Drivers and Impact Analysis

– Wind Turbines, US, Market Restraints and Impact Analysis

5.4 Wind Turbines, US, Market Size Analysis

– Wind Turbines, US, Market Volume by Installations, 2018–2027

5.5 Wind Turbines, US, Onshore and Offshore Capacity by Turbine Size, 2018–2027

5.6 Wind Turbines, US, Market Value by Technology, 2018–2027

5.7 Wind Turbines, US, Major Deals and Contracts

5.8 Wind Turbines, US, Upcoming Projects

6 Wind Turbines, Canada

6.1 Wind Turbines, Canada, Market Overview

6.2 Wind Turbines, Canada, Key Policies and Regulatory Environment

– Renewable Energy Market Overview

– Renewable Energy Targets

– Federal Incentive Programs

6.3 Wind Turbines, Canada, Market Drivers and Restraints

– Wind Turbines, Canada, Market Drivers and Impact Analysis

– Wind Turbines, Canada, Market Restraints and Impact Analysis

6.4 Wind Turbines, Canada, Market Size Analysis

– Wind Turbines, Canada, Market Volume by Installations, 2018–2027

6.5 Wind Turbines, Canada, Onshore and Offshore Capacity by Turbine Size, 2018–2027

6.6 Wind Turbines, Canada, Market Value by Technology, 2018–2027

6.7 Wind Turbines, Canada, Major Deals and Contracts

6.8 Wind Turbines, Canada, Upcoming Projects

7 Wind Turbines, Brazil

7.1 Wind Turbines, Brazil, Market Overview

7.2 Wind Turbines, Brazil, Key Policies and Regulatory Environment

– Renewable Energy Market Overview

– Policy Snapshot

– Renewable Energy Targets

– Auctions

– Wind Turbine Component Tax Exemption (Executive Decree 656)

– Net Metering for Distributed Generation

7.3 Wind Turbines, Brazil, Market Drivers and Restraints

– Wind Turbines, Brazil, Market Drivers and Impact Analysis

– Wind Turbines, Brazil, Market Restraints and Impact Analysis

7.4 Wind Turbines, Brazil, Market Size Analysis

– Wind Turbines, Brazil, Market Volume by Installations, 2018–2027

7.5 Wind Turbines, Brazil, Onshore and Offshore Capacity by Turbine Size, 2018–2027

7.6 Wind Turbines, Brazil, Market Value by Technology, 2018–2027

7.7 Wind Turbines, Brazil, Major Deals and Contracts

7.8 Wind Turbines, Brazil, Upcoming Projects

8 Wind Turbines, Asia-Pacific

8.1 Wind Turbines, Asia-Pacific, Market Overview

8.2 Wind Turbines, Asia-Pacific, Market Volume by Installations, 2018–2027

8.3 Wind Turbines, Asia-Pacific, Onshore and Offshore Capacity by Turbine Size, 2018–2027

8.4 Wind Turbines, Asia-Pacific, Market Value by Technology, 2018–2027

9 Wind Turbines, China

9.1 Wind Turbines, China, Market Overview

9.2 Wind Turbines, China, Key Policies and Regulatory Environment

– Renewable Energy Market Overview

– Policy Snapshot

– Renewable Energy Targets

– Taxation Measures

– International Science and Technology Co-operation Program for New and Renewable Energy

– The 14th Five-Year Plan

– Subsidy-Free Solar, Wind Power Policy

– Financial Incentives and Policy Support for Wind, China

– Notice on Provisional Management Measures for Distributed Wind Power Project Development and Construction for all provinces

– Notice regulating the standardization of the wind power equipment and generators quality.

– Market Entry Standards for Wind Equipment Manufacturers

9.3 Wind Turbines, China, Market Drivers and Restraints

– Wind Turbines, China, Market Drivers and Impact Analysis

– Wind Turbines, China, Market Restraints and Impact Analysis

9.4 Wind Turbines, China, Market Size Analysis

– Wind Turbines, China, Market Volume by Installations, 2018–2027

9.5 Wind Turbines, China, Onshore and Offshore Capacity by Turbine Size, 2018–2027

9.6 Wind Turbines, China, Market Value by Technology, 2018–2027

9.7 Wind Turbines, China, Major Deals and Contracts

9.8 Wind Turbines, China, Upcoming Projects

10 Wind Turbines, India

10.1 Wind Turbines, India, Market Overview

10.2 Wind Turbines, India, Key Policies and Regulatory Environment

– Renewable Energy Market Overview

– Policy Snapshot

– Renewable Energy Targets

– National Wind-Solar Hybrid Policy

– Interstate Transmission Network System (ISTS)-Connected Wind-Solar Hybrid Power Projects

– Renewable Energy Auctions

– Feed-in-Tariff, Wind Power

– Support for Wind Power

10.3 Wind Turbines, India, Market Drivers and Restraints

– Wind Turbines, India, Market Drivers and Impact Analysis

– Wind Turbines, India, Market Restraints and Impact Analysis

10.4 Wind Turbines, India, Market Size Analysis

– Wind Turbines, India, Market Volume by Installations, 2018–2027

10.5 Wind Turbines, India, Onshore and Offshore Capacity by Turbine Size, 2018–2027

10.6 Wind Turbines, India, Market Value by Technology, 2018–2027

10.7 Wind Turbines, India, Major Deals and Contracts

10.8 Wind Turbines, India, Upcoming Projects

11 Wind Turbines, Australia

11.1 Wind Turbines, Australia, Market Overview

11.2 Wind Turbines, Australia, Key Policies and Regulatory Environment

– Renewable Energy Market Overview

– Renewable Energy Targets

– Policy Snapshot

– Renewable Energy Target (RET) Scheme

– Climate Change Target 2030

– Offshore Clean Energy Infrastructure Regulatory Framework

11.3 Wind Turbines, Australia, Market Drivers and Restraints

– Wind Turbines, Australia, Market Drivers and Impact Analysis

– Wind Turbines, Australia, Market Restraints and Impact Analysis

11.4 Wind Turbines, Australia, Market Size Analysis

– Wind Turbines, Australia, Market Volume by Installations, 2018–2027

11.5 Wind Turbines, Australia, Onshore and Offshore Capacity by Turbine Size, 2018–2027

11.6 Wind Turbines, Australia, Market Value by Technology, 2018–2027

11.7 Wind Turbines, Australia, Major Deals and Contracts

11.8 Wind Turbines, Australia, Upcoming Projects

12 Wind Turbines, EMEA

12.1 Wind Turbines, EMEA, Market Overview

12.2 Wind Turbines, EMEA, Market Volume by Installations, 2018–2027

12.3 Wind Turbines, EMEA, Onshore and Offshore Capacity by Turbine Size, 2018–2027

12.4 Wind Turbines, EMEA, Market Value by Technology, 2018–2027

13 Wind Turbines, Germany

13.1 Wind Turbines, Germany, Market Overview

13.2 Wind Turbines, Germany, Key Policies and Regulatory Environment

– Renewable Energy Market Overview

– Renewable Energy Targets

– Renewable Energy Act (ErneuerbareEnergienGesetz – EEG)

– Wind Power Development

– Renewable Energy Auctions

13.3 Wind Turbines, Germany, Market Drivers and Restraints

– Wind Turbines, Germany, Market Drivers and Impact Analysis

– Wind Turbines, Germany, Market Restraints and Impact Analysis

13.4 Wind Turbines, Germany, Market Size Analysis

– Wind Turbines, Germany, Market Volume by Installations, 2018–2027

13.5 Wind Turbines, Germany, Onshore and Offshore Capacity by Turbine Size, 2018–2027

13.6 Wind Turbines, Germany, Market Value by Technology, 2018–2027

13.7 Wind Turbines, Germany, Major Deals and Contracts

13.8 Wind Turbines, Germany, Upcoming Projects

14 Wind Turbines, UK

14.1 Wind Turbines, UK, Market Overview

14.2 Wind Turbines, UK, Key Policies and Regulatory Environment

– Renewable Energy Market Overview

– Renewable Energy Targets

– Electricity Market Reform 2011

– Climate Change Act

– The Clean Growth Strategy and Clean Growth Grand Challenge

– Carbon Reduction target 2030

– Renewable Obligation Order

– Contracts for Difference (CfD)

– Smart Export Guarantee (SEG)

– British Energy Security Strategy

14.3 Wind Turbines, UK, Market Drivers and Restraints

– Wind Turbines, UK, Market Drivers and Impact Analysis

– Wind Turbines, UK, Market Restraints and Impact Analysis

14.4 Wind Turbines, UK, Market Size Analysis

– Wind Turbines, UK, Market Volume by Installations, 2018–2027

14.5 Wind Turbines, UK, Onshore and Offshore Capacity by Turbine Size, 2018–2027

14.6 Wind Turbines, UK, Market Value by Technology, 2018–2027

14.7 Wind Turbines, UK, Major Deals and Contracts

14.8 Wind Turbines, UK, Upcoming Projects

15 Wind Turbines, Spain

15.1 Wind Turbines, Spain, Market Overview

15.2 Wind Turbines, Spain, Key Policies and Regulatory Environment

– Renewable Energy Market Overview

– Renewable Energy Target

– Climate Change and Energy Transition (Law 7/2021)

– The National Energy and Climate Plan (NECP) 2021-2030

– National Recovery and Resilience Plan – Green Transition

– Feed-in Premiums

– Renewable Auctions

– The Institute for the Diversification and Saving of Energy (IDAE)

– Grid Connection of Small Wind Turbines

– Roadmap for the Development of Offshore Wind and Marine Energy

15.3 Wind Turbines, Spain, Market Drivers and Restraints

– Wind Turbines, Spain, Market Drivers and Impact Analysis

– Wind Turbines, Spain, Market Restraints and Impact Analysis

15.4 Wind Turbines, Spain, Market Size Analysis

– Wind Turbines, Spain, Market Volume by Installations, 2018–2027

15.5 Wind Turbines, Spain, Onshore and Offshore Capacity by Turbine Size, 2018–2027

15.6 Wind Turbines, Spain, Market Value by Technology, 2018–2027

15.7 Wind Turbines, Spain, Major Deals and Contracts

15.8 Wind Turbines, Spain, Upcoming Projects

16 Wind Turbines, Major Company Profiles

16.1 Xinjiang Goldwind Science & Technology Co Ltd

16.2 Vestas Wind Systems AS

16.3 GE Renewable Energy

16.4 Envision Energy Ltd

16.5 Siemens Gamesa Renewable Energy SA

17 Appendix

17.1 Abbreviations

17.2 Bibliography

17.3 Research Methodology

– Market Volume

– Average Price (USD/kW)

– Average Price (USD/kW)

– Updated Cycle

17.4 Research Methodology

– Primary Research

– Secondary Research

– Data Analysis and Findings

Contact Us

Table

Table 1: Wind Turbines, Global, Cost Component Share (%), 2020

Table 2: Wind Turbines, Global, Types of Auctions in Renewable Energy Sector

Table 3: Wind Turbines, Global, Market Drivers and Restraints Analysis

Table 4: Wind Turbines, Global, Market Volume by Installations (GW), 2018–2027

Table 5: Wind Turbines, Global, Onshore and Offshore Capacity by Turbine Size (MW), 2018–2022, 2023–2027

Table 6: Wind Turbines, Global, Market Value by Technology ($bn), 2018–2027

Table 7: Wind Turbines, Global, Competitive Landscape (%), 2022

Table 8: Wind Turbines, Americas, Market Volume by Installations (GW), 2018–2027

Table 9: Wind Turbines, Americas, Onshore and Offshore Capacity by Turbine Size (MW), 2018–2022, 2023–2027

Table 10: Wind Turbines, Americas, Market Value by Technology ($bn), 2018–2027

Table 11: Wind Turbines, US, Projected Wind Power Cumulative Capacity (GW) by State, 2030 and 2050

Table 12: Wind Turbines, Renewable Energy Project Tax Components and changes with new tax code, US

Table 13: Wind Turbines, Renewable Energy Market, US, Investment Tax Credit

Table 14: Wind Turbines, US, Market Drivers and Restraints Analysis

Table 15: Wind Turbines, US, Market Volume by Installations (MW), 2018–2027

Table 16: Wind Turbines, US, Onshore and Offshore Capacity by Turbine Size (MW), 2018–2022, 2023–2027

Table 17: Wind Turbines, US, Market Value by Technology ($m), 2018–2027

Table 18: Wind Turbines, US, Upcoming Projects

Table 19: Wind Turbines, Key Regulatory Authorities, Canada

Table 20: Wind Turbines, Renewable Energy Targets, Federal and Provincial, Canada

Table 21: Wind Turbines, Canada, Market Drivers and Restraints Analysis

Table 22: Wind Turbines, Canada, Market Volume by Installations (MW), 2018–2027

Table 23: Wind Turbines, Canada, Onshore and Offshore Capacity by Turbine Size (MW), 2018–2022, 2023–2027

Table 24: Wind Turbines, Canada, Market Value by Technology ($m), 2018–2027

Table 25: Wind Turbines, Canada, Upcoming Projects

Table 26: Wind Turbines, Policy Snapshot, Brazil, 2022

Table 27: Wind Turbines, Brazil, Renewable Auctions, 2015–2022

Table 28: Wind Turbines, Brazil, Market Drivers and Restraints Analysis

Table 29: Wind Turbines, Brazil, Market Volume by Installations (MW), 2018–2027

Table 30: Wind Turbines, Brazil, Onshore and Offshore Capacity by Turbine Size (MW), 2018–2022, 2023–2027

Table 31: Wind Turbines, Brazil, Market Value by Technology ($m), 2018–2027

Table 32: Wind Turbines, Brazil, Upcoming Projects

Table 33: Wind Turbines, Asia-Pacific, Market Volume by Installations (GW), 2018–2027

Table 34: Wind Turbines, Asia-Pacific, Onshore and Offshore Capacity by Turbine Size (MW), 2018–2022, 2023–2027

Table 35: Wind Turbines, Asia-Pacific, Market Value by Technology ($bn), 2018–2027

Table 36: Wind Turbines, Policy Snapshot, China, 2022

Table 37: Wind Turbines, China, Market Drivers and Restraints Analysis

Table 38: Wind Turbines, China, Market Volume by Installations (GW), 2018–2027

Table 39: Wind Turbines, China, Onshore and Offshore Capacity by Turbine Size (MW), 2018–2022, 2023–2027

Table 40: Wind Turbines, China, Market Value by Technology ($m), 2018–2027

Table 41: Wind Turbines, China, Upcoming Projects

Table 42: Wind Turbines, Policy Snapshot, India, 2022

Table 43: Wind Turbines, Renewable energy market, India, state-wise renewable energy targets vs actuals, 2022

Table 44: Wind Turbines, Renewable Energy Auctions, India, 2018-2023

Table 45: Wind Turbines, India, Market Drivers and Restraints Analysis

Table 46: Wind Turbines, India, Market Volume by Installations (MW), 2018–2027

Table 47: Wind Turbines, India, Onshore and Offshore Capacity by Turbine Size (MW), 2018–2022, 2023–2027

Table 48: Wind Turbines, India, Market Value by Technology ($m), 2018–2027

Table 49: Wind Turbines, India, Upcoming Projects

Table 50: Wind Turbines, Policy Snapshot, Australia, 2022

Table 51: Wind Turbines, New Large-scale Renewable Energy Target, Annual Targets, Australia (TWh), 2015–2030

Table 52: Wind Turbines, Australia, Market Drivers and Restraints Analysis

Table 53: Wind Turbines, Australia, Market Volume by Installations (MW), 2018–2027

Table 54: Wind Turbines, Australia, Onshore and Offshore Capacity by Turbine Size (MW), 2018–2022, 2023–2027

Table 55: Wind Turbines, Australia, Market Value by Technology ($m), 2018–2027

Table 56: Wind Turbines, Australia, Upcoming Projects

Table 57: Wind Turbines, EMEA, Market Volume by Installations (GW), 2018–2027

Table 58: Wind Turbines, EMEA, Onshore and Offshore Capacity by Turbine Size (MW), 2018–2022, 2023–2027

Table 59: Wind Turbines, EMEA, Market Value by Technology ($bn), 2018–2027

Table 60: Wind Turbines, Renewable Energy Targets, Germany, 2030

Table 61: Wind Turbines, Offshore Auction Results, Germany, 2017–2022

Table 62: Wind Turbines, Offshore Wind Auctions, Germany, 2023

Table 63: Wind Turbines, Germany, Joint Auction Results, 2018–2020

Table 64: Wind Turbines, Germany, Market Drivers and Restraints Analysis

Table 65: Wind Turbines, Germany, Market Volume by Installations (MW), 2018–2027

Table 66: Wind Turbines, Germany, Onshore and Offshore Capacity by Turbine Size (MW), 2018–2022, 2023–2027

Table 67: Wind Turbines, Germany, Market Value by Technology ($m), 2018–2027

Table 68: Wind Turbines, Germany, Upcoming Projects

Table 69: Wind Turbines, Renewable Obligation, Technology Eligibility, UK

Table 70: Wind Turbines, Renewable Obligation, Technology Eligibility, UK

Table 71: Wind Turbines, Renewable Obligation (ROC/MWh), UK, 2009–2023

Table 72: Wind Turbines, Renewable Energy, CfD First Allocation Round Results, UK, 2015

Table 73: Wind Turbines, Renewable Energy, CfD Second Allocation Round Results, UK, 2017

Table 74: Wind Turbines, Renewable Energy, CfD Third Allocation Round Results, UK, 2019

Table 75: Wind Turbines, Renewable Energy, CfD Fourth Allocation Round Results, UK, 2022

Table 76: Wind Turbines, Renewable Energy, CfD Fifth Allocation Round Schedule, UK, 2023

Table 77: Wind Turbines, Smart Export Guarantee Tariff, UK, 2022

Table 78: Wind Turbines, UK, Market Drivers and Restraints Analysis

Table 79: Wind Turbines, UK, Market Volume by Installations (MW), 2018–2027

Table 80: Wind Turbines, UK, Onshore and Offshore Capacity by Turbine Size (MW), 2018–2022, 2023–2027

Table 81: Wind Turbines, UK, Market Value by Technology ($m), 2018–2027

Table 82: Wind Turbines, UK, Upcoming Projects

Table 83: Wind Turbines, Main Objectives of the NECP, Spain, 2021-2030

Table 84: Wind Turbines, Renewable Energy Auctions, Spain, 2016-2022

Table 85: Wind Turbines, Funds allocated by IDAE by technology (in EURM), Spain, 2021-2030

Table 86: Wind Turbines, Spain, Market Drivers and Restraints Analysis

Table 87: Wind Turbines, Spain, Market Volume by Installations (MW), 2018–2027

Table 88: Wind Turbines, Spain, Onshore and Offshore Capacity by Turbine Size (MW), 2018–2022, 2023–2027

Table 89: Wind Turbines, Spain, Market Value by Technology ($m), 2018–2027

Table 90: Wind Turbines, Spain, Upcoming Projects

Table 91: Wind Turbines, Xinjiang Goldwind Science & Technology Co Ltd

Table 92: Wind Turbines, Vestas Wind Systems AS

Table 93: Wind Turbines, GE Renewable Energy

Table 94: Wind Turbines, Envision Energy Ltd

Table 95: Wind Turbines, Siemens Gamesa Renewable Energy SA

Table 96: Abbreviations

Table 97: Wind Turbines, Capacity Segment

Table 98: Wind Turbines, Capacity Segment, Units

Figures

Figure 1: Wind Turbines, Region-Wise Aggregate Forecast Installations (GW), 2023–2027

Figure 2: Wind Turbines, Top Countries, Offshore Wind Turbines Market Snapshot, 2022, 2027 and 2023–2027

Figure 3: Wind Turbines, Value Chain Analysis

Figure 4: Wind Turbines, Value Chain Activities

Figure 5: Wind Turbines, Global, Onshore and Offshore (%), 2018–2027

Figure 6: Wind Turbines, Global, Onshore and Offshore Capacity by Turbine Size (%), 2018–2022, 2023–2027

Figure 7: Wind Turbines, Global, Market Value by Technology ($bn), 2018–2027

Figure 8: Wind Turbines, Global, Competitive Landscape (%), 2022

Figure 9: Wind Turbines, Americas, Onshore and Offshore (%), 2018–2027

Figure 10: Wind Turbines, Americas, Onshore and Offshore Capacity by Turbine Size (%), 2018–2022, 2023–2027

Figure 11: Wind Turbines, Americas, Market Value by Technology ($bn), 2018–2027

Figure 12: Wind Turbines, US, Cumulative Installed Capacity (%), by Fuel Sources, 2022 and 2027

Figure 13: Wind Turbines, US, Market Volume by Installations (MW), 2018–2027

Figure 14: Wind Turbines, US, Onshore and Offshore Capacity by Turbine Size (%), 2018–2022, 2023–2027

Figure 15: Wind Turbines, US, Market Value by Technology ($m), 2018–2027

Figure 16: Wind Turbines, Canada, Cumulative Installed Capacity (%), by Fuel Sources, 2022 and 2027

Figure 17: Wind Turbines, Canada, Market Volume by Installations (MW), 2018–2027

Figure 18: Wind Turbines, Canada, Onshore and Offshore Capacity by Turbine Size (%), 2018–2022, 2023–2027

Figure 19: Wind Turbines, Canada, Market Value by Technology ($m), 2018–2027

Figure 20: Wind Turbines, Brazil, Cumulative Installed Capacity (%), by Fuel Sources, 2022 and 2027

Figure 21: Wind Turbines, Brazil, Market Volume by Installations (MW), 2018–2027

Figure 22: Wind Turbines, Brazil, Onshore and Offshore Capacity by Turbine Size (%), 2018–2022, 2023–2027

Figure 23: Wind Turbines, Brazil, Market Value by Technology ($m), 2018–2027

Figure 24: Wind Turbines, Asia-Pacific, Onshore and Offshore (%), 2018–2027

Figure 25: Wind Turbines, Asia-Pacific, Onshore and Offshore Capacity by Turbine Size (%), 2018–2022, 2023–2027

Figure 26: Wind Turbines, Asia-Pacific, Market Value by Technology ($bn), 2018–2027

Figure 27: Wind Turbines, China, Cumulative Installed Capacity (%), by Fuel Sources, 2022 and 2027

Figure 28: Wind Turbines, China, Market Volume by Installations (MW), 2018–2027

Figure 29: Wind Turbines, China, Onshore and Offshore Capacity by Turbine Size (%), 2018–2022, 2023–2027

Figure 30: Wind Turbines, China, Market Value by Technology ($m), 2018–2027

Figure 31: Wind Turbines, India, Cumulative Installed Capacity (%), by Fuel Sources, 2022 and 2027

Figure 32: Wind Turbines, India, Market Volume by Installations (MW), 2018–2027

Figure 33: Wind Turbines, India, Onshore and Offshore Capacity by Turbine Size (%), 2018–2022, 2023–2027

Figure 34: Wind Turbines, India, Market Value by Technology ($m), 2018–2027

Figure 35: Wind Turbines, Australia, Cumulative Installed Capacity (%), by Fuel Sources, 2022 and 2027

Figure 36: Wind Turbines, Australia, Market Volume by Installations (MW), 2018–2027

Figure 37: Wind Turbines, Australia, Onshore and Offshore Capacity by Turbine Size (%), 2018–2022, 2023–2027

Figure 38: Wind Turbines, Australia, Market Value by Technology ($m), 2018–2027

Figure 39: Wind Turbines, EMEA, Onshore and Offshore (%), 2018–2027

Figure 40: Wind Turbines, EMEA, Onshore and Offshore Capacity by Turbine Size (%), 2018–2022, 2023–2027

Figure 41: Wind Turbines, EMEA, Market Value by Technology ($bn), 2018–2027

Figure 42: Wind Turbines, Germany, Cumulative Installed Capacity (%), by Fuel Sources, 2022 and 2027

Figure 43: Wind Turbines, Onshore Wind Auctions, Germany, 2018–2022

Figure 44: Wind Turbines, Germany, Market Volume by Installations (MW), 2018–2027

Figure 45: Wind Turbines, Germany, Onshore and Offshore Capacity by Turbine Size (%), 2018–2022, 2023–2027

Figure 46: Wind Turbines, Germany, Market Value by Technology ($m), 2018–2027

Figure 47: Wind Turbines, UK, Cumulative Installed Capacity (%), by Fuel Sources, 2022 and 2027

Figure 48: Wind Turbines, UK, Market Volume by Installations (MW), 2018–2027

Figure 49: Wind Turbines, UK, Onshore and Offshore Capacity by Turbine Size (%), 2018–2022, 2023–2027

Figure 50: Wind Turbines, UK, Market Value by Technology ($m), 2018–2027

Figure 51: Wind Turbines, Spain, Cumulative Installed Capacity (%), by Fuel Sources, 2022 and 2027

Figure 52: Wind Turbines, Spain, Market Volume by Installations (MW), 2018–2027

Figure 53: Wind Turbines, Spain, Onshore and Offshore Capacity by Turbine Size (%), 2018–2022, 2023–2027

Figure 54: Wind Turbines, Spain, Market Value by Technology ($m), 2018–2027

Frequently asked questions

Wind Turbines Market Size, Share and Trends Analysis by Technology, Installed Capacity, Generation, Key Players and Forecast to 2027 standard reports
Currency USD
$3,995

Can be used by individual purchaser only

$11,985

Can be shared globally by unlimited users within the purchasing corporation e.g. all employees of a single company


Undecided about purchasing this report?

Enquire Before Buying Request a Free Sample

Get in touch to find out about multi-purchase discounts

reportstore@globaldata.com
Tel +44 20 7947 2745

Every customer’s requirement is unique. With over 220,000 construction projects tracked, we can create a tailored dataset for you based on the types of projects you are looking for. Please get in touch with your specific requirements and we can send you a quote.

Sample Report

Wind Turbines Market Size, Share and Trends Analysis by Technology, Installed Capacity, Generation, Key Players and Forecast to 2027 was curated by the best experts in the industry and we are confident about its unique quality. However, we want you to make the most beneficial decision for your business, so we offer free sample pages to help you:

  • Assess the relevance of the report
  • Evaluate the quality of the report
  • Justify the cost

Download your copy of the sample report and make an informed decision about whether the full report will provide you with the insights and information you need.

Below is a sample report to understand what you are buying

See what our customers are saying

“The GlobalData platform is our go-to tool for intelligence services. GlobalData provides an easy way to access comprehensive intelligence data around multiple sectors, which essentially makes it a one-for-all intelligence platform, for tendering and approaching customers.

GlobalData is very customer orientated, with a high degree of personalised services, which benefits everyday use. The highly detailed project intelligence and forecast reports can be utilised across multiple departments and workflow scopes, from operational to strategic level, and often support strategic decisions. GlobalData Analytics and visualisation solutions has contributed positively when preparing management presentations and strategic papers.”

Business Intelligence & Marketing Manager, SAL Heavy Lift

“COVID-19 has caused significant interference to our business and the COVID-19 intelligence from GlobalData has helped us reach better decisions around strategy. These two highlights have helped enormously to understand the projections into the future concerning our business units, we also utilise the project database to source new projects for Liebherr-Werk to use as an additional source to pitch for new business.”

Market Analyst & Management, Liebherr-Werk

Your daily news has saved me a lot of time and keeps me up-to-date with what is happening in the market, I like that you almost always have a link to the source origin. We also use your market data in our Strategic Business Process to support our business decisions. By having everything in one place on the Intelligence Center it has saved me a lot of time versus looking on different sources, the alert function also helps with this.

Head of Key Accounts, Saab AB

Having used several other market research companies, I find that GlobalData manages to provide that ‘difficult-to-get’ market data that others can’t, as well as very diverse and complete consumer surveys.

Marketing Intelligence Manager, Portugal Foods

Our experience with GlobalData has been very good, from the platform itself to the people. I find that the analysts and the account team have a high level of customer focus and responsiveness and therefore I can always rely on. The platform is more holistic than other providers. It is convenient and almost like a one stop shop. The pricing suite is highly competitive and value for our organisation.

I like reports that inform new segments such as the analysis on generation Z, millennials, the impact of COVID 19 to our banking customers and their new channel habits. Secondly the specialist insight on affluent sector significantly increases our understanding about this group of customers. The combination of those give us depth and breadth of the evolving market.

I’m in the business of answering and helping people make decisions so with the intelligence center I can do that, effectively and efficiently. I can share quickly key insights that answer and satisfy our country stakeholders by giving them many quality studies and primary research about competitive landscape beyond the outlook of our bank. It helps me be seen as an advisory partner and that makes a big difference. A big benefit of our subscription is that no one holds the whole data and because it allows so many people, so many different parts of our organisation have access, it enables all teams to have the same level of knowledge and decision support.

Head of Customer Insight and Research, Standard Chartered

“I know that I can always rely on Globaldata’s work when I’m searching for the right consumer and market insights. I use Globaldata insights to understand the changing market & consumer landscape and help create better taste & wellbeing solutions for our customers in food, beverage and healthcare industries.

Globaldata has the right data and the reports are of very high quality compared to your competitors. Globaldata not only has overall market sizes & consumer insights on food & beverages but also provides insights at the ingredient & flavour level. That is key for B2B companies like Givaudan. This way we understand our customers’ business and also gain insight to our unique industry”

Head of Consumer Sensory Insights, Givaudan

GlobalData provides a great range of information and reports on various sectors that is highly relevant, timely, easy to access and utilise.  The reports and data dashboards help engagement with clients; they provide valuable industry and market insights that can enrich client conversations and can help in the shaping of value propositions. Moreover, using GlobalData products has helped increase my knowledge of the finance sector, the players within it, and the general threats and opportunities.

I find the consumer surveys that are carried out to be extremely beneficial and not something I have seen anywhere else. They provided an insightful view of why and which consumers take (or don’t) particular financial products. This can help shape conversations with clients to ensure they make the right strategic decisions for their business.

One of the challenges I have found is that data in the payments space is often piecemeal. With GD all of the data I need is in one place, but it also comes with additional market reports that provide useful extra context and information. Having the ability to set-up alerts on relevant movements in the industry, be it competitors or customers, and have them emailed directly to me, ensures I get early sight of industry activity and don’t have to search for news.

Senior Account Manager, TSYS
Go even deeper with GlobalData Intelligence Center

Every Company Report we produce is powered by the GlobalData Intelligence Center.

Subscribing to our intelligence platform means you can monitor developments at Wind Turbines Market Size, Share and Trends Analysis by Technology, Installed Capacity, Generation, Key Players and Forecast to 2027 in real time.

  • Access a live Wind Turbines Market Size, Share and Trends Analysis by Technology, Installed Capacity, Generation, Key Players and Forecast to 2027 dashboard for 12 months, with up-to-the-minute insights.
  • Fuel your decision making with real-time deal coverage and media activity.
  • Turn insights on financials, deals, products and pipelines into powerful agents of commercial advantage.