United States (US) Beverages Consumption Trends and Forecasts Tracker, Q3 2024
Powered by ![]()
All the vital news, analysis, and commentary curated by our industry experts.

United States (US) Beverages Market Report Overview
The United States (US) beverages market size was 58.94 billion liters (BL) in Q3 2024. The US beverages market research report offers comprehensive consumption volume data across several beverage categories for Q3 2024. Furthermore, the report precisely lists new product launches and highlights the latest beverage industry performance and developments every quarter.
Buy Full Report for More Insights on the US Beverages Market Forecast
Download a Free Sample Report
US Beverages Market Segmentation by Categories
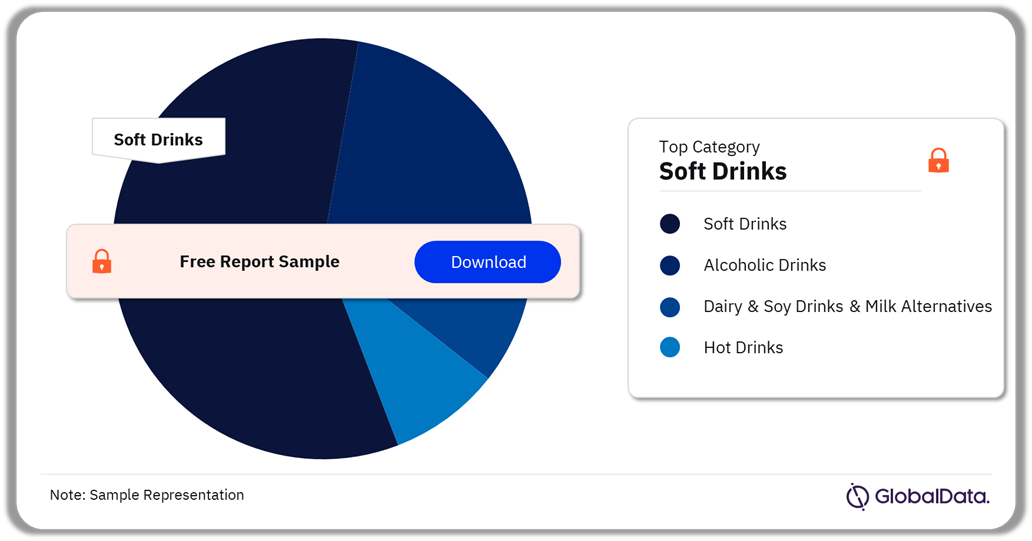
US Beverages Market Analysis by Categories, Q3 2024 (%)
Buy the Full Report for More Category Insights into the US Beverages Market,
Download a Free Sample Report
Soft drinks, alcoholic drinks, and dairy & soy drinks & milk alternatives, among others are the primary US beverages market categories. In Q3 2024, soft drinks accounted for the highest beverage market share in US.
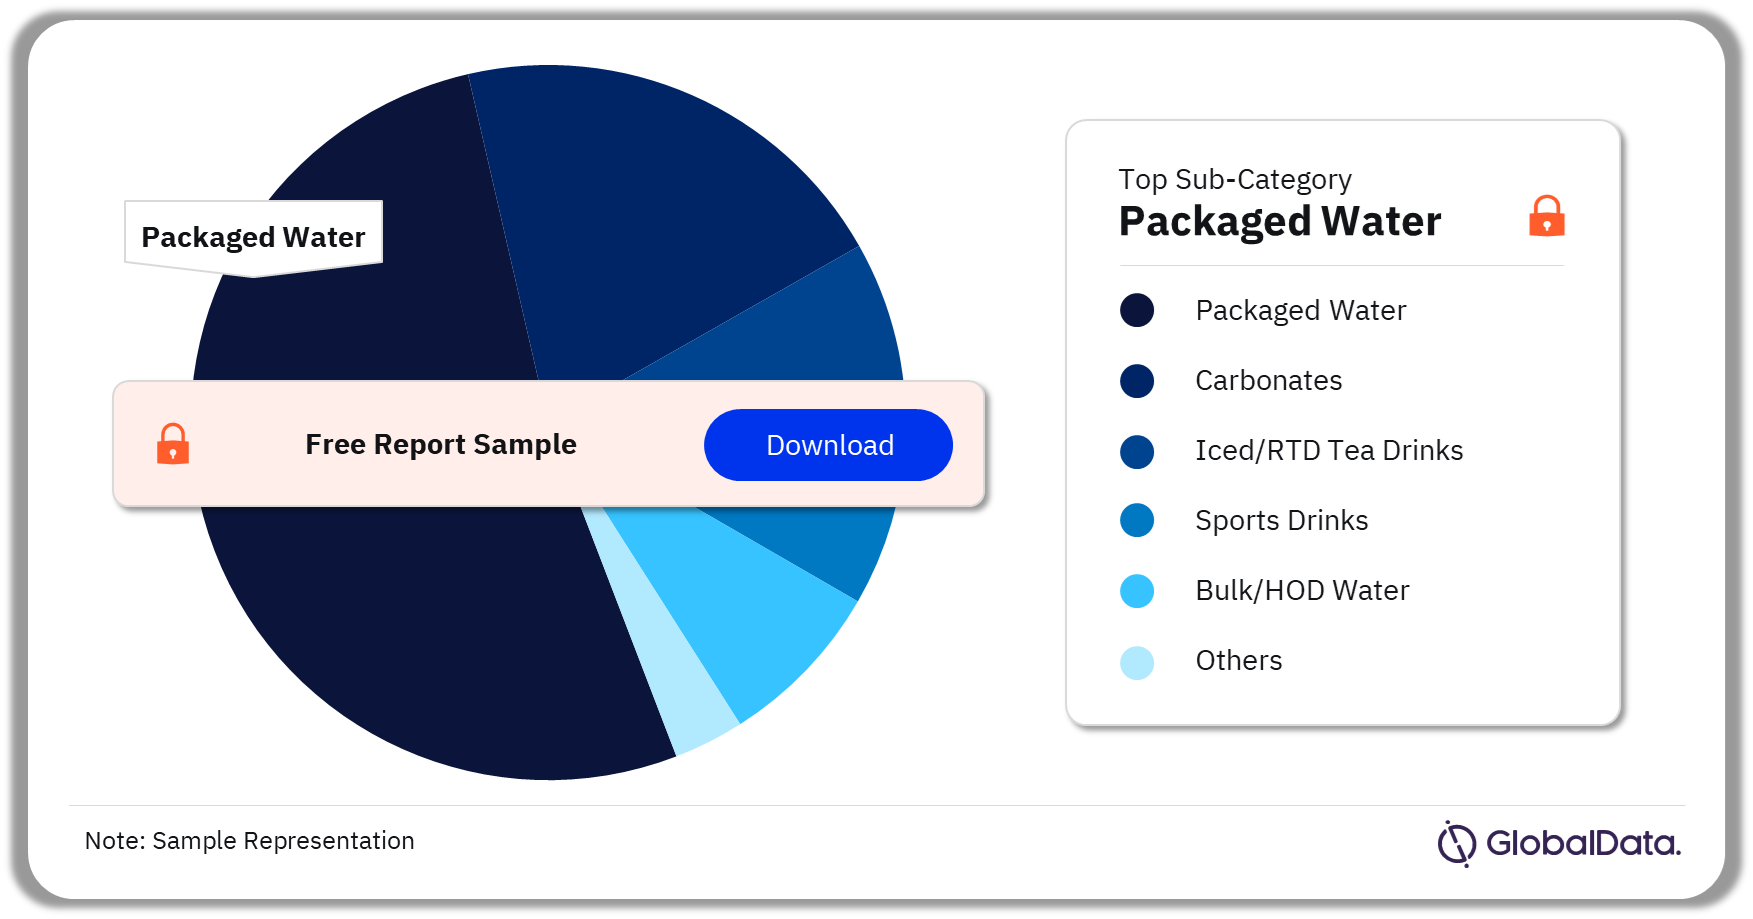
Soft Drinks: Packaged water, carbonates, iced/RTD tea drinks, sports drinks, and bulk/HOD water, among others are the main sub-categories within the soft drinks sector. Packaged water was the most consumed sub-category in Q3 2024. Demand for pure and clean hydration boosted the growth of packaged water and bulk/HOD water.
Soft Drinks Beverages Market Analysis by Sub-Categories, Q3 2024 (%)
 Buy the Full Report for More Sub-Category Insights into the US Beverages Market,
Download a Free Sample Report
Alcoholic Drinks: Beer, flavored alcoholic beverages, and still wine, among others, are the main sub-categories. In Q3 2024, beer was the leading sub-category with the highest consumption volume.
Dairy and Soy Drinks and Milk Alternatives: The key sub-categories are white milk, flavored milk, and grain, nut, rice, and seed milk alternative drinks, among others. Among the segments, white milk accounted for the highest volume in Q3 2024. Health consciousness led the growth of the drinking yogurt and fermented milk sub-category in the US beverages market.
Hot Drinks: Hot coffee, hot tea, and other hot drinks are the main sub-categories within the hot drinks sector. Hot coffee was the most consumed sub-category in Q3 2024.
| Time Period | Q3 2024 |
| Consumption Volume (Q3 2024) | 58.94 billion liters (BL) |
| Key Segments | · Soft Drinks
· Alcoholic Drinks · Dairy and Soy Drinks and Milk Alternatives · Hot Drinks |
| Enquire & Decide | Discover the perfect solution for your business needs. Enquire now and let us help you make an informed decision before making a purchase. |
Segments Covered in the Report
US Beverages Market Segments Outlook (Volume, Billion Liters, Q3 2024)
- Soft Drinks
- Packaged Water
- Carbonates
- Iced/RTD Tea Drinks
- Sports Drinks
- Bulk/HOD Water
- Enhanced Water
- Flavored Water
- Juice
- Nectars
- Still Drinks
- Squash/Syrups
- Fruit Powders
- Iced/RTD Coffee Drinks
- Energy Drinks
- Alcoholic Drinks
- Beer
- Flavored Alcoholic Beverages
- Still Wine
- Cider
- Fortified Wine
- Brandy
- Gin & Genever
- Liqueurs
- Non-Alcoholic Spirits Drinks
- Rum
- Sparkling Wine
- Specialty Spirits
- Tequila & Mezcal
- Vodka
- Whiskey
- Dairy and Soy Drinks and Milk Alternatives
- White Milk
- Flavored Milk
- Grain, Nut, Rice and Seed Milk Alternative Drinks
- Condensed Milk
- Drinking Yogurt
- Evaporated Milk
- Fermented Milk
- Soymilk
- Hot Drinks
- Hot Coffee
- Hot Tea
- Other Hot Drinks
Scope
The report provides:
- Top line consumption volumes for Q3-2024 vs Q3-2023, moving annual totals (MAT), the full year 2023 provisional data, and 2024 forecasts for all beverage categories.
- Carbonates consumption data for Q3-2024 vs Q3-2023, moving annual totals (MAT), the full year 2023 provisional data, and 2024 forecasts split by regular vs low calorie, and key flavor.
- An economic mood indicator with an at a glance assessment of industry confidence levels, private label performance vs brands, and price trends.
- Insightful and valuable analysis of the drivers behind the latest quarterly trends and assumptions for the full year 2024.
Reasons to Buy
- Gain an in-depth understanding of the most up-to-date trends in the US beverage industry to support and enhance your strategic planning.
- Investigate the latest quarterly and emerging annual trends in the US to back your marketing initiatives.
- Analyze the latest beverage category 2024 forecast projections to make well-informed decisions on the outlook in the marketplace for your company.
- View a selection of the key quarterly new soft drinks product launches and identify competitor activity.
- Access a quarterly Special Focus on a current industry ‘hot topic’ offering qualitative insight from local consultants to determine opportunities for product innovation.
Table of Contents
Frequently asked questions
-
What was the US beverages market consumption volume in Q3 2024?
The beverage market consumption volume in the US was 58.94 billion liters (BL) in Q3 2024.
-
What are the key categories in the US beverages market?
The key categories in the US beverages market are soft drinks, alcoholic drinks, and dairy and soy drinks and milk alternatives, among others.
-
Which was the leading category in the US beverages market in Q3 2024?
In Q3 2024, soft drinks was the leading category in the US beverages market.
-
Which are the key sub-segments in the soft drinks category?
The primary sub-categories in the hot drinks category are packaged water, carbonates, iced/RTD tea drinks, sports drinks, and bulk/HOD water, among others.
Get in touch to find out about multi-purchase discounts
reportstore@globaldata.com
Tel +44 20 7947 2745
Sample Report
United States (US) Beverages Consumption Trends and Forecasts Tracker, Q3 2024 was curated by the best experts in the industry and we are confident about its unique quality. However, we want you to make the most beneficial decision for your business, so we offer free sample pages to help you:
- Assess the relevance of the report
- Evaluate the quality of the report
- Justify the cost
Download your copy of the sample report and make an informed decision about whether the full report will provide you with the insights and information you need.