United States (US) Hydropower Market Analysis by Size, Installed Capacity, Power Generation, Regulations, Key Players and Forecast to 2035

Powered by

All the vital news, analysis, and commentary curated by our industry experts.

$995

US Hydropower Market Report Overview

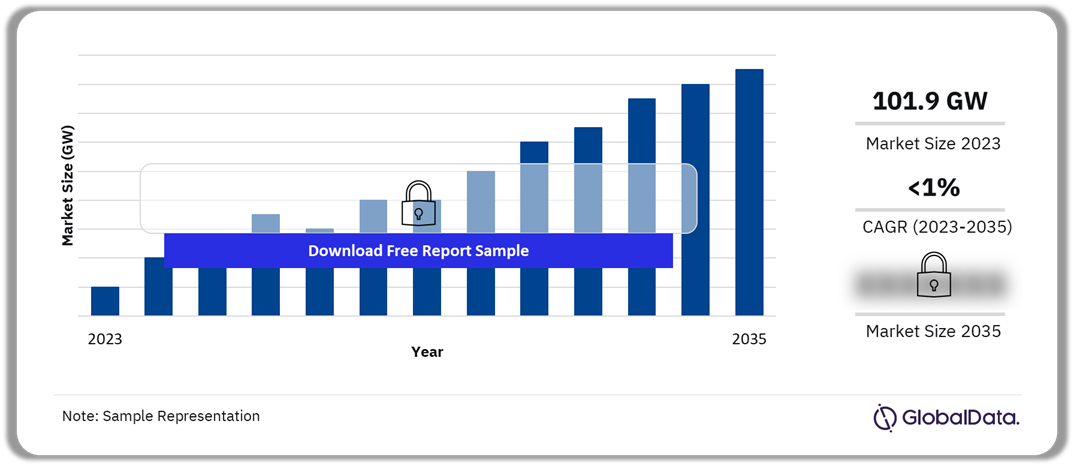
In 2023, the cumulative installed capacity for hydropower in the US was 101.9 GW and will grow at a CAGR of less than 1% during 2023-2035. Onshore wind represented the second most significant renewable power source in the country in 2023.

US Hydropower Market Outlook 2023-2035
Buy Full Report to Get More Insights into the US Hydropower Market Forecast,

Download a Free Report Sample

The US hydropower market research report discusses the renewable power market in the country and predicts future outcomes until 2035. The report also gives detailed coverage of the renewable energy policy framework governing the hydropower market in the US.

Cumulative Installed Capacity (2023) 101.9 GW
CAGR (2023-2035) <1%
Historical Period 2010-2022
Forecast Period 2023-2035
Regulations ·       Tax Cuts and New Jobs Act (TCJA)

·       Inflation Reduction Act (IRA)

Leading Companies ·       WEC Energy Group Inc

·       The AES Corp

·       Santee Cooper

·       PPL Corp

·       GE Vernova Inc
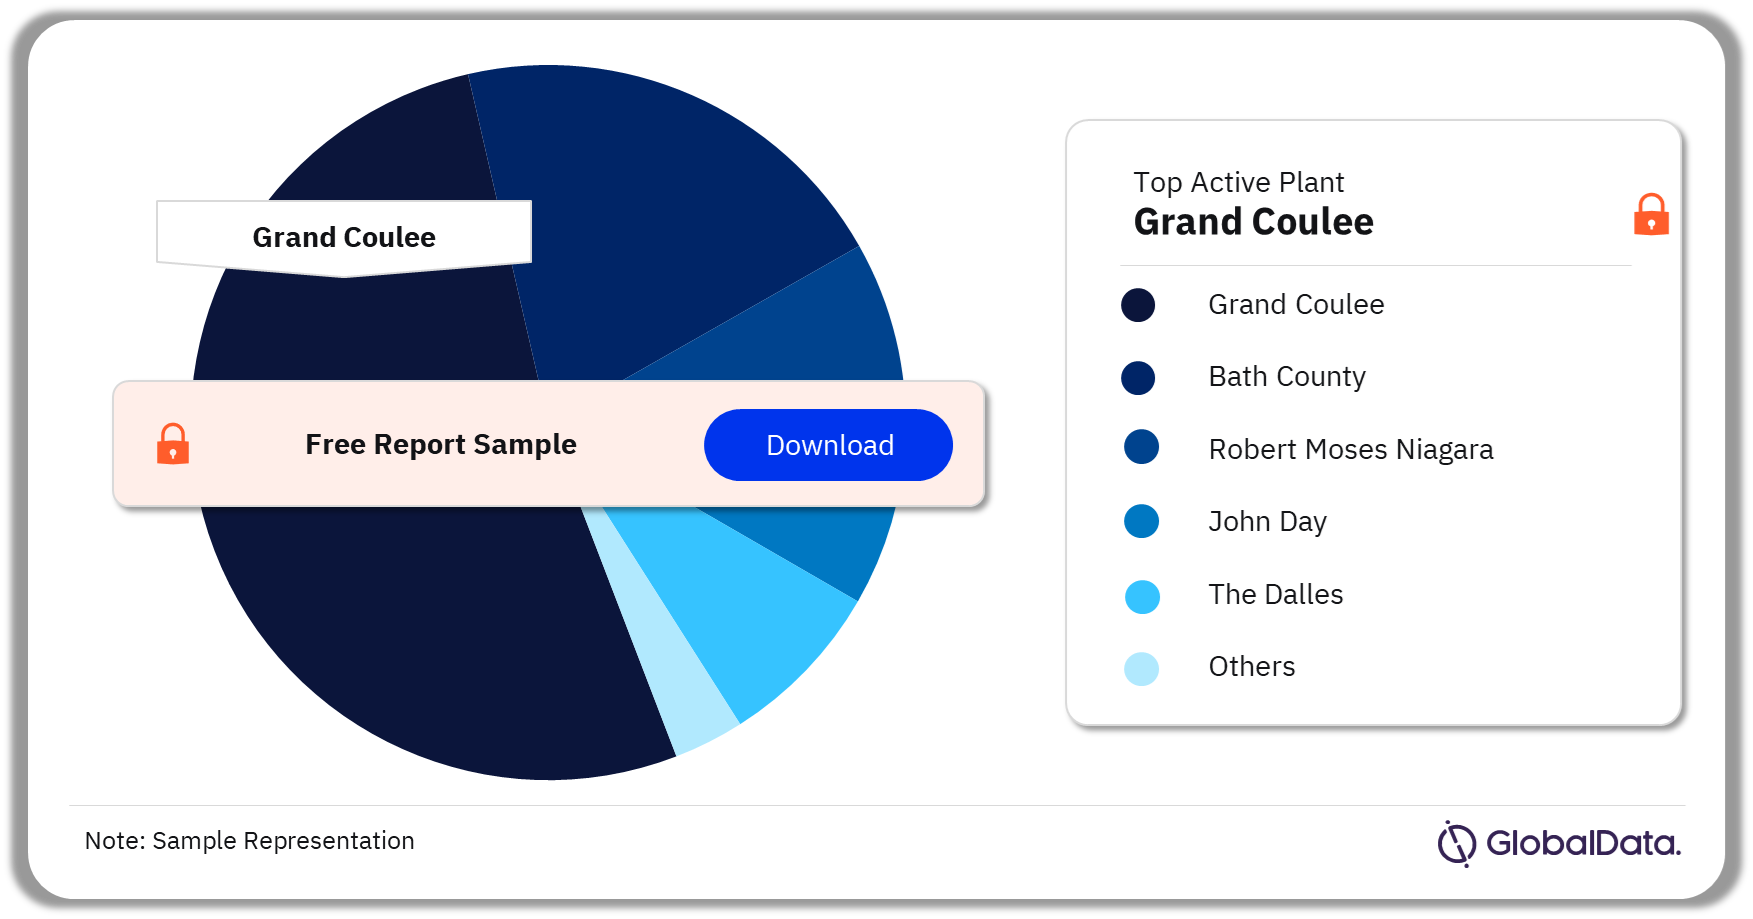
Key Active Plants ·       Grand Coulee

·       Bath County

·       Robert Moses Niagara

·       John Day

·       The Dalles
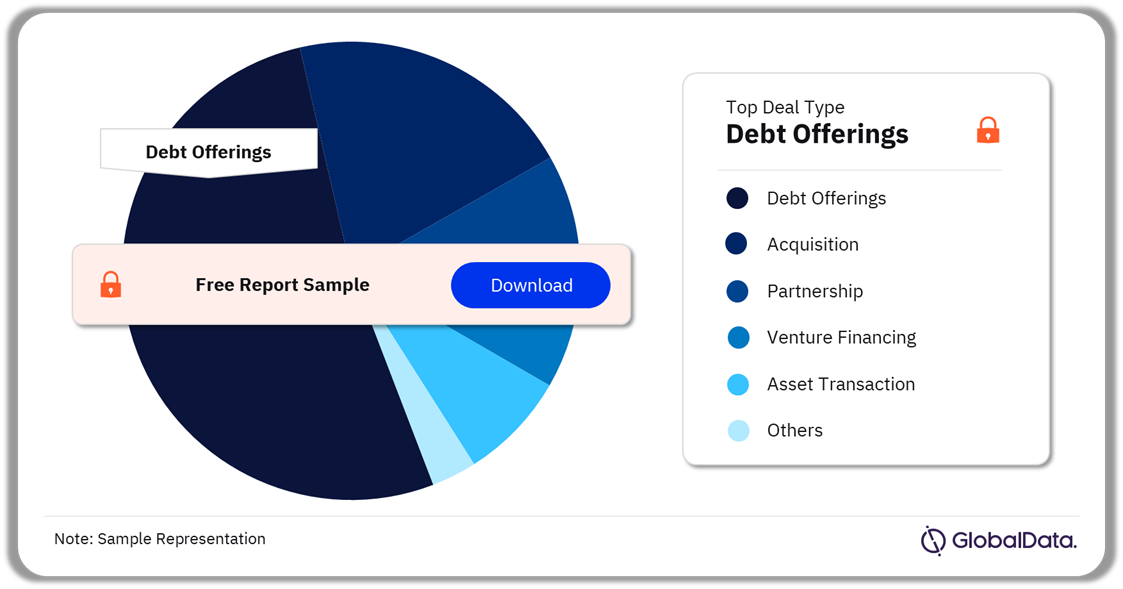
Key Deal Type ·       Debt Offerings

·       Acquisition

·       Partnership

·       Venture Financing

·       Asset Transaction

Enquire & Decide Discover the perfect solution for your business needs. Enquire now and let us help you make an informed decision before making a purchase.

US Renewable Energy Policy Framework

  • In December 2017, the US government passed a tax bill reducing corporate tax rates that impacted several industries. With regards to the renewable energy industry, there were initial concerns that the government might make changes to the federal ITC and may allow the accelerated depreciation on solar and select other renewable energy projects.
  • In August 2022, the US government enacted ‘The Inflation Reduction Act of 2022’ (IRA). It is a follow-up attempt after the ‘Build Back Better Act’ failed to achieve legislative support. Several of the renewable energy provision in the IRA are similar yet more enhanced than the Build Back Better Act.

Buy Full Report to Get More Insights into the US Renewable Energy Policy Framework,

Download a Free Report Sample

US Hydropower Market – Competitive Landscape

WEC Energy Group Inc, the AES Corp, Santee Cooper, PPL Corp and GE Vernova Inc are a few of the market players in the hydropower market in the US.

WEC Energy Group Inc: Headquartered in Milwaukee, Wisconsin, the US, WEC Energy Group Inc (WEC) is an energy holding company. It generates and distributes electricity and thermal energy and delivers natural gas. The company produces electric power using various sources like coal, natural gas, oil, hydro, solar, wind and biomass. WEC owns, maintains, monitors, and operates electric transmission systems; owns generating facilities and leases those to its group entities; provides natural gas storage and hub services for its sister companies; and owns underground natural gas storage facilities. It serves residential, commercial, community, government customers in Illinois, Wisconsin, Michigan, and Minnesota.

US Bioenergy Market Analysis by Companies

US Bioenergy Market Analysis by Companies

Buy Full Report to Get More Insights into the USn Bioenergy Market Companies,

Download a Free Report Sample

US Hydropower Market - Major Active Plants

Grand Coulee led the US hydropower market in terms of total capacity contribution in 2023.

US Hydropower Market, by Active Plants, 2023 (%)

US Hydropower Market, by Active Plants, 2023 (%)

Buy Full Report to Get More Insights into the US Hydropower Market Active Plants,

Download a Free Report Sample

US Hydropower Market Segmentation by Deal Types

In 2023, the hydropower market in the US recorded most of the debt offerings deals.

US Hydropower Market Analysis, by Deal Types, 2023 (%)

US Hydropower Market Analysis, by Deal Types, 2023 (%)

Buy the Full Report to Get More Insights into the US Hydropower Market Deal Types,

Download a Free Report Sample

Segments Covered in the Report

US Hydropower Market Deal Type Outlook (2022-2035)

  • Debt Offerings
  • Acquisition
  • Partnership
  • Venture Financing
  • Asset Transaction

Scope

The report analyses US’s hydropower market. The scope of the research includes –

  • A brief introduction to global carbon emissions and global primary energy consumption.
  • An overview of the country’s renewable power market, highlighting installed capacity trends (2010-2035), generation trends (2015-2035), and installed capacity split by various renewable power sources.
  • Detailed overview of the country’s hydropower market with installed capacity and generation trends, and major active and upcoming hydropower projects.
  • Deal analysis of the country’s hydropower market.
  • Key policies and regulatory framework supporting the development of hydropower sources.
  • Snapshots of some of the major market participants in the country.

Reasons to Buy

  • The report will enhance your decision-making capability in a more rapid and time sensitive manner.
  • Identify key growth and investment opportunities in country’s hydropower market.
  • Facilitate decision-making based on strong historic and forecast data for hydropower market.
  • Position yourself to gain the maximum advantage of the industry’s growth potential.
  • Develop strategies based on the latest regulatory events.
  • Identify key partners and business development avenues.
  • Understand and respond to your competitors’ business structure, strategy and prospects.

WEC Energy Group Inc
The AES Corp
Santee Cooper
PPL Corp
GE Vernova Inc

Table of Contents

Table of Contents

List of Tables

List of Figures

1. Introduction

1.1 Carbon Dioxide Emissions, Global, 2015–2023

1.2 Primary Energy Consumption, Global, 2015–2023

1.3 Report Guidance

2. Power Market, US

2.1 Power Market, US, Installed Capacity, 2015-2035

– Power Market, US, Cumulative Installed Capacity by Source, 2015-2035

– Power Market, US, Cumulative Installed Capacity Share by Source, 2023 and 2035

– Power Market, US, Net Capacity Additions by Source, 2024-2035

– Power Market, US, Capacity Growth by Source, 2023-2035

2.2 Power Market, US, Power Generation, 2015-2035

– Power Market, US, Power Generation by Source, 2015-2035

– Power Market, US, Growth in Power Generation by Source, 2023-2035

3. Hydropower Market, US

3.1 Hydropower Market, US, Installed Capacity, 2015-2035

– Hydropower Market, US, Cumulative Installed Capacity Split by Types, 2015-2035

3.2 Hydropower Market, US, Power Generation, 2015-2035

– Hydropower Market, US, Power Generation by Type, 2015-2035

3.3 Hydropower Market, US, Market Size, 2015-2030

3.4 Hydropower Market, US, Power Plants

– Hydropower Market, US, Major Active Plants

– Hydropower Market, US, Snapshot of Upcoming Plants

– Hydropower Market, US, Key Under-construction Projects.

3.5 Hydropower Market, US, Deal Analysis, 2023

– Hydropower Market, US, Deal Volume vs. Deal Value, 2015–2023

– Hydropower Market, US, Split by Deal Type, 2023

4. Hydropower Policy, US

4.1 Renewable Energy policies

– Brief of the upcoming 2025 Budget

– Climate Goals in Federal Fiscal Year 2024 Budget

– Tax Cuts and New Jobs Act (TCJA)

– Inflation Reduction Act (IRA)

– Production Tax Credits

– Investment Tax Credits

– Renewable Energy Target

– Empowering Rural America Program (New ERA)

– Tribal Energy Program Grant

– US Department of Energy – Loan Guarantee Program

4.2 Common State-Level Incentives

– Overview

– Renewable Portfolio Standards

– Renewable Energy Certificates

– Public Benefit Funds for Renewable Energy

– Interconnection Standards

– Net Metering

– Property Assessed Clean Energy (PACE)

5. Hydropower Market, US, Company Profiles

5.1 WEC Energy Group Inc

– WEC Energy Group Inc – Company Overview

– WEC Energy Group Inc – Business Description

– WEC Energy Group Inc – SWOT Analysis

– WEC Energy Group Inc – Major Products and Services

– WEC Energy Group Inc – Head Office

5.2 The AES Corp

– The AES Corp – Company Overview

– The AES Corp – Business Description

– The AES Corp – SWOT Analysis

– The AES Corp – Major Products and Services

– The AES Corp – Head Office

5.3 Santee Cooper

– Santee Cooper – Company Overview

– Santee Cooper – Business Description

– Santee Cooper – SWOT Analysis

– Santee Cooper – Major Products and Services

– Santee Cooper – Head Office

5.4 PPL Corp

– PPL Corp – Company Overview

– PPL Corp – Business Description

– PPL Corp – SWOT Analysis

– PPL Corp – Major Products and Services

– PPL Corp – Head Office

5.5 GE Vernova Inc

– GE Vernova Inc – Company Overview

– GE Vernova Inc – Business Description

– GE Vernova Inc – Major Products and Services

– GE Vernova Inc – Head Office

6. Appendix

6.1 Abbreviations

6.2 Methodology

– Coverage

– Secondary Research

– Primary Research

– Modelling and Forecasting

About GlobalData

Contact Us

Table

List of Tables

Table 1: Carbon Dioxide Emissions from Energy Consumption, Global, 2015–2023

Table 2: Primary Energy Consumption, Global, 2015–2023

Table 3: Power Market, US, Cumulative Installed Capacity by Source (GW), 2015-2035

Table 4: Power Market, US, Cumulative Installed Capacity Share by Source (%), 2023 and 2035

Table 5: Power Market, US, Net Capacity Additions by Source (GW), 2024-2035

Table 6: Power Market, US, Capacity Growth by Source, 2023-2035

Table 7: Power Market, US, Power Generation by Source (TWh), 2015-2035

Table 8: Power Market, US, Growth in Power Generation by Source, 2023-2035

Table 9: Hydropower Market, US, Installed Capacity (GW), 2015-2035

Table 10: Hydropower Market, US, Cumulative Installed Capacity by Type (GW), 2015-2035

Table 11: Hydropower Market, US, Power Generation (TWh), 2015-2035

Table 12: Hydropower Market, US, Power Generation by Type (TWh), 2015-2035

Table 13: Hydropower Market, US, Market Size ($M), 2015-2030

Table 14: Hydropower Market, US, Major Active Plants

Table 15: Hydropower Market, US, Snapshot of Upcoming Plants

Table 16: Hydropower Market, US, Key Under-construction Projects

Table 17: Hydropower Market, US, Deal Volume vs. Deal Value ($M), 2015–2023

Table 18: Hydropower Market, US, Deals by Type, 2023

Table 19: Renewable Energy Project Tax Components and changes with new tax code, US

Table 20: Renewable Energy Market, US, Investment Tax Credit

Table 21: Renewable Energy Market, US, Renewable Portfolio Standards, State Targets

Table 22: WEC Energy Group Inc, Major Products and Services

Table 23: The AES Corp, Major Products and Services

Table 24: Santee Cooper, Major Products and Services

Table 25: PPL Corp, Major Products and Services

Table 26: GE Vernova Inc, Major Products and Services

Table 27: Abbreviations

Figures

List of Figures

Figure 1: Carbon Dioxide Emissions from Energy Consumption, Global, 2015–2023

Figure 2: Primary Energy Consumption, Global, 2015–2023

Figure 3: Power Market, US, Cumulative Installed Capacity by Source (GW), 2015-2035

Figure 4: Power Market, US, Cumulative Installed Capacity Share by Source (%), 2023 and 2035

Figure 5: Power Market, US, Net Capacity Additions by Source (GW), 2024-2035

Figure 6: Power Market, US, Capacity Growth by Source, 2023-2035

Figure 7: Power Market, US, Power Generation by Source (TWh), 2015-2035

Figure 8: Power Market, US, Growth in Power Generation by Source, 2023-2035

Figure 9: Hydropower Market, US, Installed Capacity (GW), 2015-2035

Figure 10: Hydropower Market, US, Cumulative Installed Capacity by Type (GW), 2015-2035

Figure 11: Hydropower Market, US, Power Generation (TWh), 2015-2035

Figure 12: Hydropower Market, US, Power Generation by Type (TWh), 2015-2035

Figure 13: Hydropower Market, US, Market Size ($M), 2015-2030

Figure 14: Hydropower Market, US, Snapshot of Upcoming Plants

Figure 15: Hydropower Market, US, Deal Volume vs. Deal Value ($M), 2015–2023

Figure 16: Hydropower Market, US, Split by Deal Type (%), 2023

Frequently asked questions

United States (US) Hydropower Market Analysis by Size, Installed Capacity, Power Generation, Regulations, Key Players and Forecast to 2035 standard reports
Currency USD
$995

Can be used by individual purchaser only

$1,990

Can be shared globally by unlimited users within the purchasing corporation e.g. all employees of a single company


Undecided about purchasing this report?

Enquire Before Buying

Get in touch to find out about multi-purchase discounts

reportstore@globaldata.com
Tel +44 20 7947 2745

See what our customers are saying
testimonial-image
testimonial-image
testimonial-image
testimonial-image
testimonial-image
testimonial-image
testimonial-image

“The GlobalData platform is our go-to tool for intelligence services. GlobalData provides an easy way to access comprehensive intelligence data around multiple sectors, which essentially makes it a one-for-all intelligence platform, for tendering and approaching customers.

GlobalData is very customer orientated, with a high degree of personalised services, which benefits everyday use. The highly detailed project intelligence and forecast reports can be utilised across multiple departments and workflow scopes, from operational to strategic level, and often support strategic decisions. GlobalData Analytics and visualisation solutions has contributed positively when preparing management presentations and strategic papers.”

Business Intelligence & Marketing Manager, SAL Heavy Lift

“COVID-19 has caused significant interference to our business and the COVID-19 intelligence from GlobalData has helped us reach better decisions around strategy. These two highlights have helped enormously to understand the projections into the future concerning our business units, we also utilise the project database to source new projects for Liebherr-Werk to use as an additional source to pitch for new business.”

Market Analyst & Management, Liebherr-Werk

Your daily news has saved me a lot of time and keeps me up-to-date with what is happening in the market, I like that you almost always have a link to the source origin. We also use your market data in our Strategic Business Process to support our business decisions. By having everything in one place on the Intelligence Center it has saved me a lot of time versus looking on different sources, the alert function also helps with this.

Head of Key Accounts, Saab AB

Having used several other market research companies, I find that GlobalData manages to provide that ‘difficult-to-get’ market data that others can’t, as well as very diverse and complete consumer surveys.

Marketing Intelligence Manager, Portugal Foods

Our experience with GlobalData has been very good, from the platform itself to the people. I find that the analysts and the account team have a high level of customer focus and responsiveness and therefore I can always rely on. The platform is more holistic than other providers. It is convenient and almost like a one stop shop. The pricing suite is highly competitive and value for our organisation.

I like reports that inform new segments such as the analysis on generation Z, millennials, the impact of COVID 19 to our banking customers and their new channel habits. Secondly the specialist insight on affluent sector significantly increases our understanding about this group of customers. The combination of those give us depth and breadth of the evolving market.

I’m in the business of answering and helping people make decisions so with the intelligence center I can do that, effectively and efficiently. I can share quickly key insights that answer and satisfy our country stakeholders by giving them many quality studies and primary research about competitive landscape beyond the outlook of our bank. It helps me be seen as an advisory partner and that makes a big difference. A big benefit of our subscription is that no one holds the whole data and because it allows so many people, so many different parts of our organisation have access, it enables all teams to have the same level of knowledge and decision support.

Head of Customer Insight and Research, Standard Chartered

“I know that I can always rely on Globaldata’s work when I’m searching for the right consumer and market insights. I use Globaldata insights to understand the changing market & consumer landscape and help create better taste & wellbeing solutions for our customers in food, beverage and healthcare industries.

Globaldata has the right data and the reports are of very high quality compared to your competitors. Globaldata not only has overall market sizes & consumer insights on food & beverages but also provides insights at the ingredient & flavour level. That is key for B2B companies like Givaudan. This way we understand our customers’ business and also gain insight to our unique industry”

Head of Consumer Sensory Insights, Givaudan

GlobalData provides a great range of information and reports on various sectors that is highly relevant, timely, easy to access and utilise.  The reports and data dashboards help engagement with clients; they provide valuable industry and market insights that can enrich client conversations and can help in the shaping of value propositions. Moreover, using GlobalData products has helped increase my knowledge of the finance sector, the players within it, and the general threats and opportunities.

I find the consumer surveys that are carried out to be extremely beneficial and not something I have seen anywhere else. They provided an insightful view of why and which consumers take (or don’t) particular financial products. This can help shape conversations with clients to ensure they make the right strategic decisions for their business.

One of the challenges I have found is that data in the payments space is often piecemeal. With GD all of the data I need is in one place, but it also comes with additional market reports that provide useful extra context and information. Having the ability to set-up alerts on relevant movements in the industry, be it competitors or customers, and have them emailed directly to me, ensures I get early sight of industry activity and don’t have to search for news.

Senior Account Manager, TSYS
Go even deeper with GlobalData Intelligence Center

Every Company Report we produce is powered by the GlobalData Intelligence Center.

Subscribing to our intelligence platform means you can monitor developments at United States (US) Hydropower Market Analysis by Size, Installed Capacity, Power Generation, Regulations, Key Players and Forecast to 2035 in real time.

  • Access a live United States (US) Hydropower Market Analysis by Size, Installed Capacity, Power Generation, Regulations, Key Players and Forecast to 2035 dashboard for 12 months, with up-to-the-minute insights.
  • Fuel your decision making with real-time deal coverage and media activity.
  • Turn insights on financials, deals, products and pipelines into powerful agents of commercial advantage.