Accessing the in-depth insight from the ‘Digital Payments’ report can help you:
- Make informed decisions about market entry, technology adoption, and consumer spending patterns
- Identify your competitors’ capabilities to stay ahead in the market
- Identify promising segment analysis (Mode of Payment and Industry), growth trends, regional trends, and markets to expand your regional presence, product portfolio or successful investment
- Anticipate expected changes in demand and adjust your business development strategies
How is our ‘Digital Payments’ report different from other reports in the market?
- The report presents in-depth market sizing and forecast at a segment level for more than 30 countries including historical and forecast analysis by transaction value and volume for the period 2020-2030 for market assessment
- Detailed segmentation by mode of payment – digital wallet, credit card, debit card, online banking, others
- The report highlights segmentation at industry level – retail, hospitality, entertainment, healthcare, others
- The report offers technological and regulatory trends, along with driving and challenging factors impacting the digital payments market.
- The growth innovation matrix included in the report, divides the market players into four categories i.e., flagbearers, contenders, specialists, and experimenters, which will help value chain participants in understanding how competition is performing based on their revenue growth and their R&D efforts
- The report provides an analysis of M&As, venture financing deals, patent activity, social media, and jobs in the digital payment market.
- Competitive landscape includes list of key emerging companies/technology disruptors/innovators and recent mergers & acquisitions
- Competitive profiling and benchmarking of key players in the market to provide deeper understanding of industry competition
We recommend this valuable source of information to anyone involved in:
- Digital Payments Company
- Fintech Company
- BNPL companies
- Retail Banks
- Ecommerce Companies
- Online Retailers
- Venture Capitalists
- Investment Advisors
- Consultancy Firms
- Management Consultants and Analysts
To Get a Snapshot of the Digital Payments Market Report, Download a Free Report Sample
Digital Payments Market Report Overview
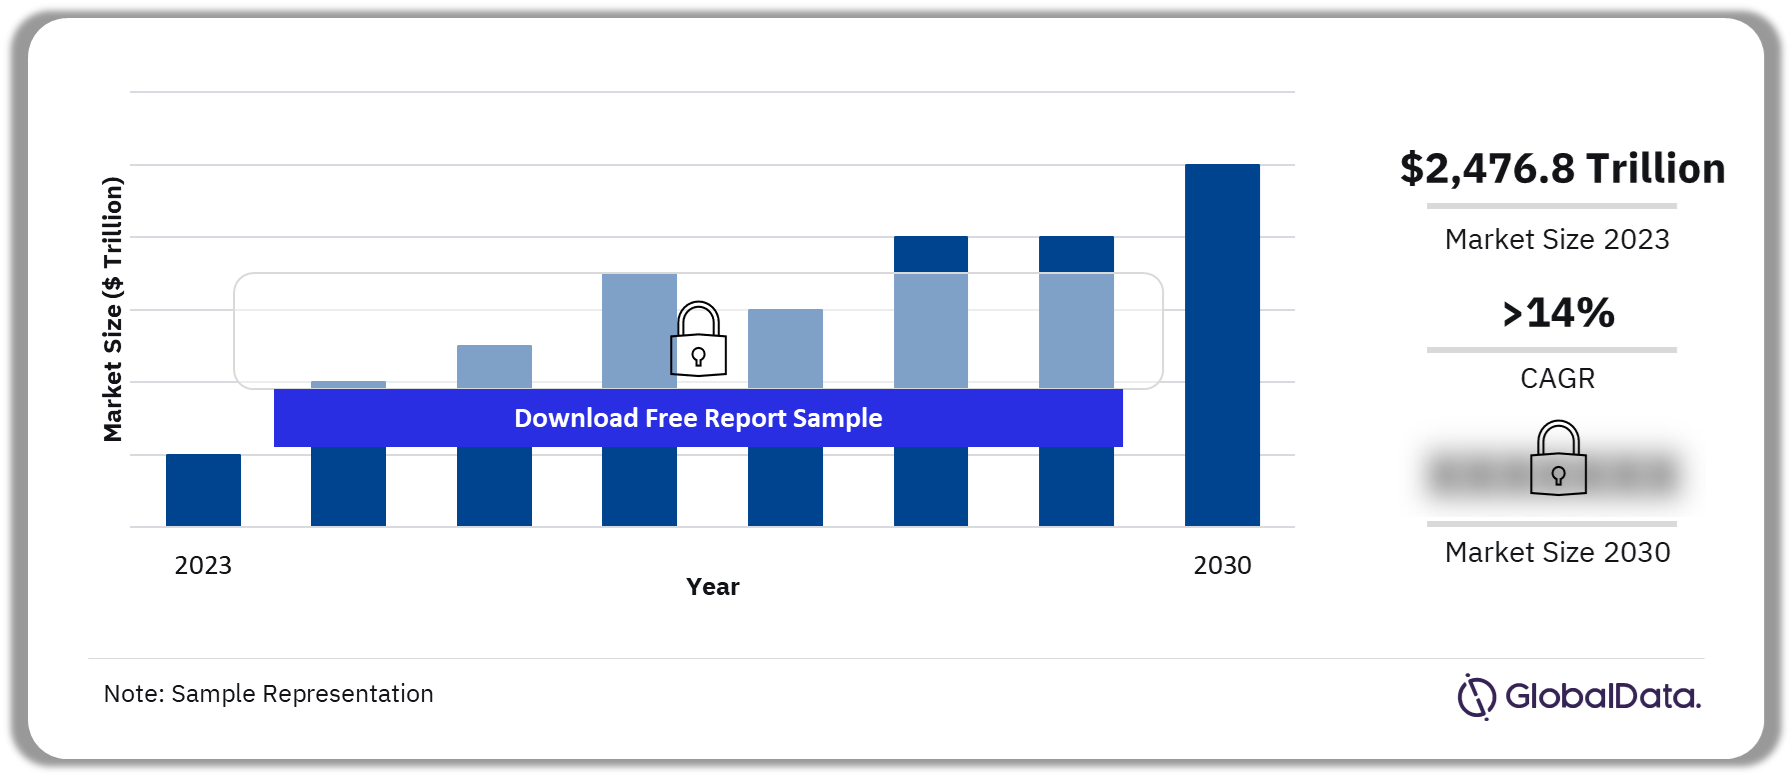
The digital payments market size will be valued at $2,476.8 trillion in 2023 and will grow at a CAGR of more than 14% over the forecast period. The following are a few of the key highlights in the market report:
- The adoption of digital payments will be supported by high level of convenience offered as they allow users to make transactions quickly and easily. Further, they eliminate the need for physical cash or checks, which can be inconvenient and time-consuming to handle.
- In 2023, digital wallets dominated the mode of payment. They are commonly used for digital payments as they provide a convenient and secure way to store payment information and make transactions online or through mobile devices.
- The Asia Pacific digital payment market by transaction value and volume was the highest in 2023. Governments in the Asia Pacific region have been promoting digital payments to increase financial inclusion, reduce the use of cash, and drive economic growth.
Digital Payments Market Outlook, 2020-2030 ($ Trillion)
View Sample Report for Additional Insights on Digital Payments Market Forecast, Download a Free Report Sample
The digital payments market faces significant challenges from lack of infrastructure and security concerns which are expected to impact growth over the forecast period. Digital payments require a reliable and fast internet connection, which is often lacking in many parts of the world. This makes it difficult for people in rural or remote areas to access digital payment platforms.
| Market Size by Transaction Value in 2023 | $2,476.8 trillion |
| Market Size by Transaction Value in 2030 | $5,848.5 trillion |
| CAGR (2023-2030) | 14.3% |
| Forecast Period | 2023-2030 |
| Historic Data | 2020-2022 |
| Report Scope & Coverage | Revenue Forecast, Competitive Index, Company Landscape, Growth Trends |
| Mode of Payment | Digital Wallet, Credit Card, Debit Card, Online Banking, Others |
| Industry | Retail, Hospitality, Entertainment, Healthcare, Others |
| Region Coverage | North America, Europe, Asia Pacific, South & Central America, Middle East & Africa |
| Country Coverage | US, Canada, UK, France, Germany |
| Key Companies | Alibaba Group Holding Ltd, American Express Co, Apple Inc, Google LLC, Mastercard Inc |
| Enquire & Decide | Discover the perfect solution for your business needs. Enquire now and let us help you make an informed decision before making a purchase. |
Digital Payments Market Segmentation by Mode of Payment
Digital payments market mode of payment includes digital wallets, credit cards, debit cards, online banking, and others. Digital wallets are commonly used for digital payments. They offer a convenient and secure way to make transactions online or through mobile devices and store payment information. They also provide an efficient and streamlined transaction process for digital payments by storing consumers’ debit and credit cards. Currently, digital wallets are directly linked to cards, but they pose an indirect threat to card payments as they can be linked to users’ accounts, enabling A2A and P2P transfers through real-time payment (RTP) rails or even blockchain systems for back-end processing.
Digital Payments Market Share by Mode of Payment, 2023 (%)

Fetch Sample PDF for Segment-Specific Revenues and Shares, Download a Free Report Sample
Digital Payments Market Segmentation by Industry
Traditionally, online payments referred specifically to ecommerce, being the buying and selling of goods and services over the internet. But as internet technologies have become more pervasive and portable, more and more types of payment are moving online. Now digital payments are used in most of the industries as a primary mode of payment.
In the pursuit of maximizing revenue-generating transactions, the payments industry has traditionally been advocating for cashless societies. Efforts by governments to discourage the use of cash, such as in Italy and India where the objective is to reduce the size of the black economy and increase tax revenues from electronic payments, are supported by the payments industry. The COVID-19 pandemic has accelerated this trend, with governments and companies worldwide promoting and launching mobile payment services.
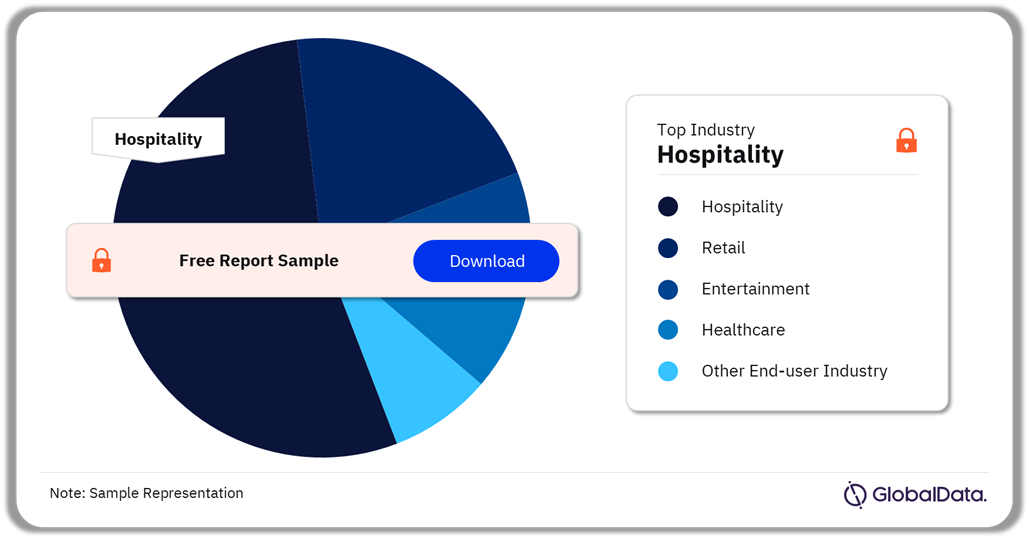
Digital Payments Market Share by Industry, 2023 (%)
Digital Payments Market Outlook Report with Detailed Segment Analysis is Available with GlobalData Now! Download a Free Report Sample
Digital Payments Market Analysis by Region
The Asia Pacific digital payment market by transaction value and volume was the highest in 2023, capturing over 50% of the overall market. The regional demand by value of transactions was led by China and UK collectively accounting for over 50% of the digital payments market in 2023. The regional demand by volume of transactions was led by China and US collectively accounting for over 40% of the digital payments market in 2023.
Asia-Pacific Digital Payments Market Share by Country, 2023 (%)

View Sample Report for Additional Digital Payments Market Insights, Download a Free Report Sample
Asia Pacific is projected to retain the largest share by 2030 accounting for a major share of the global digital payments market by transaction value and volume, with a forecasted growth rate exceeding 15% from 2023 to 2030. Governments in the Asia Pacific region have been promoting digital payments to increase financial inclusion, reduce the use of cash, and drive economic growth.
Digital Payments Market – Competitive Landscape
The leading companies that specialize in digital payments are Alibaba Group Holding Ltd, American Express Co, Apple Inc, Google LLC, and Mastercard Inc, and others.
A Few of the Leading Players in the Digital Payments Market
- Alibaba Group Holding Ltd.
- American Express Co.
- Apple Inc.
- Google LLC
- Mastercard Inc.
Other Digital Payments Market Vendors Mentioned
Adyen, Affirm, Afterpay, Bud, China UnionPay, Danske, G+D, Global Payments, JPMorgan Chase, Jumio, Klarna, Monzo, MoneyGram, M-PESA, Plaid, Revolut, Ripple, RuPay, Square, Stripe, Tencent, Tink, TrueLayer, Trulioo, Wise, and Veridium
Digital Payments Market Analysis by Companies

Buy the Full Report to Know More about Leading Digital Payments Market Players
Download a Free Report Sample
Digital Payments Market Segments and Scope
GlobalData Plc has segmented the digital payments market report by mode of payment, industry, and region:
Digital Payments Market Mode of Payment Outlook (Transaction Value and Volume, $ Trillion, 2020-2030)
- Digital wallet
- Credit Card
- Debit Card
- Online banking
Digital Payments Market Industry Outlook (Transaction Value and Volume, $ Trillion, 2020-2030)
- Retail
- Hospitality
- Entertainment
- Healthcare
- Other End-user Industry
Digital Payments Market Regional Outlook (Transaction Value and Volume, $ Trillion, 2020-2030)
- North America
- Europe
- Asia Pacific
- South & Central America
- Middle East & Africa
Digital Payments Market Country-Wise Outlook (Transaction Value and Volume, $ Trillion, 2020-2030)
- US
- Canada
- UK
- France
- Germany
Key Stakeholders
Table of Contents
Graphs
List of Figures
Fig 1: Digital Payment Market – Segmentation
Fig 2: Digital Payment Market – Timeline
Fig 3: Digital Payment Market- Value Chain Analysis
Fig 4: Digital Payment Market- M&A Analysis
Fig 5: Digital Payment Market- VF Analysis
Fig 6: Digital Payment Market- Patent Analysis
Fig 7: Digital Payment Market- Social Media Analysis
Fig 8: Digital Payment Market- Job Analysis
Fig 9: Global Digital Payment Market By Mode of Payment, 2020 – 2030 ($B)
Fig 10: Global Digital Payment Market By Industry, 2020 – 2030 ($B)
Fig 11: North America Digital Payment Market By Mode of Payment, 2020 – 2030 ($B)
Fig 12: North America Digital Payment Market By Industry, 2020 – 2030 ($B)
Fig 13: US Digital Payment Market By Mode of Payment, 2020 – 2030 ($B)
Fig 14: US Digital Payment Market By Industry, 2020 – 2030 ($B)
Fig 15: Canada Digital Payment Market By Mode of Payment, 2020 – 2030 ($B)
Fig 16: Canada Digital Payment Market By Industry, 2020 – 2030 ($B)
Fig 17: Asia Pacific Digital Payment Market By Mode of Payment, 2020 – 2030 ($B)
Fig 18: Asia Pacific Digital Payment Market By Industry, 2020 – 2030 ($B)
Fig 19: Australia Digital Payment Market By Mode of Payment, 2020 – 2030 ($B)
Fig 20: Australia Digital Payment Market By Industry, 2020 – 2030 ($B)
Fig 21: India Digital Payment Market By Mode of Payment, 2020 – 2030 ($B)
Fig 22: India Digital Payment Market By Industry, 2020 – 2030 ($B)
Fig 23: Indonesia Digital Payment Market By Mode of Payment, 2020 – 2030 ($B)
Fig 24: Indonesia Digital Payment Market By Industry, 2020 – 2030 ($B)
Fig 25: Japan Digital Payment Market By Mode of Payment, 2020 – 2030 ($B)
Fig 26: Japan Digital Payment Market By Industry, 2020 – 2030 ($B)
Fig 27: Singapore Digital Payment Market By Mode of Payment, 2020 – 2030 ($B)
Fig 28: Singapore Digital Payment Market By Industry, 2020 – 2030 ($B)
Fig 29: China Digital Payment Market By Mode of Payment, 2020 – 2030 ($B)
Fig 30: China Digital Payment Market By Industry, 2020 – 2030 ($B)
Fig 31: Korea Digital Payment Market By Mode of Payment, 2020 – 2030 ($B)
Fig 32: Korea Digital Payment Market By Industry, 2020 – 2030 ($B)
Fig 33: Malaysia Digital Payment Market By Mode of Payment, 2020 – 2030 ($B)
Fig 34: Malaysia Digital Payment Market By Industry, 2020 – 2030 ($B)
Fig 35: Rest of Asia Pacific Digital Payment Market By Mode of Payment, 2020 – 2030 ($B)
Fig 36: Rest of Asia Pacific Digital Payment Market By Industry, 2020 – 2030 ($B)
Fig 37: Europe Digital Payment Market By Mode of Payment, 2020 – 2030 ($B)
Fig 38: Europe Digital Payment Market By Industry, 2020 – 2030 ($B)
Fig 39: Russia Digital Payment Market By Mode of Payment, 2020 – 2030 ($B)
Fig 40: Russia Digital Payment Market By Industry, 2020 – 2030 ($B)
Fig 41: Belgium Digital Payment Market By Mode of Payment, 2020 – 2030 ($B)
Fig 42: Belgium Digital Payment Market By Industry, 2020 – 2030 ($B)
Fig 43: Germany Digital Payment Market By Mode of Payment, 2020 – 2030 ($B)
Fig 44: Germany Digital Payment Market By Industry, 2020 – 2030 ($B)
Fig 45: Italy Digital Payment Market By Mode of Payment, 2020 – 2030 ($B)
Fig 46: Italy Digital Payment Market By Industry, 2020 – 2030 ($B)
Fig 47: Spain Digital Payment Market By Mode of Payment, 2020 – 2030 ($B)
Fig 48: Spain Digital Payment Market By Industry, 2020 – 2030 ($B)
Fig 49: Ireland Digital Payment Market By Mode of Payment, 2020 – 2030 ($B)
Fig 50: Ireland Digital Payment Market By Industry, 2020 – 2030 ($B)
Fig 51: Denmark Digital Payment Market By Mode of Payment, 2020 – 2030 ($B)
Fig 52: Denmark Digital Payment Market By Industry, 2020 – 2030 ($B)
Fig 53: Finland Digital Payment Market By Mode of Payment, 2020 – 2030 ($B)
Fig 54: Finland Digital Payment Market By Industry, 2020 – 2030 ($B)
Fig 55: Netherlands Digital Payment Market By Mode of Payment, 2020 – 2030 ($B)
Fig 56: Netherlands Digital Payment Market By Industry, 2020 – 2030 ($B)
Fig 57: Poland Digital Payment Market By Mode of Payment, 2020 – 2030 ($B)
Fig 58: Poland Digital Payment Market By Industry, 2020 – 2030 ($B)
Fig 59: Sweden Digital Payment Market By Mode of Payment, 2020 – 2030 ($B)
Fig 60: Sweden Digital Payment Market By Industry, 2020 – 2030 ($B)
Fig 61: France Digital Payment Market By Mode of Payment, 2020 – 2030 ($B)
Fig 62: France Digital Payment Market By Industry, 2020 – 2030 ($B)
Fig 63: UK Digital Payment Market By Mode of Payment, 2020 – 2030 ($B)
Fig 64: UK Digital Payment Market By Industry, 2020 – 2030 ($B)
Fig 65: Rest of Europe Digital Payment Market By Mode of Payment, 2020 – 2030 ($B)
Fig 66: Rest of Europe Digital Payment Market By Industry, 2020 – 2030 ($B)
Fig 67: South & Central America Digital Payment Market By Mode of Payment, 2020 – 2030 ($B)
Fig 68: South & Central America Digital Payment Market By Industry, 2020 – 2030 ($B)
Fig 69: Argentina Digital Payment Market By Mode of Payment, 2020 – 2030 ($B)
Fig 70: Argentina Digital Payment Market By Industry, 2020 – 2030 ($B)
Fig 71: Mexico Digital Payment Market By Mode of Payment, 2020 – 2030 ($B)
Fig 72: Mexico Digital Payment Market By Industry, 2020 – 2030 ($B)
Fig 73: Brazil Digital Payment Market By Mode of Payment, 2020 – 2030 ($B)
Fig 74: Brazil Digital Payment Market By Industry, 2020 – 2030 ($B)
Fig 75: Colombia Digital Payment Market By Mode of Payment, 2020 – 2030 ($B)
Fig 76: Colombia Digital Payment Market By Industry, 2020 – 2030 ($B)
Fig 77: Peru Digital Payment Market By Mode of Payment, 2020 – 2030 ($B)
Fig 78: Peru Digital Payment Market By Industry, 2020 – 2030 ($B)
Fig 79: Rest of South & Central America Digital Payment Market By Mode of Payment, 2020 – 2030 ($B)
Fig 80: Rest of South & Central America Digital Payment Market By Industry, 2020 – 2030 ($B)
Fig 81: Middle East & Africa Digital Payment Market By Mode of Payment, 2020 – 2030 ($B)
Fig 82: Middle East & Africa Digital Payment Market By Industry, 2020 – 2030 ($B)
Fig 83: Saudi Arabia Digital Payment Market By Mode of Payment, 2020 – 2030 ($B)
Fig 84: Saudi Arabia Digital Payment Market By Industry, 2020 – 2030 ($B)
Fig 85: Turkey Digital Payment Market By Mode of Payment, 2020 – 2030 ($B)
Fig 86: Turkey Digital Payment Market By Industry, 2020 – 2030 ($B)
Fig 87: South Africa Digital Payment Market By Mode of Payment, 2020 – 2030 ($B)
Fig 88: South Africa Digital Payment Market By Industry, 2020 – 2030 ($B)
Fig 89: Rest of Middle East & Africa Digital Payment Market By Mode of Payment, 2020 – 2030 ($B)
Fig 90: Rest of Middle East & Africa Digital Payment Market By Industry, 2020 – 2030 ($B)
Fig 91: Global Digital Payment Market By Mode of Payment, 2020 – 2030 (B)
Fig 92: Global Digital Payment Market By Industry, 2020 – 2030 (B)
Fig 93: North America Digital Payment Market By Mode of Payment, 2020 – 2030 (B)
Fig 94: North America Digital Payment Market By Industry, 2020 – 2030 (B)
Fig 95: US Digital Payment Market By Mode of Payment, 2020 – 2030 (B)
Fig 96: US Digital Payment Market By Industry, 2020 – 2030 (B)
Fig 97: Canada Digital Payment Market By Mode of Payment, 2020 – 2030 (B)
Fig 98: Canada Digital Payment Market By Industry, 2020 – 2030 (B)
Fig 99: Asia Pacific Digital Payment Market By Mode of Payment, 2020 – 2030 (B)
Fig 100: Asia Pacific Digital Payment Market By Industry, 2020 – 2030 (B)
Fig 101: Australia Digital Payment Market By Mode of Payment, 2020 – 2030 (B)
Fig 102: Australia Digital Payment Market By Industry, 2020 – 2030 (B)
Fig 103: India Digital Payment Market By Mode of Payment, 2020 – 2030 (B)
Fig 104: India Digital Payment Market By Industry, 2020 – 2030 (B)
Fig 105: Indonesia Digital Payment Market By Mode of Payment, 2020 – 2030 (B)
Fig 106: Indonesia Digital Payment Market By Industry, 2020 – 2030 (B)
Fig 107: Japan Digital Payment Market By Mode of Payment, 2020 – 2030 (B)
Fig 108: Japan Digital Payment Market By Industry, 2020 – 2030 (B)
Fig 109: Singapore Digital Payment Market By Mode of Payment, 2020 – 2030 (B)
Fig 110: Singapore Digital Payment Market By Industry, 2020 – 2030 (B)
Fig 111: China Digital Payment Market By Mode of Payment, 2020 – 2030 (B)
Fig 112: China Digital Payment Market By Industry, 2020 – 2030 (B)
Fig 113: Korea Digital Payment Market By Mode of Payment, 2020 – 2030 (B)
Fig 114: Korea Digital Payment Market By Industry, 2020 – 2030 (B)
Fig 115: Malaysia Digital Payment Market By Mode of Payment, 2020 – 2030 (B)
Fig 116: Malaysia Digital Payment Market By Industry, 2020 – 2030 (B)
Fig 117: Rest of Asia Pacific Digital Payment Market By Mode of Payment, 2020 – 2030 (B)
Fig 118: Rest of Asia Pacific Digital Payment Market By Industry, 2020 – 2030 (B)
Fig 119: Europe Digital Payment Market By Mode of Payment, 2020 – 2030 (B)
Fig 120: Europe Digital Payment Market By Industry, 2020 – 2030 (B)
Fig 121: Russia Digital Payment Market By Mode of Payment, 2020 – 2030 (B)
Fig 122: Russia Digital Payment Market By Industry, 2020 – 2030 (B)
Fig 123: Belgium Digital Payment Market By Mode of Payment, 2020 – 2030 (B)
Fig 124: Belgium Digital Payment Market By Industry, 2020 – 2030 (B)
Fig 125: Germany Digital Payment Market By Mode of Payment, 2020 – 2030 (B)
Fig 126: Germany Digital Payment Market By Industry, 2020 – 2030 (B)
Fig 127: Italy Digital Payment Market By Mode of Payment, 2020 – 2030 (B)
Fig 128: Italy Digital Payment Market By Industry, 2020 – 2030 (B)
Fig 129: Spain Digital Payment Market By Mode of Payment, 2020 – 2030 (B)
Fig 130: Spain Digital Payment Market By Industry, 2020 – 2030 (B)
Fig 131: Ireland Digital Payment Market By Mode of Payment, 2020 – 2030 (B)
Fig 132: Ireland Digital Payment Market By Industry, 2020 – 2030 (B)
Fig 133: Denmark Digital Payment Market By Mode of Payment, 2020 – 2030 (B)
Fig 134: Denmark Digital Payment Market By Industry, 2020 – 2030 (B)
Fig 135: Finland Digital Payment Market By Mode of Payment, 2020 – 2030 (B)
Fig 136: Finland Digital Payment Market By Industry, 2020 – 2030 (B)
Fig 137: Netherlands Digital Payment Market By Mode of Payment, 2020 – 2030 (B)
Fig 138: Netherlands Digital Payment Market By Industry, 2020 – 2030 (B)
Fig 139: Poland Digital Payment Market By Mode of Payment, 2020 – 2030 (B)
Fig 140: Poland Digital Payment Market By Industry, 2020 – 2030 (B)
Fig 141: Sweden Digital Payment Market By Mode of Payment, 2020 – 2030 (B)
Fig 142: Sweden Digital Payment Market By Industry, 2020 – 2030 (B)
Fig 143: France Digital Payment Market By Mode of Payment, 2020 – 2030 (B)
Fig 144: France Digital Payment Market By Industry, 2020 – 2030 (B)
Fig 145: UK Digital Payment Market By Mode of Payment, 2020 – 2030 (B)
Fig 146: UK Digital Payment Market By Industry, 2020 – 2030 (B)
Fig 147: Rest of Europe Digital Payment Market By Mode of Payment, 2020 – 2030 (B)
Fig 148: Rest of Europe Digital Payment Market By Industry, 2020 – 2030 (B)
Fig 149: South & Central America Digital Payment Market By Mode of Payment, 2020 – 2030 (B)
Fig 150: South & Central America Digital Payment Market By Industry, 2020 – 2030 (B)
Fig 151: Argentina Digital Payment Market By Mode of Payment, 2020 – 2030 (B)
Fig 152: Argentina Digital Payment Market By Industry, 2020 – 2030 (B)
Fig 153: Mexico Digital Payment Market By Mode of Payment, 2020 – 2030 (B)
Fig 154: Mexico Digital Payment Market By Industry, 2020 – 2030 (B)
Fig 155: Brazil Digital Payment Market By Mode of Payment, 2020 – 2030 (B)
Fig 156: Brazil Digital Payment Market By Industry, 2020 – 2030 (B)
Fig 157: Colombia Digital Payment Market By Mode of Payment, 2020 – 2030 (B)
Fig 158: Colombia Digital Payment Market By Industry, 2020 – 2030 (B)
Fig 159: Peru Digital Payment Market By Mode of Payment, 2020 – 2030 (B)
Fig 160: Peru Digital Payment Market By Industry, 2020 – 2030 (B)
Fig 161: Rest of South & Central America Digital Payment Market By Mode of Payment, 2020 – 2030 (B)
Fig 162: Rest of South & Central America Digital Payment Market By Industry, 2020 – 2030 (B)
Fig 163: Middle East & Africa Digital Payment Market By Mode of Payment, 2020 – 2030 (B)
Fig 164: Middle East & Africa Digital Payment Market By Industry, 2020 – 2030 (B)
Fig 165: Saudi Arabia Digital Payment Market By Mode of Payment, 2020 – 2030 (B)
Fig 166: Saudi Arabia Digital Payment Market By Industry, 2020 – 2030 (B)
Fig 167: Turkey Digital Payment Market By Mode of Payment, 2020 – 2030 (B)
Fig 168: Turkey Digital Payment Market By Industry, 2020 – 2030 (B)
Fig 169: South Africa Digital Payment Market By Mode of Payment, 2020 – 2030 (B)
Fig 170: South Africa Digital Payment Market By Industry, 2020 – 2030 (B)
Fig 171: Rest of Middle East & Africa Digital Payment Market By Mode of Payment, 2020 – 2030 (B)
Fig 172: Rest of Middle East & Africa Digital Payment Market By Industry, 2020 – 2030 (B)
Fig 173: Digital Payment – Vendor Growth-Innovation Matrix
Fig 174: Alibaba Group Holding Ltd: Company Overview
Fig 175: Alibaba Group Holding Ltd: Financial Performance
Fig 176: American Express Co: Company Overview
Fig 177: American Express Co: Financial Performance
Fig 178: Apple Inc: Company Overview
Fig 179: Apple Inc: Financial Performance
Fig 180: Google LLC: Company Overview
Fig 181: Google LLC: Financial Performance
Fig 182: Mastercard Inc: Company Overview
Fig 183: Mastercard Inc: Financial Performance
Fig 184: PayPal Holdings Inc: Company Overview
Fig 185: PayPal Holdings Inc: Financial Performance
Fig 186: Visa Inc: Company Overview
Fig 187: Visa Inc: Financial Performance
Fig 188: Discover Financial Services: Company Overview
Fig 189: Discover Financial Services: Financial Performance
Fig 190: ACI Worldwide Inc: Company Overview
Fig 191: ACI Worldwide Inc: Financial Performance
Fig 192: Amazon.com Inc: Company Overview
Fig 193: Amazon.com Inc: Financial Performance
Fig 194: Fiserv Inc: Company Overview
Fig 195: Fiserv Inc: Financial Performance
Fig 196: One97 Communications Ltd.: Company Overview
Fig 197: One97 Communications Ltd.: Financial Performance
Fig 198: Samsung Electronics Co Ltd: Company Overview
Fig 199: Samsung Electronics Co Ltd: Financial Performance
Fig 200: Fidelity National Information Services Inc: Company Overview
Fig 201: Fidelity National Information Services Inc: Financial Performance
Fig 202: The Western Union Co: Company Overview
Fig 203: The Western Union Co: Financial Performance
Fig 204: Core Objectives of the Market Study
Fig 205: Research Approach
Fig 206: Analysis Flow
Fig 207: Quality Control Flow