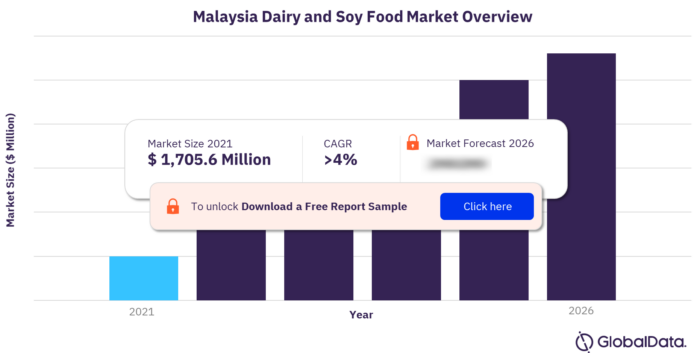
Malaysia Dairy and Soy Food Market Overview
The Malaysia dairy & soy food market was valued at $1,705.6 million in 2021 and is expected to grow at a CAGR of more than 4% during the forecast period.
The Malaysia dairy & soy food market research report provides a comparative analysis of Malaysian value and volume shares in the Asia-Pacific and global dairy & soy food sector. It offers an overview of the growth at a sector level and analyzes the various categories and distribution channels. Additionally, the report analyzes leading companies in the Malaysia dairy & soy food sector in 2021.
For more insights on market overview, download a free report sample
Top Cities of Malaysia Dairy and Soy Food Market
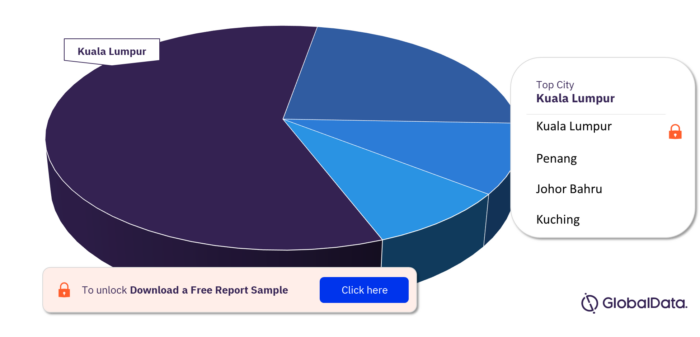
The top cities in the Malaysia dairy & soy sector are Kuala Lumpur, Penang, Johor Bahru and Kuching. Kuala Lumpur emerged as the largest dairy & soy market in Malaysia, followed by Penang, Johor Bahru and Kuching.
Malaysia Dairy and Soy Food Market, by City Analysis
For more insights on city analysis, download a free report sample
Key Categories of Malaysia Dairy and Soy Food Market
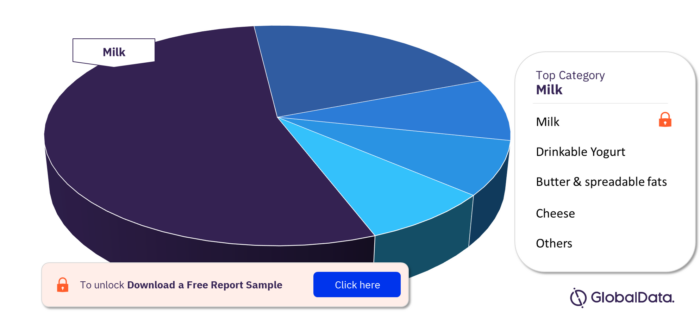
The Malaysia dairy & soy food market’s key categories are butter & spreadable fats, cheese, cream, dairy-based & soy-based desserts, drinkable yogurt, grain, nut, rice, seed milk alternatives, milk, soymilk & soy drinks and yogurt. Milk was the largest category, followed by drinkable yogurt and butter & spreadable fats. However, the grain, nut, rice, seed milk alternatives category is forecast to be the fastest growing category during the forecast period.
Malaysia Dairy and Soy Food Market, by Categories
For more insights on categories, download a free report sample
Key Distribution Channels of Malaysia Dairy and Soy Food Market
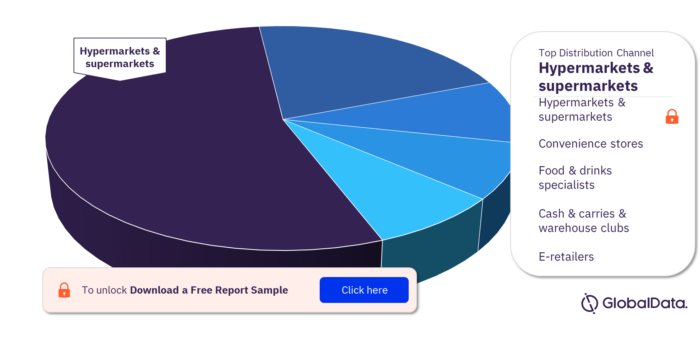
The key distribution channels in Malaysia dairy and soy food market are hypermarkets & supermarkets, convenience stores, food & drinks specialists, cash & carries & warehouse clubs and E-retailers. Hypermarkets & Supermarkets was the largest distribution channel in the Malaysia dairy & soy food sector.
Malaysia Dairy and Soy Food Market, by Distribution Channel
For more insights on distribution channel, download a free report sample
Packaging Analysis of Malaysia Dairy and Soy Food Market
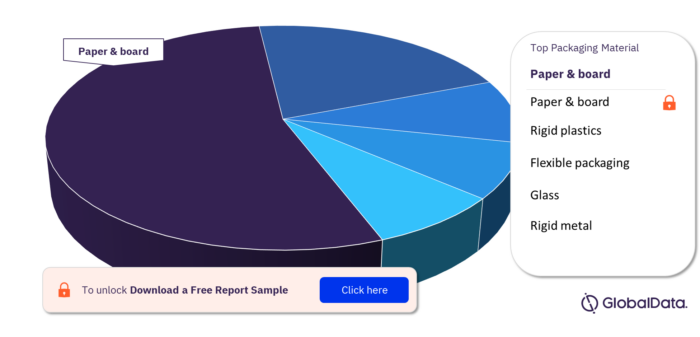
The key packaging materials in the Malaysia dairy & soy food sector are paper & board, rigid plastics, rigid metal, flexible packaging, and glass. Paper & board was the most used pack material in the Malaysia dairy & soy food sector, followed by rigid plastics and rigid metal.
Malaysia Dairy and Soy Food Market, by Packaging Material
For more insights on packaging material, download a free report sample
Key Companies of Malaysia Dairy and Soy Food Market
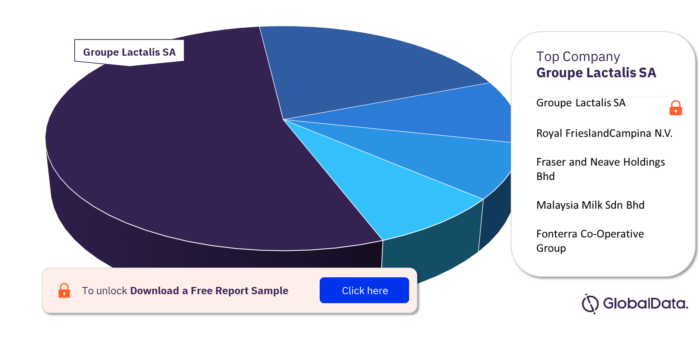
Some of the key companies in the Malaysia dairy and soy food market are Groupe Lactalis SA, Royal FrieslandCampina N.V., Fraser and Neave Holdings Bhd, Malaysia Milk Sdn Bhd and Fonterra Co-Operative Group.
Malaysia Dairy and Soy Food Market, by Key Companies
For more insights on key companies, download a free report sample
Malaysia Dairy and Soy Food Market - Overview
| Market Value (2021) | $1,705.6 million |
| CAGR (2021-2026) | >4% |
| Key Cities | Kuala Lumpur, Penang, Johor Bahru and Kuching |
| Key Categories | Butter & Spreadable Fats, Cheese, Cream, Dairy-Based & Soy-Based Desserts, Drinkable Yogurt, Grain, Nut, Rice, Seed Milk Alternatives, Milk, Soymilk & Soy Drinks and Yogurt |
| Key Distribution Channel | Hypermarkets & Supermarkets, Convenience Stores, Food & Drinks Specialists, Cash & Carries & Warehouse Clubs and E-Retailers |
| Key Packaging Material | Paper & Board, Rigid Plastics, Rigid Metal, Flexible Packaging, and Glass |
| Key Companies | Groupe Lactalis SA, Royal FrieslandCampina N.V., Fraser and Neave Holdings Bhd, Malaysia Milk Sdn Bhd and Fonterra Co-Operative Group |
Scope
- Per capita consumption and per capita expenditure of dairy and soy food were higher in Malaysia than both the global and regional levels in 2021
- The per capita consumption of milk was higher than other dairy and soy food categories in 2021
- Hypermarkets and supermarkets were the leading distribution channel in the Malaysian dairy and soy food sector
- Private label products are growing at a higher CAGR than branded products in the Malaysian dairy and soy food sector
- Milk, was the most consumed category across leading cities in Malaysia
- “Kids and babies” represent the largest subset of the dairy and soy food sector in Malaysia
Reasons to buy
- Identify high potential categories and explore further market opportunities based on detailed value and volume analysis
- Existing and new players can analyze key distribution channels to identify and evaluate trends and opportunities
- Gain an understanding of the total competitive landscape based on detailed company share analysis to plan effective market positioning
- Our team of analysts have placed a significant emphasis on changes expected in the market that will provide a clear picture of the opportunities that can be tapped over the next five years, resulting in revenue expansion
- The packaging analysis report helps manufacturers, in identifying the most commonly used packaging materials in the sector
- Analysis on key macro-economic indicators such as real GDP, nominal GDP, consumer price index, household consumption expenditure, population (by age group, gender, rural-urban split, and employed people and unemployment rate. It also includes economic summary of the country along with labor market and demographic trends.
Key Stakeholders
Table of Contents
Tables
List of Tables
Leading value categories
Fastest-growing segments (value), 2021
Cross-category comparison -by value (2016-2026)
Cross-category comparison -by volume (2016-2026)
Per capita consumption (by category), Malaysia compared to Asia-Pacific and global levels (in kg), 2021
Segment-level analysis (in value terms) -butter & spreadable fats
Segment-level analysis (in volume terms) -butter & spreadable fats
Segment-level analysis (in value terms) -cheese
Segment-level analysis (in volume terms) -cheese
Segment-level analysis (in value terms) -cream
Segment-level analysis (in volume terms) -cream
Segment-level analysis (in value terms) -dairy-based & soy-based desserts
Segment-level analysis (in volume terms) -dairy-based & soy-based desserts
Segment-level analysis (in value terms) -drinkable yogurt
Segment-level analysis (in volume terms) -drinkable yogurt
Segment-level analysis (in value terms) -grain, nut, rice, seed milk alternatives
Segment-level analysis (in volume terms) -grain, nut, rice, seed milk alternatives
Segment-level analysis (in value terms) -milk
Segment-level analysis (in volume terms) -milk
Segment-level analysis (in value terms) -soymilk & soy drinks
Segment-level analysis (in volume terms) -soymilk & soy drinks
Change in distribution share, 2016-2021
Top five companies share by brand (in value and volume terms) in the dairy & soy food sector, 2021
Brand shares of top five companies (in value and volume terms) by category, 2021
Category comparison -with H&W claims and non-h&w claims, 2016-2021
Volume share analysis of four cities by category* (%), 2020
Performance overview (score: 1-100)
Category data, by segment
Per Capita Consumption and Per Capita Expenditure
Dairy & soy food sales distribution in Malaysia -by category (MYR million), 2021
Brand share (in value and volume terms) in the dairy & soy food sector, 2021
Brand share (in value and volume terms) in the dairy & soy food sector, by category, 2021
Key health & wellness product attributes driving sales in Malaysia, 2016-2026
Key health & wellness consumer benefits driving sales in Malaysia, 2016-2026
Pack material (in million pack units), 2016-2026
Pack materials by category (in million pack units), 2021
Pack type (in million pack units), 2016-2026
Pack types by category (in million pack units), 2021
Closure type (in million pack units), 2016-2026
Closure types by category (in million pack units), 2021
Primary outer type (in million pack units), 2016-2026
Primary outer types by category (in million pack units), 2021
Real GDP and annual growth (%), 2018-2026
Nominal GDP and annual growth (%), 2018-2026
Consumer price inflation (%), 2018-2026
Employed people and unemployment rate (%), 2018-2026
Nominal household final consumption expenditure and annual growth (%), 2018-2026
Population and annual growth (%), 2018-2026
Population by age group (%)
Population by gender (%)
Population by rural-urban split (%)
Exchange rates, 2016-2026
Graphs
List of Figures
Value and volume share of Malaysia in the global and Asia-Pacific dairy & soy food sector, 2021-2026
Malaysia compared to the other top countries in terms of market share, growth, and competitive landscape
PCC comparison -Malaysia, Asia-Pacific, and global, 2016-2026
PCE comparison -Malaysia, Asia-Pacific, and global, 2016-2026
Market size and growth analysis by value and volume, dairy & soy food sector, 2016-2026
Cross-category comparison -value growth analysis and category winners and losers
Cross-category comparison -volume growth analysis and category winners and losers
Market size and growth analysis by value and volume, butter &spreadable fats category, 2016-2026
Market size and growth analysis by value and volume, cheese category, 2016-2026
Market size and growth analysis by value and volume, cream category, 2016-2026
Market size and growth analysis by value and volume, dairy-based & soy-based desserts category, 2016-2026
Market size and growth analysis by value and volume, drinkable yogurt category, 2016-2026
Market size and growth analysis by value and volume, grain, nut, rice, seed milk alternatives category, 2016-2026
Market size and growth analysis by value and volume, milk category, 2016-2026
Market size and growth analysis by value and volume, soymilk & soy drinks category, 2016-2026
Market size and growth analysis by value and volume, yogurt category, 2016-2026
Share of key distribution channels (in value terms)-dairy & soy food, 2021
Key distribution channel share by category (in value terms), 2021
Leading companies (in value and volume terms) in the dairy & soy food sector, 2021
Category-wise consolidation/fragmentation(in value terms) -dairy & soy food , 2021
Prominence of health & wellness claims by category, $ million, 2016-2021
Contribution of health & wellness by product attributes, $ million, 2016-2021
Contribution of health & wellness by consumer benefits, $ million, 2016-2021
Key pack materials in the Malaysian dairy & soy food sector by percentage share of pack units, 2021
Annual growth rate by key pack material, 2016-2026
Use of pack material by category (in pack units), 2021
Key pack types in the Malaysian dairy & soy food sector by percentage share of pack units, 2021
Annual growth rate by key pack type, 2016-2026
Use of pack type by category (in pack units), 2021
Key closure types in the Malaysian dairy & soy food sector by percentage share of pack units, 2021
Annual growth rate by key closure type, 2016-2026
Use of closure type by category (in pack units), 2021
Key primary outer types in the Malaysian dairy & soy food sector by percentage share of pack units, 2021
Annual growth rate by key primary outer type, 2016-2026
Use of primary outer type by category (in pack units), 2021
Volume share analysis of top four cities (%), 2016-20*
Demographic analysis
Real GDP (MYR billion) and annual growth (%)
Nominal GDP (MYR billion) and annual growth (%)
Consumer price inflation (%)
Nominal household final consumption expenditure growth (%) in MYR terms
Population (million) and annual growth (%)
Population by age group (%)
Population by gender (%)
Population by rural-urban split (%)
Employed people (million) and unemployment rate (%)
Economic summary, labor market trends, and demographic trends
Five lowest-risk nations in GCRI Q4 2021
Five highest-risk nations in GCRI Q4 2021
Malaysia’s performance in country risk analysis in comparison to Asia-Pacific and the world
List of 109 countries analyzed to identify the high-potential countries in different regions