
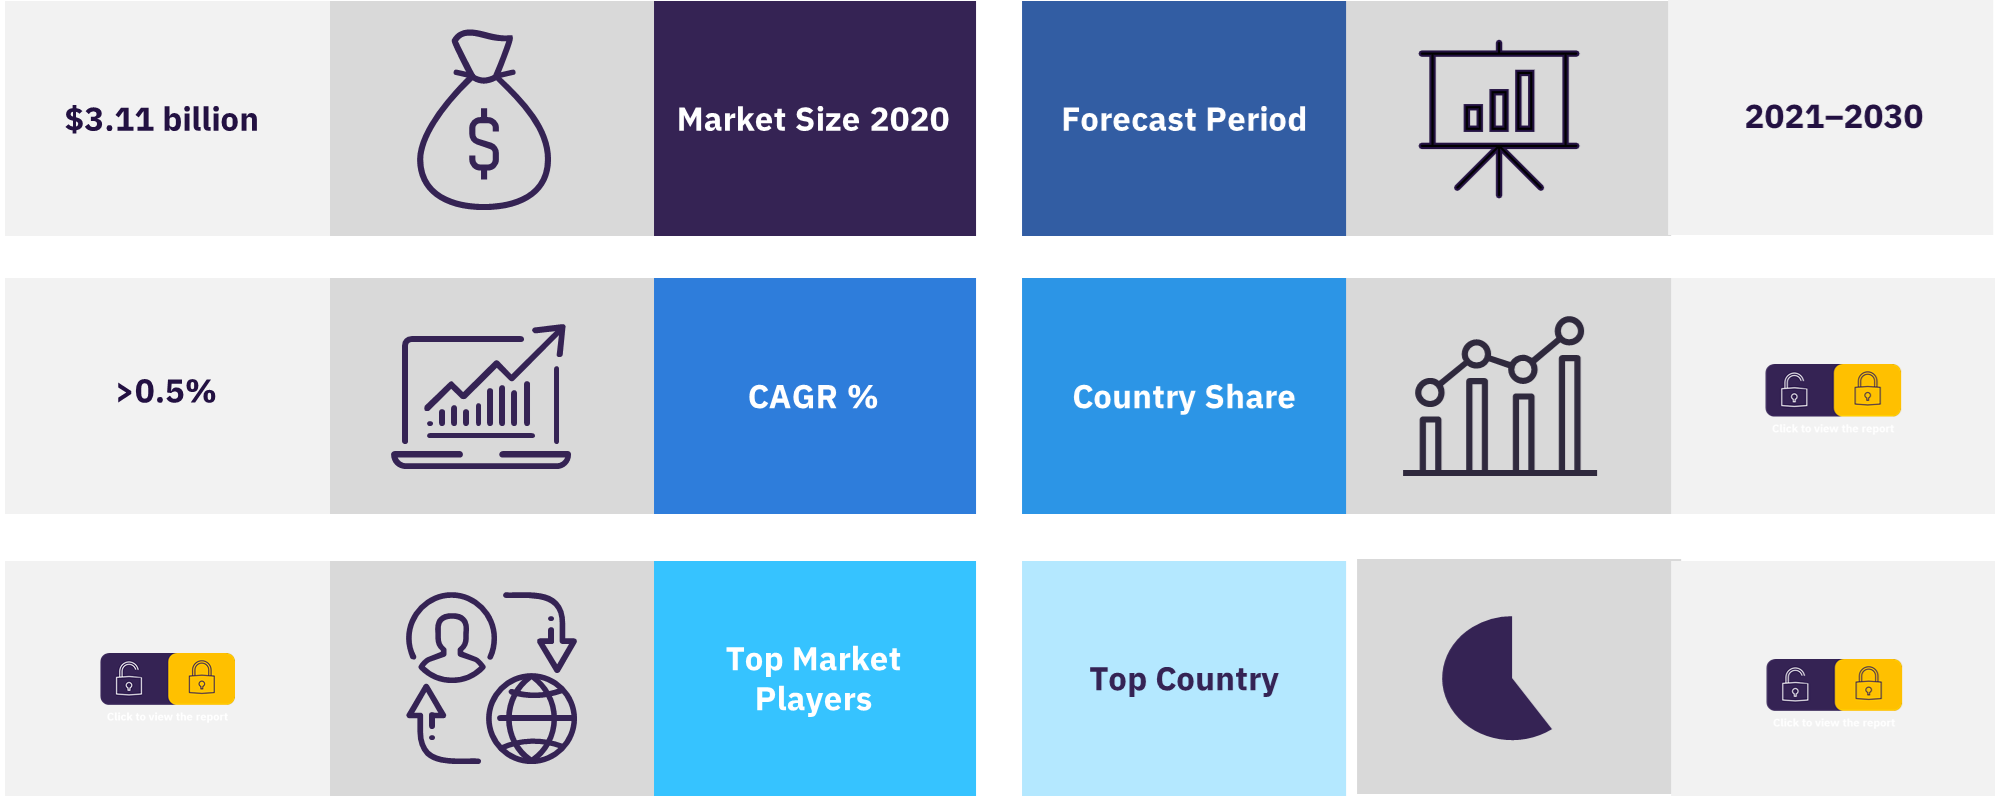
The global neuroendocrine tumors drug market was valued at $3.11 billion in 2020 and is projected to grow at a CAGR of more than 0.5% during the forecast period 2021-2030. The introduction of five new pipeline agents and label expansions or entry into new markets for currently approved agents are key drivers of this market growth. However, the market will largely stagnate during the forecast period due to patent expiries impacting most of the standard of care. The US was the leading market in 2020, claiming more than 60% of global sales followed by China and France.
Global neuroendocrine tumors drug market overview
For more insights on this report, download a free report sample
What are the market dynamics in the global neuroendocrine tumors (NETs) drug market?
Despite NETs being considered rare malignancies, there has been a consistent industrial interest and therefore investment in the field. The blockbuster combined sales of SSAs suggest that an agent which offers a meaningful improvement in patient outcomes can certainly lead to highly satisfactory commercial success. By 2021, the R&D focus on NETs has expanded to include numerous targeted therapies, PRRT, and other novel ways to improve the current mechanisms of action (MOAs) targeting somatostatin receptors (SSTRs). There has been a shift from researching me-too drugs to researching compounds with the same MOA offering key improvements over currently marketed products, which are expected to be better in one or more attributes.
Due to the heterogeneity of the disease, there are distinct patient populations with different unmet needs, in which any new agent or modality could potentially carve its own space. For instance, PRRT has already been very successful, but if a new way to target the SSTR upon progression with PRRT emerges, that would capture the majority of the third/fourth line sales in this indication. There has been a shift from researching me-too drugs to researching compounds with the same mechanism of action as other marketed products but which are expected to be better in one or more attributes.
The treatment of neuroendocrine tumors is associated with a medium level of unmet need, medium because there is not a definitive curative therapy for advanced disease, while at the same time most patients present with slow-growing disease and do have a number of drug options available that can extend survival over multiple lines of therapy. From January 2011 to December 2020, deal-making in the NET space has not followed any specific patterns. Mergers & acquisitions, as well as strategic alliances, were well represented, albeit not as common or frequent as seen in other cancer indications. Agreements to exercise co-marketing rights for individual drugs are notably absent from the NET landscape.
Which are the major players in the global neuroendocrine tumors (NETs) drug market?
The current major players in the neuroendocrine tumor space are Novartis, Ipsen, Hutchmed, and Pfizer, and current players with a smaller market share are Merck & Co, Roche, and Lantheus Holdings. The market leader by a significant margin is Novartis, with a drug portfolio that spans every patient population in NETs and controls approximately 51% of the NET market, according to GlobalData’s estimates.
Global neuroendocrine tumors drug market, by key players
To know more about key players, download a free report sample
Market report scope
| Global Market (8MM) 2020 | $3.11 billion |
| Growth Rate | CAGR of <1% (2030) |
| Key Players | Blueprint Medicines, Bristol Myers Squibb, Camurus AB, Exelixis Inc, Hutchmed, Ipsen Pharma, ITM Isotopen Technologien Munchen, Merck & Co, Novartis, Pfizer, Progenics Pharmaceuticals, Roche, and Shanghai Junshi Bioscience |
This report provides a comprehensive analysis of Neuroendocrine Tumors (NETs) – Global Drug
- Tumors including epidemiology, pathophysiology, symptoms, diagnosis, and treatment guidelines.
- Topline Neuroendocrine Tumors market revenue, the annual cost of therapy, and major pipeline product sales in the forecast period.
- Key topics covered include current treatment and pipeline therapies, unmet needs and opportunities, and the drivers and barriers affecting Neuroendocrine Tumor therapeutics sales in the 8MM.
- Pipeline analysis: Comprehensive data split across different phases, emerging novel trends under development, and detailed analysis of late-stage pipeline drugs (Phase II – III).
- Analysis of the current and future market competition in the global Neuroendocrine Tumor therapeutics market. Insightful review of the key industry drivers and challenges. Each trend is independently researched to provide a qualitative analysis of its implications.
Reasons to buy
- Develop and design your in-licensing and out-licensing strategies, using a detailed overview of current pipeline products and technologies to identify companies with the most robust pipelines.
- Develop business strategies by understanding the trends shaping and driving the global Neuroendocrine Tumor therapeutics market.
- Drive revenues by understanding the key trends, innovative products and technologies, market segments, and companies likely to impact the global Neuroendocrine Tumor market in the future.
- Formulate effective sales and marketing strategies by understanding the competitive landscape and by analyzing the performance of various competitors.
- Identify emerging players with potentially strong product portfolios and create effective counter-strategies to gain a competitive advantage.
- Track drug sales in the global Neuroendocrine Tumor therapeutics market from 2020-2030.
- Organize your sales and marketing efforts by identifying the market categories and segments that present maximum opportunities for consolidations, investments, and strategic partnerships.
Key Stakeholders
Table of Contents
Tables
Table 1: Neuroendocrine tumors: Key Metrics in the 8MM
Table 2: Grade and Proliferation Segmentation in Neuroendocrine Tumors
Table 3: Risk Factors and Comorbidities for NETs
Table 4: Treatment Guidelines for NETs
Table 5: Top 10 Deals by Value, 2011-2020
Table 6: NET Market – Global Drivers and Barriers, 2020-2030
Table 7: Key Events Impacting Sales for NETs in the US, 2020-2030
Table 8: NET Market – Drivers and Barriers in the US, 2020-2030
Table 9: Key Events Impacting Sales for NETs in the 5EU, 2020-2030
Table 10: NET Market – Drivers and Barriers in the 5EU, 2020-2030
Table 11: Key Events Impacting Sales for NETs in Japan, 2020-2030
Table 12: NET Market – Drivers and Barriers in Japan, 2020-2030
Table 13: Key Events Impacting Sales for NETs in China, 2020-2030
Table 14: NET Market – Drivers and Barriers in China, 2020-2030
Table 15: High-Prescribing Physicians (non-KOLs) Surveyed, By Country
Graphs
Figure 1: Global Sales Forecast by Country for NETs in 2020 and 2030
Figure 2: Analysis of the Company Portfolio Gap in NETs During the Forecast Period
Figure 3: Competitive Assessment of the Late-Stage Pipeline Agents that GlobalData Expects to Be Licensed for the Treatment of NETs During the Forecast Period
Figure 4: Key Therapeutic Targets in Neuroendocrine Tumors
Figure 5: 8MM, Diagnosed Incidence of NETs, Men, Cases per 100,000 Population, All Ages, 2010 and 2020
Figure 6: 8MM, Diagnosed Incidence of NETs, Women, Cases per 100,000 Population, All Ages, 2010 and 2020
Figure 7: 8MM, Sources Used and Not Used to Forecast the Diagnosed Incident Cases of NETs
Figure 8: 8MM, Sources Used to Forecast the Diagnosed Incident Cases of NETs by Type
Figure 9: 8MM, Sources Used to Forecast the Diagnosed Incident Cases of NETs by Stage at Diagnosis, by Type
Figure 10: 8MM, Sources Used to Forecast the Diagnosed Incident Cases of NETs by Grade and Differentiation, by Type
Figure 11: 8MM, Sources Used to Forecast the Five-Year Diagnosed Prevalent Cases of NETs
Figure 12: 8MM, Diagnosed Incident Cases of NETs, N, Both Sexes, All Ages, 2020
Figure 13: 8MM, Diagnosed Incident Cases of NETs by Age, N, Both Sexes, 2020
Figure 14: 8MM, Diagnosed Incident Cases of NETs by Sex, N, All Ages, 2020
Figure 15: 8MM, Diagnosed Incident Cases of NETs by Type, N, Both Sexes, 2020
Figure 16: 8MM, Diagnosed Incident Cases of NETs by Type and Stage at Diagnosis, N, Both Sexes, All Ages, 2020
Figure 17: 8MM, Diagnosed Incident Cases of NETs by Grade and Differentiation, N, Both Sexes, All Ages, 2020
Figure 18: 8MM, Five-Year Diagnosed Prevalent Cases of NETs, N, Both Sexes, All Ages, 2020
Figure 19: Treatment Algorithm for NETs
Figure 20: Unmet Needs and Opportunities in Neuroendocrine Tumors
Figure 21: Overview of the Development Pipeline in NETs
Figure 22: Key Late-Stage Trials for the Promising Pipeline Agents that GlobalData Expects to Be Licensed for NETs in the 8MM During the Forecast Period
Figure 23: Competitive Assessment of the Marketed and Pipeline Drugs Benchmarked Against Afinitor and Lutathera
Figure 24: Analysis of the Company Portfolio Gap in NETs During the Forecast Period
Figure 25: Global (8MM) Sales Forecast by Country for NETs in 2020 and 2030
Figure 26: Sales Forecast by Class for NETs in the US in 2020 and 2030
Figure 27: Sales Forecast by Class for NETs in the 5EU in 2020 and 2030
Figure 28: Sales Forecast by Class for NETs in Japan in 2020 and 2030
Figure 29: Sales Forecast by Class for Neuroendocrine tumors in China in 2020 and 2030