United States (US) Construction Market Size, Trend Analysis by Sector, Competitive Landscape and Forecast to 2027

Pages: 95 Published: June 30, 2023 Report Code: GDCN1184MR

United States (US) Construction Market Report Overview

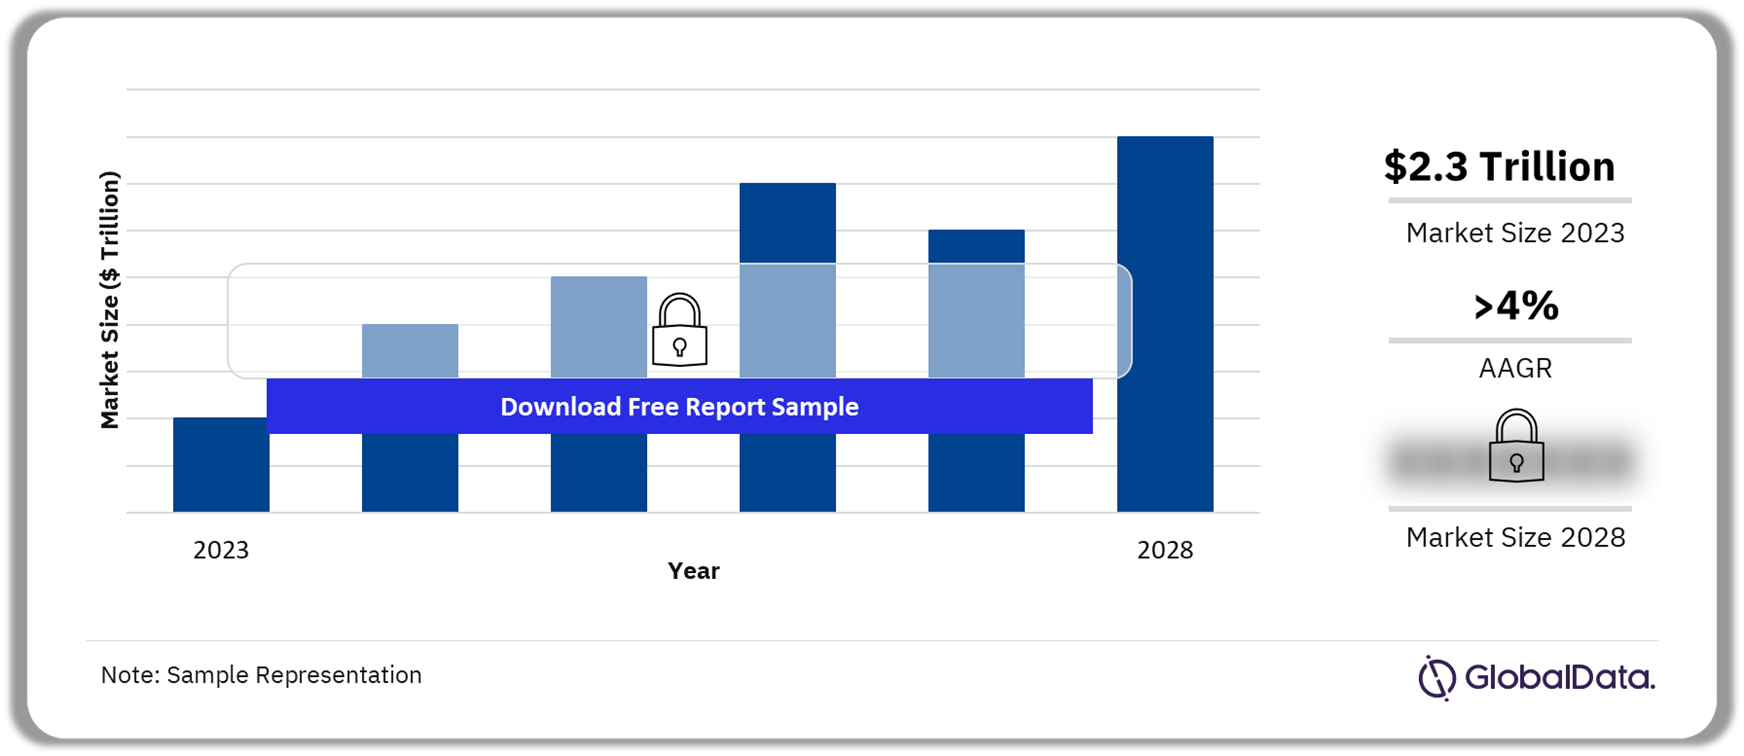
The United States (US) construction market size was valued at $2.1 billion in 2022 and is expected to achieve an AAGR of more than 4% during 2024-2027. The industry’s growth in the US during the forecast period will be fuelled by investment in the energy, transportation, housing, and manufacturing sectors.

US Construction Market Outlook, 2022-2027 ($ Billion)

US Construction Market Outlook, 2022-2027 ($ Billion)

To gain more information on the US construction market forecast, download a free report sample

The US construction market research report provides a detailed analysis of the US construction industry’s growth prospects by market, project type, and construction activity. It also provides critical insights into the impact of industry trends and issues as well as an analysis of key risks and opportunities in the construction industry. Moreover, it provides an analysis of the mega-project pipeline, focusing on development stages and participants, in addition to listings of major projects in the pipeline.

Market Size (2022) $2.1 billion
AAGR (2024 – 2027) >4%
Forecast Period 2023-2027
Historical Period 2018-2022
Key Sectors Commercial Construction, Industrial Construction, Infrastructure Construction, Energy & Utilities Construction, Institutional Construction, and Residential Construction
Leading Contractors Actividades de Construccion y Servicios SA, Tutor Perini Corp, Bechtel Corp, Skanska AB, Parsons Corp, Ferrovial SA, Kiewit Corp, AECOM, The Walsh Group, and Suffolk Construction Company Inc
Leading Consultants AECOM, Jacobs Engineering Group Inc., WSP Global Inc, STV Group Inc, Arup Group Ltd, M. Arthur Gensler Jr. & Associates Inc, Dar Al-Handasah Consultants Shair and Partners Holdings Ltd, Mott MacDonald Group Ltd, Foster + Partners Ltd, and Kimley-Horn and Associates Inc
Enquire & Decide Discover the perfect solution for your business needs. Enquire now and let us help you make an informed decision before making a purchase.

US Construction Market Segmentation by Sectors

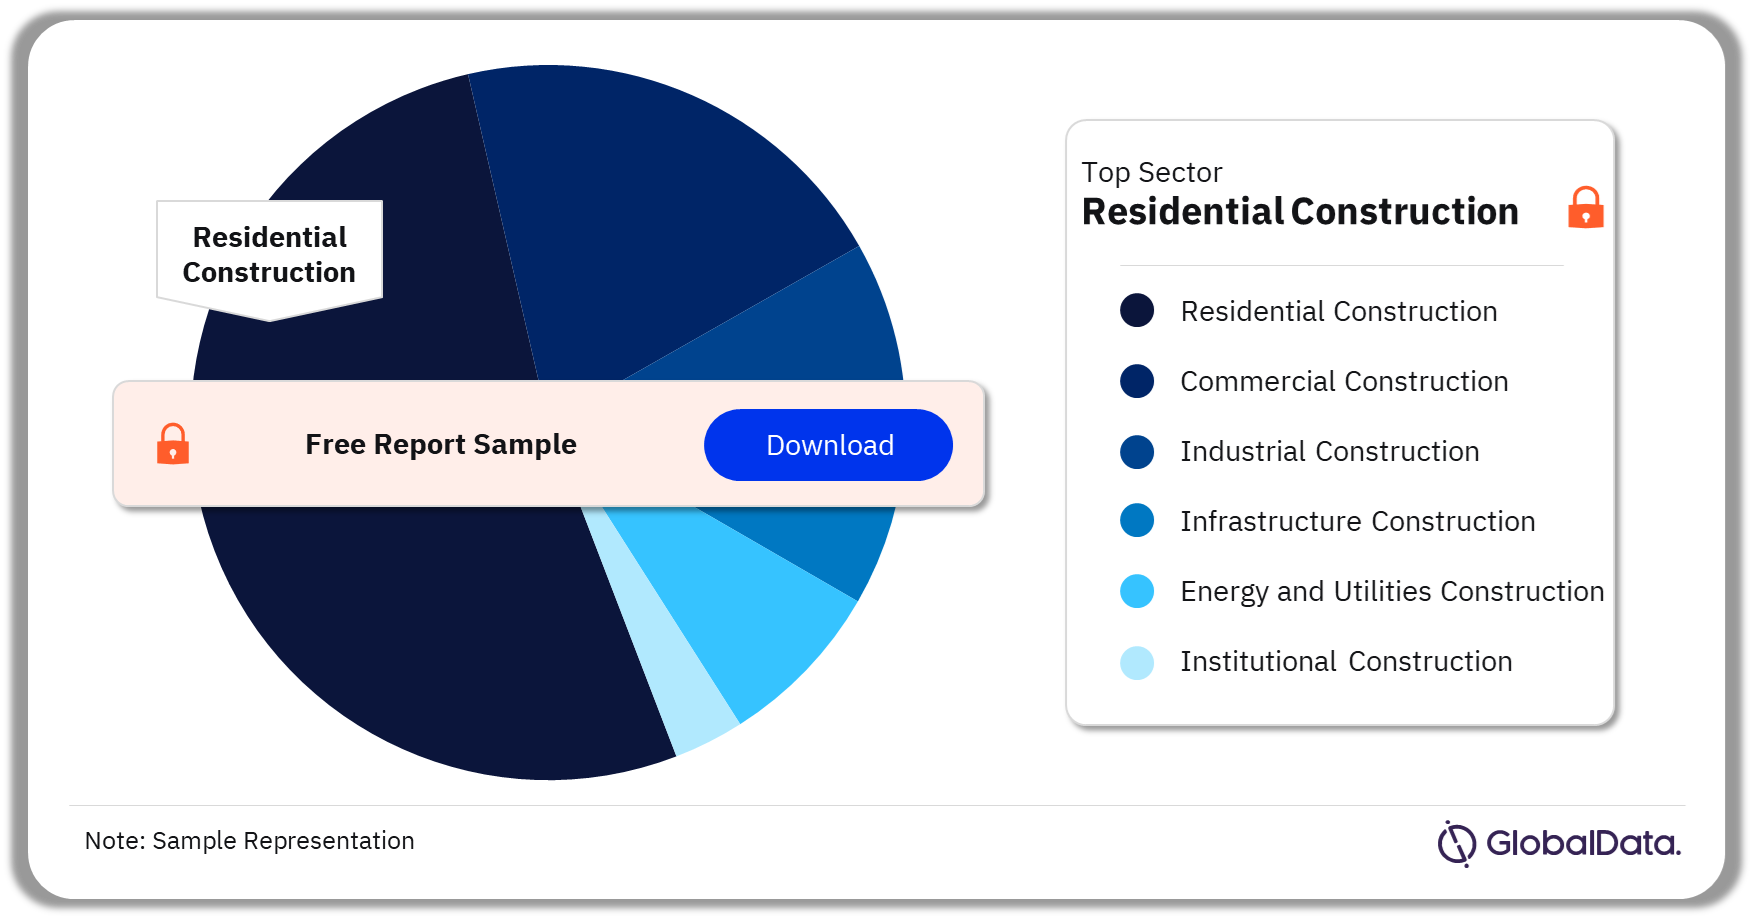
The key sectors in the US construction market are commercial construction, industrial construction, infrastructure construction, energy & utilities construction, institutional construction, and residential construction. The residential construction sector led the US construction market in 2022.

Residential Construction: The project types in this sector include single-family housing and multi-family housing. The residential construction sector’s output over the forecast period will be supported by the government’s investments in building affordable housing units in addressing the current housing deficit of more than six million homes.

Commercial Construction: The project types in this sector include leisure and hospitality buildings, office buildings, outdoor leisure facilities, retail buildings, and other commercial construction. The sector’s output will be aided in the medium to long term by a diverse increase in projects and investments in the retail building, transportation and storage, and data centre markets.

Energy & Utilities Construction: The project types in this sector include electricity and power, oil and gas, telecommunications, sewage infrastructure, and water infrastructure. The forecast-period growth in the energy and utilities sector will grow as investments increase in renewable energy and oil and gas projects.

Institutional Construction: The project types in this sector include educational buildings, healthcare buildings, institutional buildings, research facilities, and religious buildings. The institutional construction sector’s growth during the forecast period will be supported by public and private sector investment in healthcare and educational building projects.

Infrastructure Construction: The project types in this sector include rail infrastructure, road infrastructure, and other infrastructure projects. The infrastructure sector’s output over the forecast period will be aided by the government’s various infrastructure programmes to improve transportation networks, in addition to projects under the $1.2 trillion IIJA scheme.

Industrial Construction: The project types in this sector include chemical and pharmaceutical plants, manufacturing plants, metal and material production and processing plants, and waste processing plants. Increasing industrial investments and steady progress in project execution is expected to stimulate industrial construction sector output in 2023. The CHIPS and Science Act and the IRA will continue to support the expansion in investment and output in the forecast period.

US Construction Market Analysis by Sectors, 2022 (%)

US Construction Market Analysis by Sectors, 2022 (%)

For more sector insights into the US construction market, download a free report sample

US Construction Market - Competitive Landscape

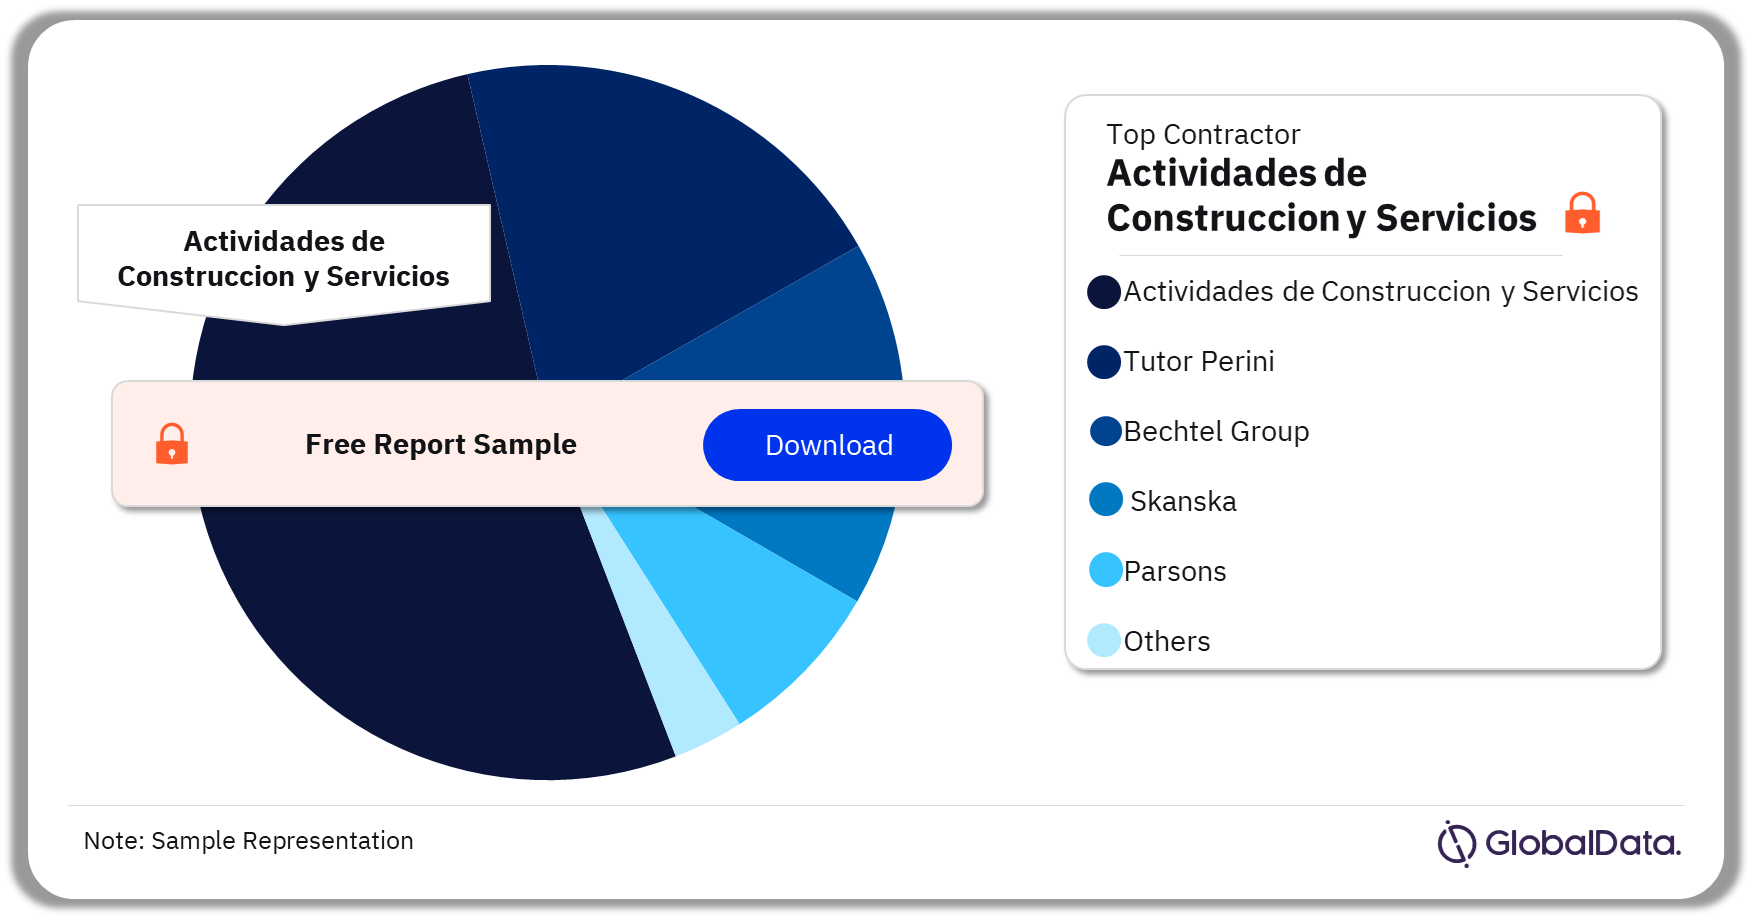
Leading Contractors: Some of the leading contractors in the US construction market are Actividades de Construccion y Servicios SA, Tutor Perini Corp, Bechtel Corp, Skanska AB, Parsons Corp, Ferrovial SA, Zachry Construction Corp, Kiewit Corp, AECOM, and The Walsh Group. Actividades de Construccion y Servicios SA has the highest project value in the US construction market.

US Construction Market Analysis by Contractors (%)

US Construction Market Analysis by Contractors (%)

To know more about the leading contractors in the US construction market, download a free report sample

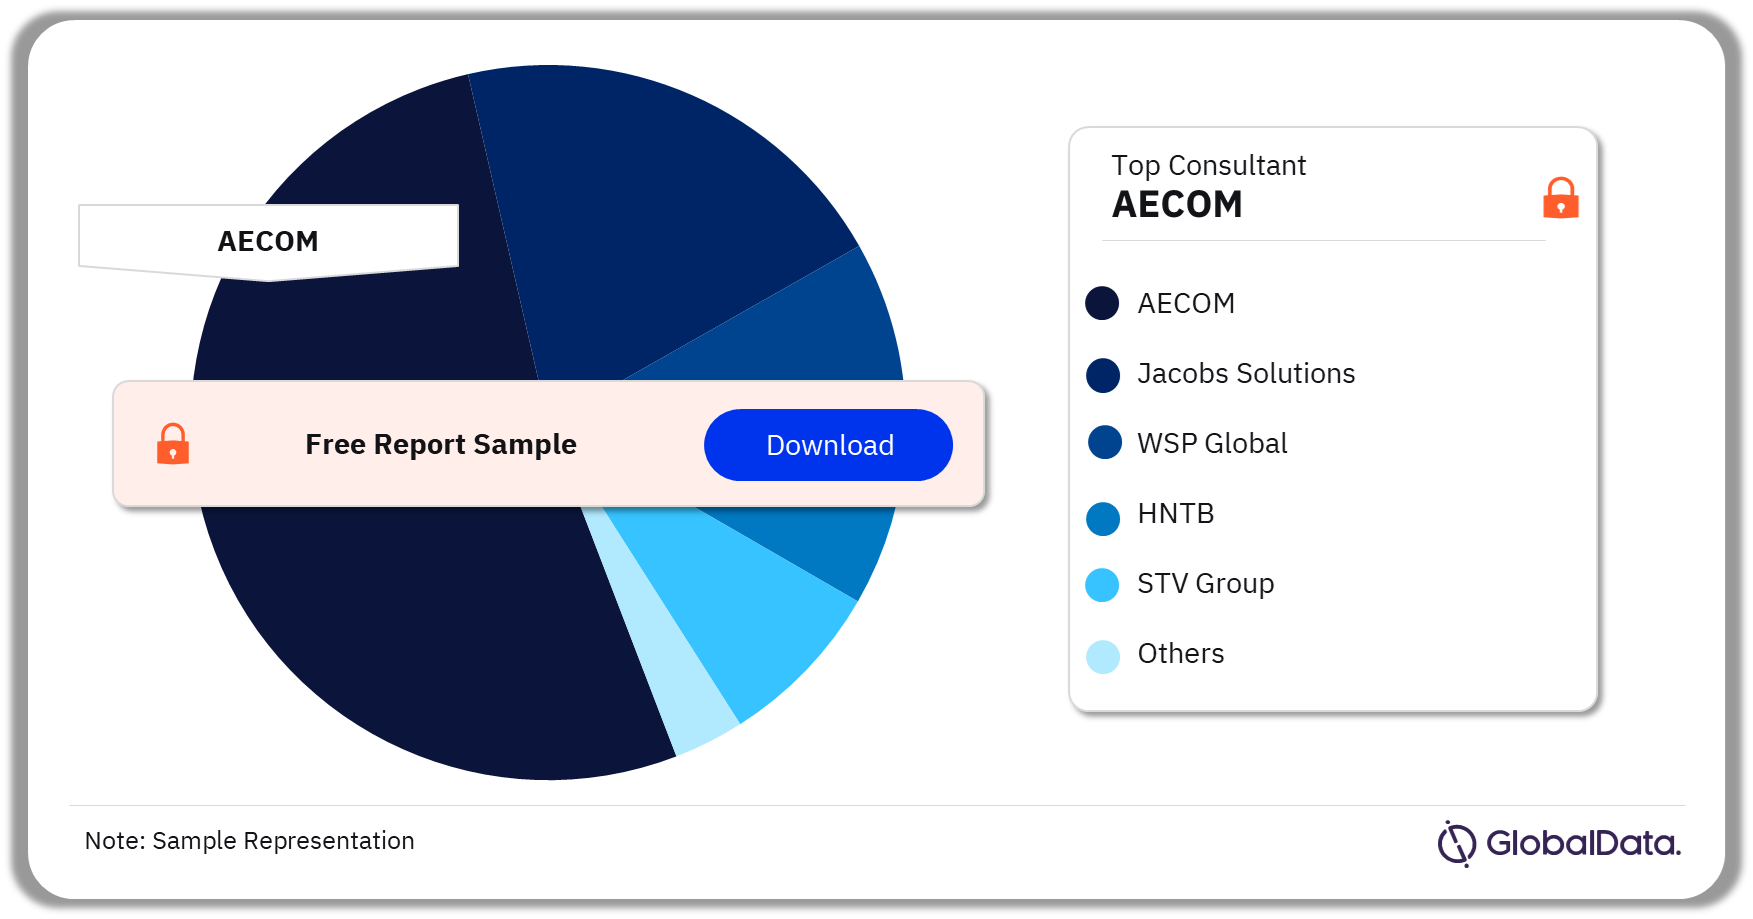
Leading Consultants: Some of the leading consultants in the US construction market are AECOM, Jacobs Engineering Group Inc., WSP Global Inc, STV Group Inc, Arup Group Ltd, M. Arthur Gensler Jr. & Associates Inc, Dar Al-Handasah Consultants Shair and Partners Holdings Ltd, Mott MacDonald Group Ltd, Foster + Partners Ltd, and Kimley-Horn and Associates Inc. AECOM has the highest project value in the US construction market.

US Construction Market Analysis by Consultants (%)

US Construction Market Analysis by Consultants (%)

To know more about the leading consultants in the US construction market, download a free report sample

Segments Covered in the Report

US Construction Market Sectors Outlook (Value, $ Billion, 2018-2027)

  • Commercial Construction
    • Leisure and Hospitality Buildings
    • Office Buildings
    • Outdoor Leisure Facilities
    • Retail Buildings
    • Other Commercial Construction
  • Industrial Construction
    • Chemical and Pharmaceutical Plants
    • Manufacturing Plants
    • Metal and Material Production and Processing plants
    • Waste Processing Plants
  • Infrastructure Construction
    • Rail Infrastructure
    • Road Infrastructure
    • Other Infrastructure Projects
  • Energy and Utilities Construction
    • Electricity and Power
    • Oil and Gas
    • Telecommunications
    • Sewage Infrastructure
    • Water Infrastructure
  • Institutional Construction
    • Educational Buildings
    • Healthcare Buildings
    • Institutional Buildings
    • Research Facilities
    • Religious Buildings
  • Residential Construction
    • Single-Family Housing
    • Multi-Family Housing

Scope

Scope

This report provides a comprehensive analysis of the construction industry in US. It provides:

  • Historical and forecast valuations of the construction industry in US, featuring details of key growth drivers.
  • Segmentation by sector (commercial, industrial, infrastructure, energy & utilities, institutional and residential) and by sub-sector.
  • Analysis of the mega-project pipeline, including breakdowns by development stage across all sectors, and projected spending on projects in the existing pipeline.
  • Listings of major projects, in addition to details of leading contractors and consultants.

Reasons to Buy

  • Identify and evaluate market opportunities using GlobalData’s standardized valuation and forecasting methodologies.
  • Assess market growth potential at a micro-level with over 600 time-series data forecasts.
  • Understand the latest industry and market trends.
  • Formulate and validate strategy using GlobalData’s critical and actionable insight.
  • Assess business risks, including cost, regulatory and competitive pressures.
  • Evaluate competitive risk and success factors.

Table of Contents

  • 1. About GlobalData
  • 2. Executive Summary
  • 3. Construction Industry: At-a-Glance
  • 4. Context

    • 4.1. Economic Performance
    • 4.2. Political Environment and Policy
    • 4.3. Demographics
    • 4.4. Risk Profile

  • 5. Construction Outlook

    • 5.1. All Construction

      • 5.1.1. Outlook
      • 5.1.2. Latest news and developments
      • 5.1.3. Construction Projects Momentum Index

    • 5.2. Commercial Construction

      • 5.2.1. Outlook
      • 5.2.2. Project analytics
      • 5.2.3. Latest news and developments

    • 5.3. Industrial Construction

      • 5.3.1. Outlook
      • 5.3.2. Project analytics
      • 5.3.3. Latest news and developments

    • 5.4. Infrastructure Construction

      • 5.4.1. Outlook
      • 5.4.2. Project analytics
      • 5.4.3. Latest news and developments

    • 5.5. Energy and Utilities Construction

      • 5.5.1. Outlook
      • 5.5.2. Project analytics
      • 5.5.3. Latest news and developments

    • 5.6. Institutional Construction

      • 5.6.1. Outlook
      • 5.6.2. Project analytics
      • 5.6.3. Latest news and developments

    • 5.7. Residential Construction

      • 5.7.1. Outlook
      • 5.7.2. Project analytics
      • 5.7.3. Latest news and developments

  • 6. Key Industry Participants

    • 6.1. Contractors
    • 6.2. Consultants

  • 7. Construction Market Data
  • 8. Appendix

    • 8.1. What is this Report About?
    • 8.2. Definitions
    • 8.3. CRI Methodology
    • 8.4. GlobalData Construction

  • 9. Contact Us

List of Tables

Table 1: Construction Industry Key Data

Table 2: The US, Key Economic Indicators

Table 3: US States, Construction Value-Add (Real, % change YoY)

Table 4: US States, Construction Value-Add (Nominal, % change YoY)

Table 5: The US, Commercial Construction Output by Project Type (Real % Change), 2018-27

Table 6: The US, Top Commercial Construction Projects by Value

Table 7: The US, Industrial Construction Output by Project Type (Real % Change), 2018-27

Table 8: The US, Top Industrial Construction Projects by Value

Table 9: The US, Infrastructure Construction Output by Project Type (Real % Change), 2018-27

Table 10: The US, Top Infrastructure Construction Projects by Value

Table 11: The US, Energy and Utilities Construction Output by Project Type (Real % Change), 2018-27

Table 12: The US, Top Energy and Utilities Construction Projects by Value

Table 13: The US, Institutional Construction Output by Project Type (Real % Change), 2018-27

Table 14: The US, Top Institutional Construction Projects by Value

Table 15: The US, Residential Construction Output by Project Type (Real % Change), 2018-27

Table 16: The US, Top Residential Construction Projects by Value

Table 17: California, Construction Output by Sector (Nominal $ Billion), 2018-27

Table 18: California, Construction Output by Sector (Real, $ Billion, 2017 Prices), 2018-27

Table 19: California, Construction Value-Add by Main MSAs (Real, $ Million, 2012 Prices), 2018-27

Table 20: Florida, Construction Output by Sector (Nominal $ Billion), 2018-27

Table 21: Florida, Construction Output by Sector (Real, $ Billion, 2017 Prices), 2018-27

Table 22: Florida, Construction Value-Add by Main MSAs (Real, $ Million, 2012 Prices), 2018-27

Table 23: Texas, Construction Output by Sector (Nominal $ Billion), 2018-27

Table 24: Texas, Construction Output by Sector (Real, $ Billion, 2017 Prices), 2018-27

Table 25: Texas, Construction Value-Add by Main MSAs (Real, $ Million, 2012 Prices), 2018-27

Table 26: New York, Construction Output by Sector (Nominal $ Billion), 2018-27

Table 27: New York, Construction Output by Sector (Real, $ Billion, 2017 Prices), 2018-27

Table 28: New York, Construction Value-Add by Main MSAs (Real, $ Million, 2012 Prices), 2018-27

Table 29: Pennsylvania, Construction Output by Sector (Nominal $ Billion), 2018-27

Table 30: Pennsylvania, Construction Output by Sector (Real, $ Billion, 2017 Prices), 2018-27

Table 31: Pennsylvania, Construction Value-Add by Main MSAs (Real, $ Million, 2012 Prices), 2018-27

Table 32: Georgia, Construction Output by Sector (Nominal $ Billion), 2018-27

Table 33: Georgia, Construction Output by Sector (Real, $ Billion, 2017 Prices), 2018-27

Table 34: Georgia, Construction Value-Add by Main MSAs (Real, $ Million, 2012 Prices), 2018-27

Table 35: Illinois, Construction Output by Sector (Nominal $ Billion), 2018-27

Table 36: Illinois, Construction Output by Sector (Real, $ Billion, 2017 Prices), 2018-27

Table 37: Illinois, Construction Value-Add by Main MSAs (Real, $ Million, 2012 Prices), 2018-22

Table 38: Ohio, Construction Output by Sector (Nominal $ Billion), 2018-27

Table 39: Ohio, Construction Output by Sector (Real, $ Billion, 2017 Prices), 2018-27

Table 40: Ohio, Construction Value-Add by Main MSAs (Real, $ Million, 2012 Prices), 2018-22

Table 41: Washington, Construction Output by Sector (Nominal $ Billion), 2018-27

Table 42: Washington, Construction Output by Sector (Real, $ Billion, 2017 Prices), 2018-27

Table 43: Washington, Construction Value-Add by Main MSAs (Real, $ Million, 2012 Prices), 2018-22

Table 44: North Carolina, Construction Output by Sector (Nominal $ Billion), 2018-27

Table 45: North Carolina, Construction Output by Sector (Real, $ Billion, 2017 Prices), 2018-27

Table 46: North Carolina, Construction Value-Add by Main MSAs (Real, $ Million, 2012 Prices), 2018-22

Table 47: The US, Key Contractors

Table 48: The US, Key Consultants

Table 49: The US, Construction Output Value (Real, $ Billion)

Table 50: The US, Construction Output Value (Nominal, $ Billion)

Table 51: GlobalData Construction Market Definitions

Table 52: Risk Dimensions

Table 53: Ratings, Scores and Definitions

List of Figures

Figure 1: Latin America, Construction Output (Real % Change), 2021-27

Figure 2: The US, Construction Output by Sector (Real % Change), 2021-23 and 2024-27

Figure 3: The US, Risk Summary

Figure 4: The US, Risk Regional Comparison

Figure 5: The US, Construction Output Value (Real, $ Billion, 2017 Prices and Exchange Rate), 2018-27

Figure 6: The US, Construction Output Value, by Sector (Real, $ Million), 2018-27

Figure 7: The US, Value of Construction Put in Place ($ Billion, Nominal Seasonally Adjusted), Y-o-Y % Change

Figure 8: The US, Real Gross Output of the Construction Industry, in 2012 Chained Prices, In $ Billion, Seasonally Adjusted at Annual Rates

Figure 9: The US, Number of People Employed in the Construction Industry, In Thousands

Figure 10: The US, Construction Projects Momentum Index

Figure 11: Region, Construction Projects Momentum Index

Figure 12: The US, Commercial Construction Output by Project Type (Real, $ Million), 2018-27

Figure 13: The US, Commercial Construction Projects Pipeline, Value by Stage ($ Million)

Figure 14: The US, Value of Lodging, Office, and Commercial Construction Put in Place ($ Billion, Nominal), Y-o-Y % Change

Figure 15: The US, Total International Visitor Arrivals, In Thousands

Figure 16: The US, Total Retail Sales Value (In $ Billion, Seasonally Adjusted, in Nominal Terms)

Figure 17: The US, Industrial Construction Output by Project Type (Real, $ Million), 2018-27

Figure 18: The US, Industrial Construction Projects Pipeline, Value by Stage ($ Million)

Figure 19: The US, Total Manufacturing Construction Put in Place ($ Million, Nominal)

Figure 20: The US, Industrial and Manufacturing Production Indices (2017=100, Seasonally Adjusted)

Figure 21: The US, Total Exports ($ Billion, Seasonally Adjusted)

Figure 22: The US, Total Manufacturing New Order Value ($ Billion, Seasonally Adjusted)

Figure 23: The US, Infrastructure Construction Output by Project Type (Real, $ Million), 2018-27

Figure 24: The US, Infrastructure Construction Projects Pipeline, Value by Stage ($ Million)

Figure 25: The US, Total Transportation Construction Put in Place ($ Million, Nominal), YoY % Change

Figure 26: The US, Energy and Utilities Construction Output by Project Type (Real, $ Million), 2018-27

Figure 27: The US, Energy and Utilities Construction Projects Pipeline, Value by Stage ($ Million)

Figure 28: The US, Total Power Construction Put in Place ($ Million, Nominal)

Figure 29: The US, Construction Put in Place on Water Supply and Sewage and Waste Disposal Infrastructure ($ Million, Nominal)

Figure 30: The US, Total Communication Construction Put in Place ($ Million, Nominal)

Figure 31: The US, Institutional Construction Output by Project Type (Real, $ Million), 2018-27

Figure 32: The US, Institutional Construction Projects Pipeline, Value by Stage ($ Million)

Figure 33: The US, Total Educational, Healthcare, Public Safety, and Religious Buildings Construction Value Put in Place ($ Billion, Nominal)

Figure 34: The US, Residential Construction Output by Project Type (Real, $ Million), 2018-27

Figure 35: The US, Residential Construction Projects Pipeline, Value by Stage ($ Million)

Figure 36: The US, Total Residential Construction Value Put in Place ($ Million, Seasonally Adjusted)

Figure 37: The US, Total New Housing Units Permit Authorized (Seasonally Adjusted, In Thousand)

Figure 38: The US, Housing Starts (Unadjusted), In Thousands

Figure 39: The US, New Home Sales, in Thousands, In Seasonally-Adjusted Annual Rate

Figure 40: The US, Price Index of New Single-Family Houses Under Construction (2005=100)

Figure 41: California, Construction Output Value (Real, $ Billion, 2017 Prices), 2018-27

Figure 42: California, Construction Value-Add in Nominal and Real Terms (% change YoY)

Figure 43: California, New Privately Owned Housing Units Authorized by Building Permits (% change YoY)

Figure 44: California, Construction Employment

Figure 45: Florida, Construction Output Value (Real, $ Billion, 2017 Prices), 2018-27

Figure 46: Florida, Construction Value-Add in Nominal and Real Terms (% change YoY)

Figure 47: Florida, New Privately Owned Housing Units Authorized by Building Permits (% change YoY)

Figure 48: Florida, Construction Employment

Figure 49: Texas, Construction Output Value (Real, $ Billion, 2017 Prices), 2018-27

Figure 50: Texas, Construction Value-Add in Nominal and Real Terms (% change YoY)

Figure 51: Texas, New Privately Owned Housing Units Authorized by Building Permits (% change YoY)

Figure 52: Texas, Construction Employment

Figure 53: New York, Construction Output Value (Real, $ Billion, 2017 Prices), 2018-27

Figure 54: New York, Construction Value-Add in Nominal and Real Terms (% change YoY)

Figure 55: New York, New Privately Owned Housing Units Authorized by Building Permits (% change YoY)

Figure 56: New York, Construction Employment

Figure 57: Pennsylvania, Construction Output Value (Real, $ Billion, 2017 Prices), 2018-27

Figure 58: Pennsylvania, Construction Value-Add in Nominal and Real Terms (% change YoY)

Figure 59: Pennsylvania, New Privately Owned Housing Units Authorized by Building Permits (% change YoY)

Figure 60: Pennsylvania, Construction Employment

Figure 61: Georgia, Construction Output Value (Real, $ Billion, 2017 Prices), 2018-27

Figure 62: Georgia, Construction Value-Add in Nominal and Real Terms (% change YoY)

Figure 63: Georgia, New Privately Owned Housing Units Authorized by Building Permits (% change YoY)

Figure 64: Georgia, Construction Employment

Figure 65: Illinois, Construction Output Value (Real, $ Billion, 2017 Prices), 2018-27

Figure 66: Illinois, Construction Value-Add in Nominal and Real Terms (% change YoY)

Figure 67: Illinois, New Privately Owned Housing Units Authorized by Building Permits (% change YoY)

Figure 68: Illinois, Construction Employment

Figure 69: Ohio, Construction Output Value (Real, $ Billion, 2017 Prices), 2018-27

Figure 70: Ohio, Construction Value-Add in Nominal and Real Terms (% change YoY)

Figure 71: Ohio, New Privately Owned Housing Units Authorized by Building Permits (% change YoY)

Figure 72: Ohio, Construction Employment

Figure 73: Washington, Construction Output Value (Real, $ Billion, 2017 Prices), 2018-27

Figure 74: Washington, Construction Value-Add in Nominal and Real Terms (% change YoY)

Figure 75: Washington, New Privately Owned Housing Units Authorized by Building Permits (% change YoY)

Figure 76: Washington, Construction Employment

Figure 77: North Carolina, Construction Output Value (Real, $ Billion, 2017 Prices), 2018-27

Figure 78: North Carolina, Construction Value-Add in Nominal and Real Terms (% change YoY)

Figure 79: Washington, New Privately Owned Housing Units Authorized by Building Permits (% change YoY)

Figure 80: North Carolina, Construction Employment

Figure 81: The US, Headquarters of Key Contractors (% of Total Project Pipeline)

Figure 82: The US, Headquarters of Key Consultants (% of Total Project Pipeline)

Frequently Asked Questions

The construction market size in US was valued at $2.1 billion in 2022.

The construction market in US is expected to achieve an AAGR of more than 4% during 2024- 2027.

The residential construction sector led the US construction market in 2022.

Some of the leading contractors in the US construction market are Actividades de Construccion y Servicios SA, Tutor Perini Corp, Bechtel Corp, Skanska AB, Parsons Corp, Ferrovial SA, Kiewit Corp, AECOM, The Walsh Group, and Suffolk Construction Company Inc.

Some of the leading consultants in the US construction market are AECOM, Jacobs Engineering Group Inc., WSP Global Inc, STV Group Inc, Arup Group Ltd, M. Arthur Gensler Jr. & Associates Inc, Dar Al-Handasah Consultants Shair and Partners Holdings Ltd, Mott MacDonald Group Ltd, Foster + Partners Ltd, and Kimley-Horn and Associates Inc.

$1,495

Can be used by individual purchaser only

$2,990

Can be shared globally by unlimited users within the purchasing corporation e.g. all employees of a single company


Undecided about purchasing this report?

Enquire Before Buying Request a Free Sample

Get in touch to purchase a bespoke set of construction project profiles

reportstore@globaldata.com
Tel +44 (0) 20 7947 2960

Every customer’s requirement is unique. With over 220,000 construction projects tracked, we can create a tailored dataset for you based on the types of projects you are looking for. Please get in touch with your specific requirements and we can send you a quote.

Testimonial

“The GlobalData platform is our go-to tool for intelligence services. GlobalData provides an easy way to access comprehensive intelligence data around multiple sectors, which essentially makes it a one-for-all intelligence platform, for tendering and approaching customers.

GlobalData is very customer orientated, with a high degree of personalised services, which benefits everyday use. The highly detailed project intelligence and forecast reports can be utilised across multiple departments and workflow scopes, from operational to strategic level, and often support strategic decisions. GlobalData Analytics and visualisation solutions has contributed positively when preparing management presentations and strategic papers.”

Business Intelligence & Marketing Manager, SAL Heavy Lift

“COVID-19 has caused significant interference to our business and the COVID-19 intelligence from GlobalData has helped us reach better decisions around strategy. These two highlights have helped enormously to understand the projections into the future concerning our business units, we also utilise the project database to source new projects for Liebherr-Werk to use as an additional source to pitch for new business.”

Market Analyst & Management, Liebherr-Werk

Your daily news has saved me a lot of time and keeps me up-to-date with what is happening in the market, I like that you almost always have a link to the source origin. We also use your market data in our Strategic Business Process to support our business decisions. By having everything in one place on the Intelligence Center it has saved me a lot of time versus looking on different sources, the alert function also helps with this.

Head of Key Accounts, Saab AB

Having used several other market research companies, I find that GlobalData manages to provide that ‘difficult-to-get’ market data that others can’t, as well as very diverse and complete consumer surveys.

Marketing Intelligence Manager, Portugal Foods
Construction
New
Construction: Filings Trends & Signals Q2 2023
$100 | September 2023
Construction
New
Construction: Hiring Trends & Signals Q2 2023
$100 | September 2023
Construction
New
Artificial intelligence in construction: GenAI CAD
$250 | September 2023