United States (US) Lower 48 Unconventional Oil and Gas Market Analysis, Trends, Competitive Benchmarking, Deals and Forecast, H1 2023
Powered by ![]()
All the vital news, analysis, and commentary curated by our industry experts.

US Lower 48 Unconventional Oil and Gas Market Report Overview
The US crude oil production grew in 2023 amid heightened geopolitical tensions in Eastern Europe and the Middle East. The rise in international demand for petroleum products fueled oil production in the country. The United States (US) Lower 48 Unconventional Oil and Gas Market report provides a comprehensive analysis of crude oil and natural gas production in US L48 shale plays for 2020-2027. The report also analyzes the economic viability, well productivity, and well completion parameters across major shale plays in the US. These detailed analyses of the US L48 shale plays are critical in developing impactful business plans to gain a competitive edge.
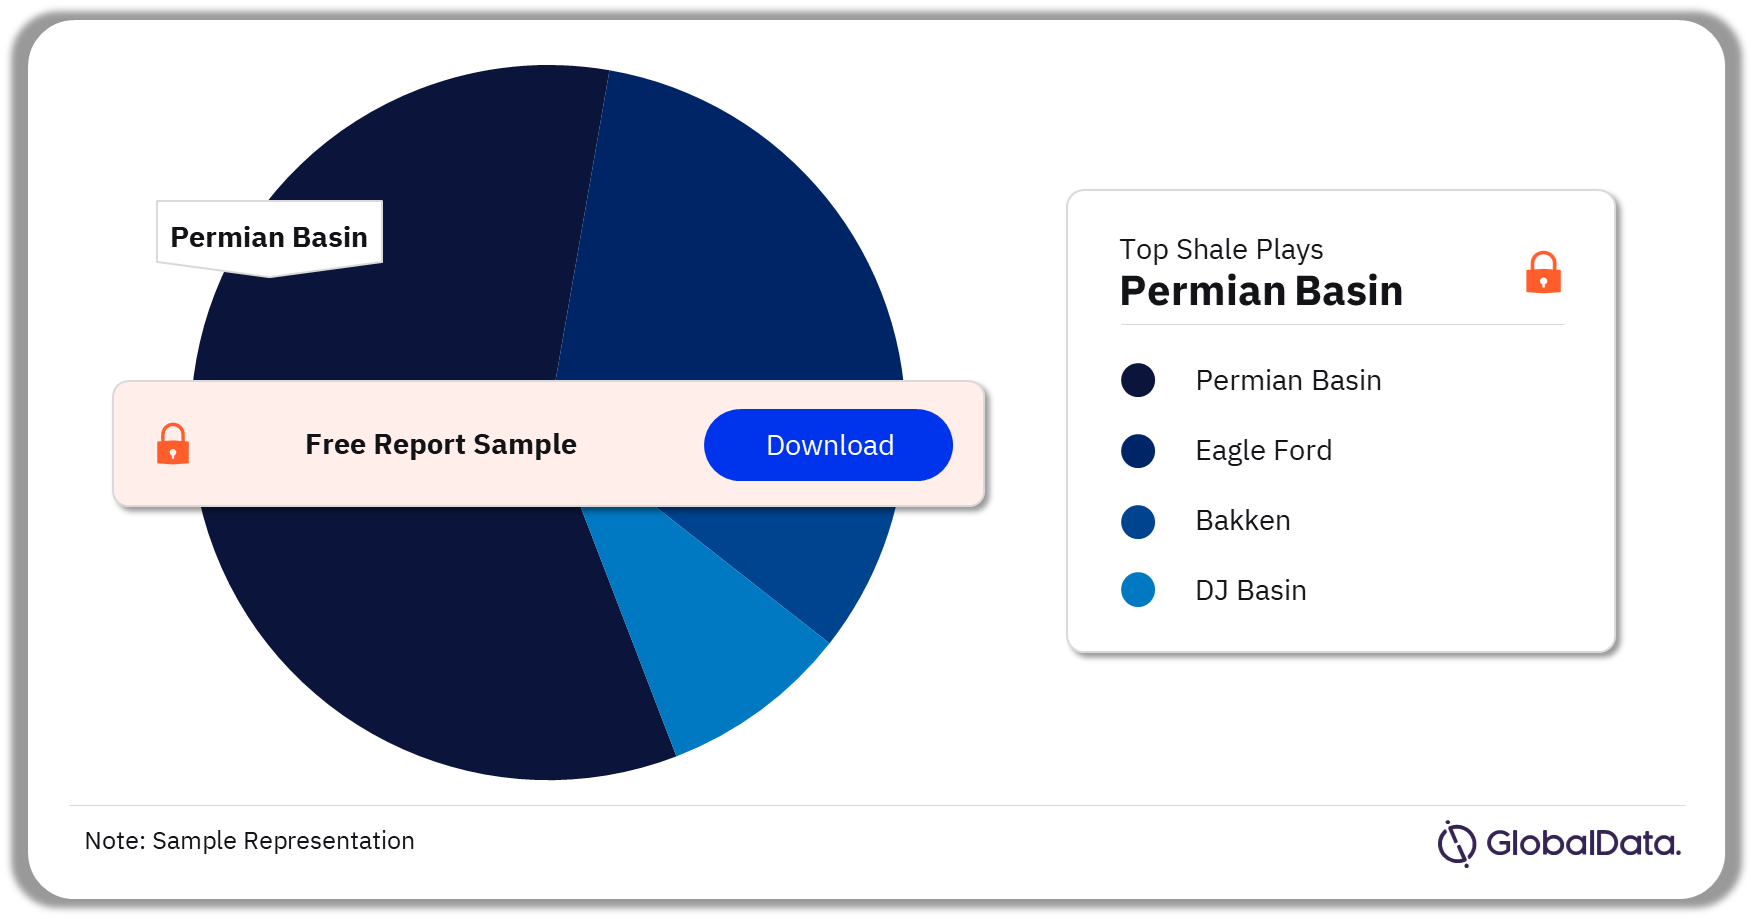
| Major Crude Oil Shale Plays | Permian Basin
Eagle Ford Bakken DJ Basin |
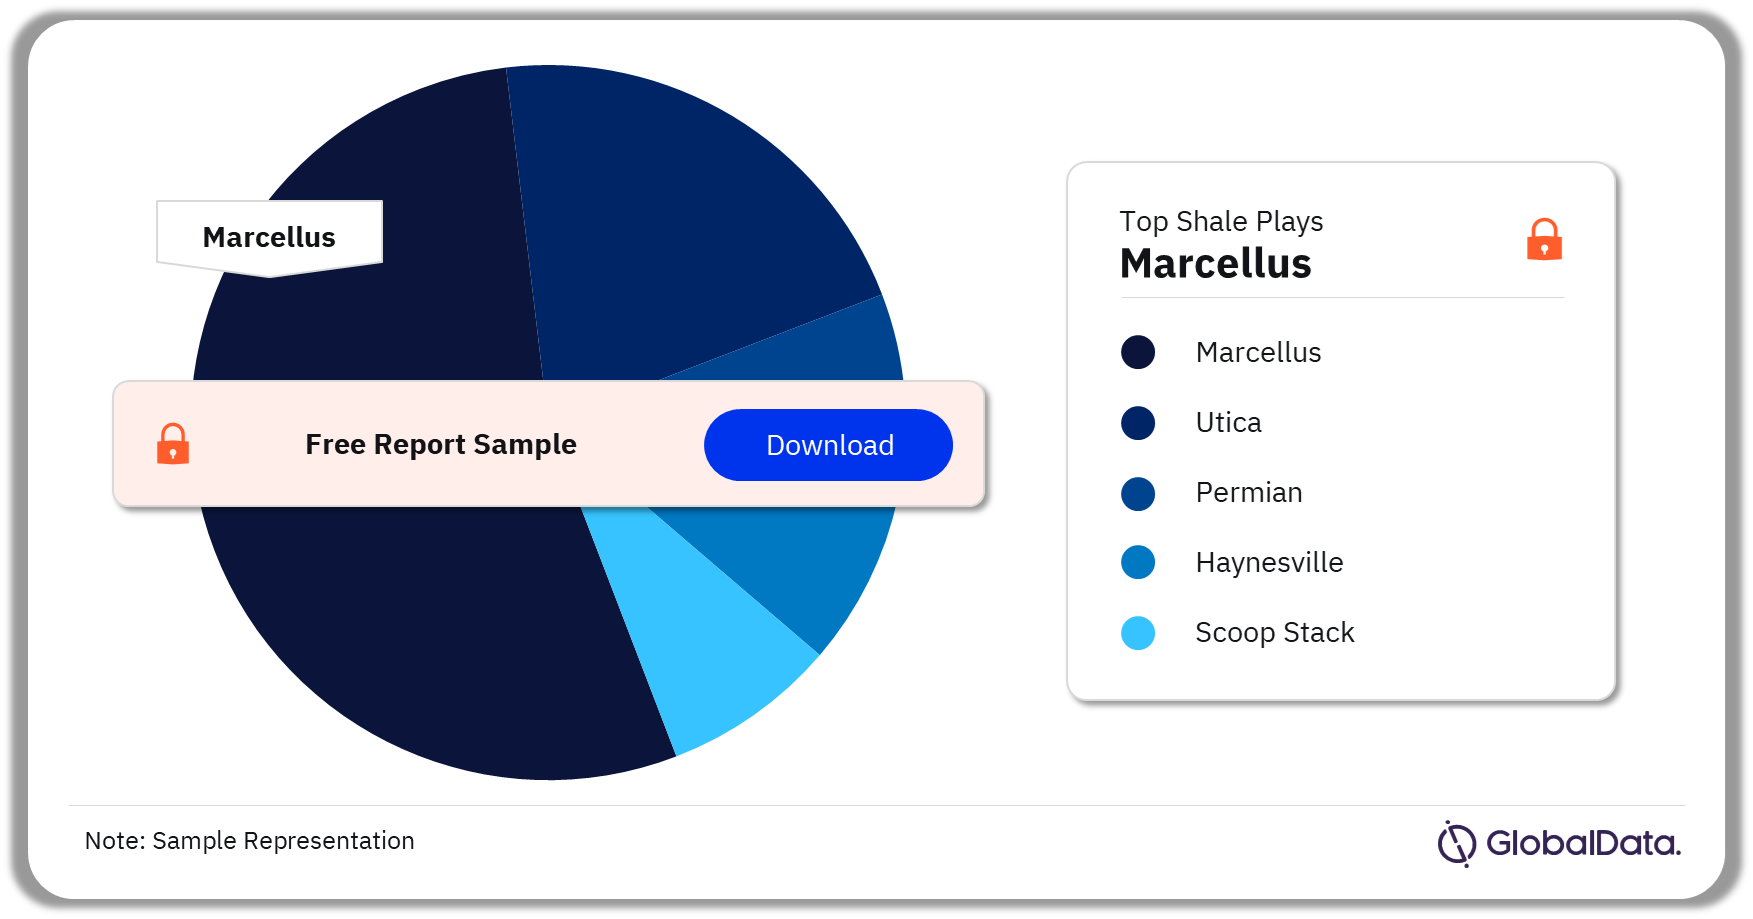
| Major Natural Gas Shale Plays | Marcellus
Utica Permian Haynesville Scoop Stack |
| Major Operators | Occidental Petroleum Corp
ConocoPhillips Chevron Corp Exxon Mobil Corp Chesapeake Energy Corp |
| Enquire & Decide | Discover the perfect solution for your business needs. Enquire now and let us help you make an informed decision before making a purchase. |
US Lower 48 Crude Oil Production Outlook by Major Shale Plays
Crude oil and condensate production is reviewed across the four major oil shales of Permian Basin, Eagle Ford, Bakken, and DJ Basin. The US Lower 48 (L48) crude oil and condensate production is projected to increase primarily in the Permian Basin during 2023-2027. Moreover, the completion of new natural gas pipelines has effectively addressed the challenge of gas flaring, eliminating constraints on crude production. Several new gas pipelines, including the Gulf Coast Express Pipeline Expansion and Permian Highway Pipeline Expansion, facilitate the transportation of the gas, which was earlier flared. In addition, the high oil prices could provide favorable market economics for shale companies to thrive in this play.
Annual Crude Oil Production Outlook Across Major Shale Plays
Buy the Full Report for More Insights on Crude Oil Production Across Major Shale Plays
US Lower 48 Natural Gas Production Outlook by Major Shale Play
Natural gas production is reviewed across the major gas shales of Marcellus, Utica, Permian, Haynesville, and Scoop Stack. The highest contribution to natural gas production growth in the US is expected to come from Marcellus and Permian resource plays during 2023-2027. Marcellus is the largest natural gas formation in the country. The play contributed over one-third of all the unconventional natural gas produced in the country in 2022.
Annual Natural Gas Production Across Major Shale Plays
Buy the Full Report for More Natural Gas Production Insights Across Major Shale Plays
The US Lower 48 - Mergers and Acquisition Activity
Mergers and acquisitions (M&As) play a major role for E&P companies to remain competitive in the US shale oil and gas industry. From January to June 2023, more than 92 deals took place across the US shale plays. One of the biggest deals of 2023 was the acquisition of Pioneer Natural Resources by ExxonMobil. This was followed by Chevron’s acquisition of Hess billion. A few other notable deals of 2023 include Chevron’s acquisition of PDC Energy, Ovintiv’s acquisition of oil and gas assets in Midland Basin from Black Swan Oil & Gas, PetroLegacy Energy and Piedra Resources, and Baytex Energy’s acquisition of Ranger Oil.
Buy the Full Report for More Insights on Mergers and Acquisition Activity Across Major Shale Plays
The US Lower 48 Oil and Gas Market - Competitive Landscape
A few of the major operators in the US lower 48 oil and gas market by total net acreage are Occidental Petroleum Corp, ConocoPhillips, Chevron Corp, Exxon Mobil Corp, and Chesapeake Energy Corp among others.
Top Operators in the US Lower 48 Oil and Gas Market

Buy the Full Report for More Insights on Operators in the US Lower 48 Oil and Gas Market
Scope
The report includes:
- Analysis of the crude oil and natural gas appraisal and production activities in the US Lower 48 shale plays.
- Comprehensive analysis of crude oil and natural gas historical production in US L48 shale plays during 2020-2027.
- Detailed information on well development, permits and deals across US L48 shale plays.
- In-depth information on economic viability, well productivity, and well completion parameters across major shale plays in the US.
- Analysis of top companies’ net acreage, and planned capital expenditure in 2023.
- Up-to-date information on major mergers and acquisitions across major shale plays during 2023.
Reasons to Buy
- Develop business strategies with the help of specific insights into the major shale plays in the US.
- Plan your strategies based on economic viability and expected developments in the major US shale plays.
- Keep yourself informed of the latest M&A activity across major shale plays.
- Identify opportunities and challenges across major US shale.
Table of Contents
Table
Figures
Frequently asked questions
-
Which basin will lead in the US Lower 48 (L48) crude oil and condensate production during the forecast period?
The US Lower 48 (L48) crude oil and condensate production is projected to increase primarily in the Permian Basin during 2023-2027.
-
Which play will lead in the natural gas production in the US during the forecast period?
The highest contribution to natural gas production growth in the US is expected to come from Marcellus play during 2023-2027.
-
Which are the major operators by total net acreage in the US lower 48 oil and gas market?
A few of the major operators in the US lower 48 oil and gas market by total net acreage are Occidental Petroleum Corp, ConocoPhillips, Chevron Corp, Exxon Mobil Corp, and Chesapeake Energy Corp among others.
Get in touch to find out about multi-purchase discounts
reportstore@globaldata.com
Tel +44 20 7947 2745
Every customer’s requirement is unique. With over 220,000 construction projects tracked, we can create a tailored dataset for you based on the types of projects you are looking for. Please get in touch with your specific requirements and we can send you a quote.
Sample Report
United States (US) Lower 48 Unconventional Oil and Gas Market Analysis, Trends, Competitive Benchmarking, Deals and Forecast, H1 2023 was curated by the best experts in the industry and we are confident about its unique quality. However, we want you to make the most beneficial decision for your business, so we offer free sample pages to help you:
- Assess the relevance of the report
- Evaluate the quality of the report
- Justify the cost
Download your copy of the sample report and make an informed decision about whether the full report will provide you with the insights and information you need.


