United States (US) Thermal Power Market Analysis by Size, Installed Capacity, Power Generation, Regulations, Key Players and Forecast to 2035

Powered by

All the vital news, analysis, and commentary curated by our industry experts.

US Thermal Power Market Report Overview

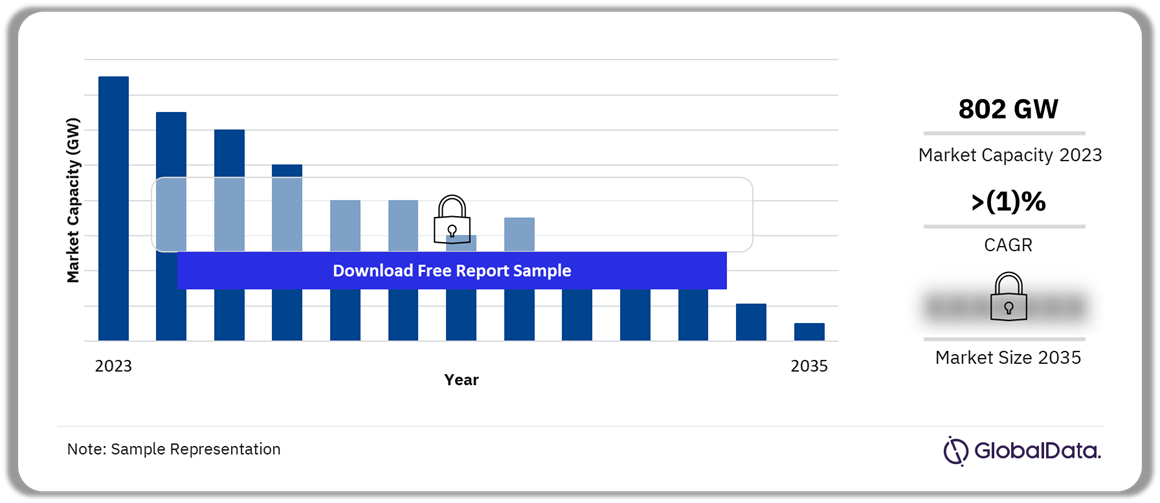
The cumulative capacity for thermal power in the US was 802 GW in 2023. It will decline at a negative CAGR of less than 1% during 2023-2035. Thermal power has the dominant share in mix of the country accounting for a largest power generation share as of 2023. A notable development in the U.S. thermal power market is the sustained dominance of natural gas over coal as the primary source of electricity generation since April 2015.

US Thermal Power Market Outlook, 2023-2035 (GW)

US Thermal Power Market Outlook, 2023-2035 (GW)

Buy the Full Report for More Insights on the US Thermal Power Market Forecast

Download a Free Report Sample

 The US Thermal Power market research report offers comprehensive information and understanding of the thermal power market in the US. The report discusses the thermal power market in the country and provides forecasts up to 2035. The report highlights installed capacity and power generation trends from 2015 to 2035 in the country’s thermal power market. The report also provides company snapshots of some of the major market participants. The report is built using data and information sourced from proprietary databases, secondary research, and in-house analysis by GlobalData’s team of industry experts.

Cumulative Capacity (2023) 802 GW
CAGR (2023-2035) >(1)%
Historical Period 2015-2022
Forecast Period 2023-2035
Key Types ·       Coal

·       Oil

·       Gas

KeyDealTypes ·       Debt Offerings

·       Acquisition

·       Asset Transactions

·       Equity Offerings

·       Private Equity
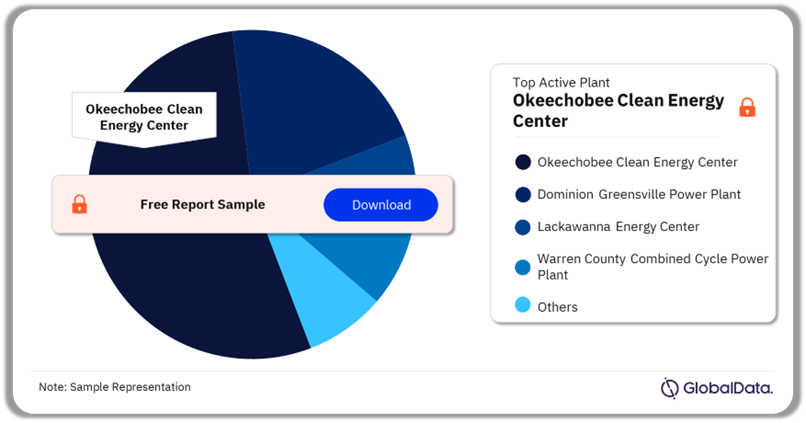
Key Active Plants ·       Okeechobee Clean Energy Center

·       Dominion Greensville Power Plant

·       Lackawanna Energy Center

·       Warren County Combined Cycle Power Plant

·       Cottonwood Energy Project

Key Companies ·       WEC Energy Group Inc

·       AES Corp

·       Santee Cooper

·       PPL Corp

·       NRG Energy Inc

Enquire & Decide Discover the perfect solution for your business needs. Enquire now and let us help you make an informed decision before making a purchase.

US Thermal Power Market Segmentation by Types

The key types in the US thermal power market are coal, oil, and gas. The US thermal power generation from gas was the highest in 2023.

US Thermal Power Market Analysis by Types, 2023 (%)

US Thermal Power Market Analysis by Types, 2023 (%)

Buy the Full Report for More Type Insights into the US Thermal Power Market

Download A Free Report Sample

US Thermal Power Market Segmentation by Deal Types

In 2023, the key deal types in the US thermal power market were debt offerings, acquisition, asset transactions, equity offerings, and private equity, among others. Debt offerings had the highest number of deals.

US Thermal Power Market Analysis by Deal Types, 2023 (%)

US Thermal Power Market Analysis by Deal Types, 2023 (%)

Buy the Full Report for More Deal Types Insights on the US Thermal Power Market

Download A Free Report Sample

US Thermal Power Market - Major Active Plants

A few of the major active plants in the US thermal power market are Okeechobee Clean Energy Center, Dominion Greensville Power Plant, Lackawanna Energy Center, Warren County Combined Cycle Power Plant, and Cottonwood Energy Project, among others. Okeechobee Clean Energy Center led the thermal power market in the US in terms of total capacity in 2023.

US Thermal Power Market Analysis by Active Plants, 2023 (%)

US Thermal Power Market Analysis by Active Plants, 2023 (%)

Buy the Full Report for More Active Plants Insights into the US Thermal Power Market

Download A Free Report Sample

US Thermal Power Market – Competitive Landscape

The key companies in the US thermal power market are WEC Energy Group Inc, AES Corp, Santee Cooper, PPL Corp, and NRG Energy Inc.

SSE Plc: WEC Energy Group Inc (WEC) is an energy holding company. It generates and distributes electricity and thermal energy and delivers natural gas. The company produces electric power using various sources like coal, natural gas, oil, hydro, solar, wind, and biomass. WEC owns, maintains, monitors, and operates electric transmission systems and owns generating facilities and leases those to its group entities.

US Thermal Power Market Analysis by Companies

US Thermal Power Market Analysis by Companies

Buy the Full Report for More Company Insights on the US Thermal Power Market

Download A Free Report Sample

Segments Covered in the Report

US Thermal Power Market Type Outlook (Value, 2015-2035, GW)

  • Coal
  • Oil
  • Gas

US Thermal Power Market Deal Type Outlook (Value, 2015-2035, GW)

  • Debt Offerings
  • Acquisition
  • Asset Transactions
  • Equity Offerings
  • Private Equity

Scope

The report includes:

  • An analysis of the US’s thermal power market.
  • A brief introduction to global carbon emissions and global primary energy consumption.
  • An overview of the country’s power market, highlighting installed capacity trends (2010-2035), generation trends (2010-2035), and installed capacity split by various power sources.
  • Detailed overview of the country’s thermal power market with installed capacity and generation trends, and major active and upcoming thermal power projects.
  • Deal analysis of the country’s thermal power market.
  • Snapshots of some of the major market participants in the country.

Reasons to Buy

  • Enhance your decision-making capability in a more rapid and time-sensitive manner.
  • Identify key growth and investment opportunities in the country’s thermal power market.
  • Facilitate decision-making based on strong historical and forecast data for the thermal power market.
  • Position yourself to gain the maximum advantage of the industry’s growth potential.
  • Identify key partners and business development avenues.
  • Understand and respond to your competitors’ business structure, strategy, and prospects.

Table of Contents

  • 1. Introduction
  • 1.1 Carbon Dioxide Emissions, Global, 2015–2023
  • 1.2 Primary Energy Consumption, Global, 2015–2023
  • 1.3 Report Guidance
  • 2. Power Market, US
  • 2.1 Power Market, US, Installed Capacity, 2015-2035
  • Power Market, US, Cumulative Installed Capacity by Source, 2015-2035
  • Power Market, US, Cumulative Installed Capacity Share by Source, 2023 and 2035
  • Power Market, US, Net Capacity Additions by Source, 2024-2035
  • Power Market, US, Capacity Growth by Source, 2023-2035

  • 2.2 Power Market, US, Power Generation, 2015-2035
  • Power Market, US, Power Generation by Source, 2015-2035
  • Power Market, US, Growth in Power Generation by Source, 2023-2035

  • 3. Thermal Power Market, US
  • 3.1 Thermal Power Market, US, Installed Capacity, 2015-2035
  • Thermal Power Market, US, Cumulative Installed Capacity Split by Types, 2015-2035

  • 3.2 Thermal Power Market, US, Power Generation, 2015-2035
  • Thermal Power Market, US, Power Generation by Type, 2015-2035

  • 3.3 Thermal Power Market, US, Market Size, 2015-2030
  • 3.4 Thermal Power Market, US, Power Plants
  • Thermal Power Market, US, Major Active Plants
  • Thermal Power Market, US, Snapshot of Upcoming Plants
  • Thermal Power Market, US, Key Under-construction Projects.

  • 3.5 Thermal Power Market, US, Deal Analysis, 2023
  • Thermal Power Market, US, Deal Volume vs. Deal Value, 2015–2023
  • Thermal Power Market, US, Split by Deal Type, 2023

  • 4. Steam Turbines Market, US
  • 4.1 Steam Turbines Market, US, Market Size, 2015-2028
  • 5. Gas Turbines Market, US
  • 5.1 Gas Turbines Market, US, Market Size, 2015-2028
  • 6. Thermal Power Policy, US
  • The Energy Policy Act of 2005
  • Alternative Fuel Excise Tax Credit

  • 7. Thermal Power Market, US, Company Profiles
  • 7.1 WEC Energy Group Inc
  • WEC Energy Group Inc – Company Overview
  • WEC Energy Group Inc – Business Description
  • WEC Energy Group Inc – SWOT Analysis
  • WEC Energy Group Inc – Major Products and Services
  • WEC Energy Group Inc – Head Office

  • 7.2 The AES Corp
  • The AES Corp – Company Overview
  • The AES Corp – Business Description
  • The AES Corp – SWOT Analysis
  • The AES Corp – Major Products and Services
  • The AES Corp – Head Office

  • 7.3 Santee Cooper
  • Santee Cooper – Company Overview
  • Santee Cooper – Business Description
  • Santee Cooper – SWOT Analysis
  • Santee Cooper – Major Products and Services
  • Santee Cooper – Head Office

  • 7.4 PPL Corp
  • PPL Corp – Company Overview
  • PPL Corp – Business Description
  • PPL Corp – SWOT Analysis
  • PPL Corp – Major Products and Services
  • PPL Corp – Head Office

  • 7.5 NRG Energy Inc
  • NRG Energy Inc – Company Overview
  • NRG Energy Inc – Business Description
  • NRG Energy Inc – SWOT Analysis
  • NRG Energy Inc – Major Products and Services
  • NRG Energy Inc – Head Office

  • 8. Appendix
  • 8.1 Abbreviations
  • 8.2 Methodology
  • Coverage
  • Secondary Research
  • Primary Research
  • Modelling and Forecasting
  • About GlobalData
  • Contact Us

Table

List of Tables

Table 1: Carbon Dioxide Emissions from Energy Consumption, Global, 2015–2023

Table 2: Primary Energy Consumption, Global, 2015–2023

Table 3: Power Market, US, Cumulative Installed Capacity by Source (GW), 2015-2035

Table 4: Power Market, US, Cumulative Installed Capacity Share by Source (%), 2023 and 2035

Table 5: Power Market, US, Net Capacity Additions by Source (GW), 2024-2035

Table 6: Power Market, US, Capacity Growth by Source, 2023-2035

Table 7: Power Market, US, Power Generation by Source (TWh), 2015-2035

Table 8: Power Market, US, Growth in Power Generation by Source, 2023-2035

Table 9: Thermal Power Market, US, Installed Capacity (GW), 2015-2035

Table 10: Thermal Power Market, US, Cumulative Installed Capacity by Type (GW), 2015-2035

Table 11: Thermal Power Market, US, Power Generation (TWh), 2015-2035

Table 12: Thermal Power Market, US, Power Generation by Type (TWh), 2015-2035

Table 13: Thermal Power Market, US, Market Size ($M), 2015-2030

Table 14: Thermal Power Market, US, Major Active Plants

Table 15: Thermal Power Market, US, Snapshot of Upcoming Plants

Table 16: Thermal Power Market, US, Key Under-construction Projects

Table 17: Thermal Power Market, US, Deal Volume vs. Deal Value ($M), 2015–2023

Table 18: Thermal Power Market, US, Deals by Type, 2023

Table 19: Steam Turbines Market, US, Market Size ($M), 2015-2028

Table 20: Gas Turbines Market, US, Market Size ($M), 2015-2028

Table 21: WEC Energy Group Inc, Major Products and Services

Table 22: The AES Corp, Major Products and Services

Table 23: Santee Cooper, Major Products and Services

Table 24: PPL Corp, Major Products and Services

Table 25: NRG Energy Inc, Major Products and Services

Table 26: Abbreviations

Figures

List of Figures

Figure 1: Carbon Dioxide Emissions from Energy Consumption, Global, 2015–2023

Figure 2: Primary Energy Consumption, Global, 2015–2023

Figure 3: Power Market, US, Cumulative Installed Capacity by Source (GW), 2015-2035

Figure 4: Power Market, US, Cumulative Installed Capacity Share by Source (%), 2023 and 2035

Figure 5: Power Market, US, Net Capacity Additions by Source (GW), 2024-2035

Figure 6: Power Market, US, Capacity Growth by Source, 2023-2035

Figure 7: Power Market, US, Power Generation by Source (TWh), 2015-2035

Figure 8: Power Market, US, Growth in Power Generation by Source, 2023-2035

Figure 9: Thermal Power Market, US, Installed Capacity (GW), 2015-2035

Figure 10: Thermal Power Market, US, Cumulative Installed Capacity by Type (GW), 2015-2035

Figure 11: Thermal Power Market, US, Power Generation (TWh), 2015-2035

Figure 12: Thermal Power Market, US, Power Generation by Type (TWh), 2015-2035

Figure 13: Thermal Power Market, US, Market Size ($M), 2015-2030

Figure 14: Thermal Power Market, US, Snapshot of Upcoming Plants

Figure 15: Thermal Power Market, US, Deal Volume vs. Deal Value ($M), 2015–2023

Figure 16: Thermal Power Market, US, Split by Deal Type (%), 2023

Figure 17: Steam Turbines Market, US, Market Size ($M), 2015-2028

Figure 18: Gas Turbines Market, US, Market Size ($M), 2015-2028

Frequently asked questions

United States (US) Thermal Power Market Analysis by Size, Installed Capacity, Power Generation, Regulations, Key Players and Forecast to 2035 standard reports
Currency USD
$995

Can be used by individual purchaser only

$1,990

Can be shared globally by unlimited users within the purchasing corporation e.g. all employees of a single company


Undecided about purchasing this report?

Enquire Before Buying Download FREE Resources

Get in touch to find out about multi-purchase discounts

reportstore@globaldata.com
Tel +44 20 7947 2745

Sample Report

United States (US) Thermal Power Market Analysis by Size, Installed Capacity, Power Generation, Regulations, Key Players and Forecast to 2035 was curated by the best experts in the industry and we are confident about its unique quality. However, we want you to make the most beneficial decision for your business, so we offer free sample pages to help you:

  • Assess the relevance of the report
  • Evaluate the quality of the report
  • Justify the cost

Download your copy of the sample report and make an informed decision about whether the full report will provide you with the insights and information you need.

Below is a sample report to understand what you are buying

See what our customers are saying
testimonial-image
testimonial-image
testimonial-image
testimonial-image
testimonial-image
testimonial-image
testimonial-image

“The GlobalData platform is our go-to tool for intelligence services. GlobalData provides an easy way to access comprehensive intelligence data around multiple sectors, which essentially makes it a one-for-all intelligence platform, for tendering and approaching customers.

GlobalData is very customer orientated, with a high degree of personalised services, which benefits everyday use. The highly detailed project intelligence and forecast reports can be utilised across multiple departments and workflow scopes, from operational to strategic level, and often support strategic decisions. GlobalData Analytics and visualisation solutions has contributed positively when preparing management presentations and strategic papers.”

Business Intelligence & Marketing Manager, SAL Heavy Lift

“COVID-19 has caused significant interference to our business and the COVID-19 intelligence from GlobalData has helped us reach better decisions around strategy. These two highlights have helped enormously to understand the projections into the future concerning our business units, we also utilise the project database to source new projects for Liebherr-Werk to use as an additional source to pitch for new business.”

Market Analyst & Management, Liebherr-Werk

Your daily news has saved me a lot of time and keeps me up-to-date with what is happening in the market, I like that you almost always have a link to the source origin. We also use your market data in our Strategic Business Process to support our business decisions. By having everything in one place on the Intelligence Center it has saved me a lot of time versus looking on different sources, the alert function also helps with this.

Head of Key Accounts, Saab AB

Having used several other market research companies, I find that GlobalData manages to provide that ‘difficult-to-get’ market data that others can’t, as well as very diverse and complete consumer surveys.

Marketing Intelligence Manager, Portugal Foods

Our experience with GlobalData has been very good, from the platform itself to the people. I find that the analysts and the account team have a high level of customer focus and responsiveness and therefore I can always rely on. The platform is more holistic than other providers. It is convenient and almost like a one stop shop. The pricing suite is highly competitive and value for our organisation.

I like reports that inform new segments such as the analysis on generation Z, millennials, the impact of COVID 19 to our banking customers and their new channel habits. Secondly the specialist insight on affluent sector significantly increases our understanding about this group of customers. The combination of those give us depth and breadth of the evolving market.

I’m in the business of answering and helping people make decisions so with the intelligence center I can do that, effectively and efficiently. I can share quickly key insights that answer and satisfy our country stakeholders by giving them many quality studies and primary research about competitive landscape beyond the outlook of our bank. It helps me be seen as an advisory partner and that makes a big difference. A big benefit of our subscription is that no one holds the whole data and because it allows so many people, so many different parts of our organisation have access, it enables all teams to have the same level of knowledge and decision support.

Head of Customer Insight and Research, Standard Chartered

“I know that I can always rely on Globaldata’s work when I’m searching for the right consumer and market insights. I use Globaldata insights to understand the changing market & consumer landscape and help create better taste & wellbeing solutions for our customers in food, beverage and healthcare industries.

Globaldata has the right data and the reports are of very high quality compared to your competitors. Globaldata not only has overall market sizes & consumer insights on food & beverages but also provides insights at the ingredient & flavour level. That is key for B2B companies like Givaudan. This way we understand our customers’ business and also gain insight to our unique industry”

Head of Consumer Sensory Insights, Givaudan

GlobalData provides a great range of information and reports on various sectors that is highly relevant, timely, easy to access and utilise.  The reports and data dashboards help engagement with clients; they provide valuable industry and market insights that can enrich client conversations and can help in the shaping of value propositions. Moreover, using GlobalData products has helped increase my knowledge of the finance sector, the players within it, and the general threats and opportunities.

I find the consumer surveys that are carried out to be extremely beneficial and not something I have seen anywhere else. They provided an insightful view of why and which consumers take (or don’t) particular financial products. This can help shape conversations with clients to ensure they make the right strategic decisions for their business.

One of the challenges I have found is that data in the payments space is often piecemeal. With GD all of the data I need is in one place, but it also comes with additional market reports that provide useful extra context and information. Having the ability to set-up alerts on relevant movements in the industry, be it competitors or customers, and have them emailed directly to me, ensures I get early sight of industry activity and don’t have to search for news.

Senior Account Manager, TSYS
Go even deeper with GlobalData Intelligence Center

Every Company Report we produce is powered by the GlobalData Intelligence Center.

Subscribing to our intelligence platform means you can monitor developments at United States (US) Thermal Power Market Analysis by Size, Installed Capacity, Power Generation, Regulations, Key Players and Forecast to 2035 in real time.

  • Access a live United States (US) Thermal Power Market Analysis by Size, Installed Capacity, Power Generation, Regulations, Key Players and Forecast to 2035 dashboard for 12 months, with up-to-the-minute insights.
  • Fuel your decision making with real-time deal coverage and media activity.
  • Turn insights on financials, deals, products and pipelines into powerful agents of commercial advantage.