

The Asia-Pacific (APAC) region dominated the 2026 Forbes Global 2000 list, with 792 APAC-headquartered companies contributing to 34% ($18.7 trillion) of the total aggregate revenue ($54.8 trillion) of all companies featured in the list, according to GlobalData, a leading intelligence and productivity platform.
North America stood second, with 668 companies generating a combined revenue of $22 trillion, followed by Europe, with 410 companies generating a combined revenue of $11.9 trillion. The Middle East and Africa, with 78 companies, recorded a combined revenue of $1.1 trillion, and South and Central America, with 52 companies, saw a combined revenue of $1.1 trillion.
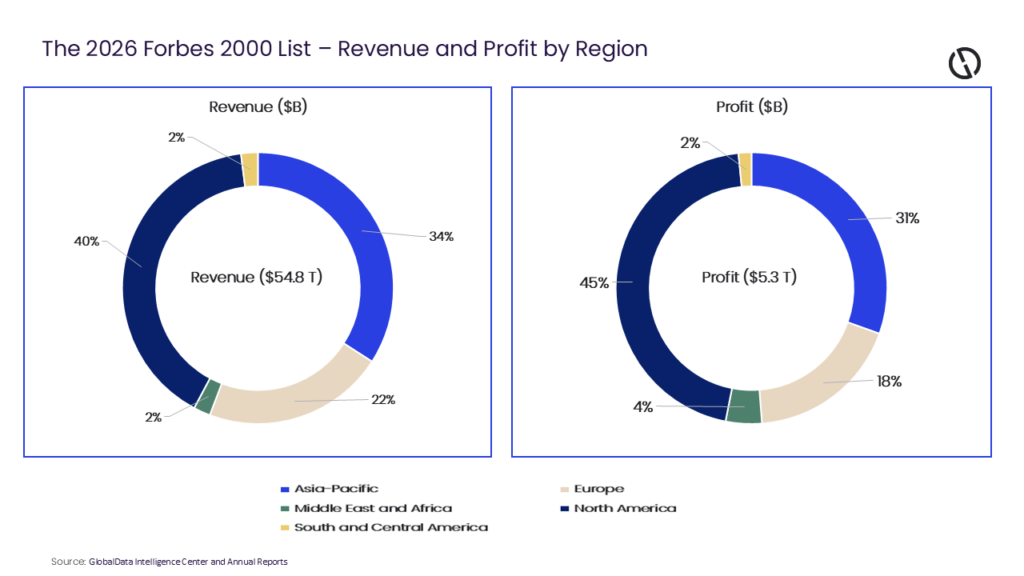
North America accounted for 45.4% of the total $5.3 trillion profit pool of companies in the Forbes 2000 list, followed by APAC (30.4%), Europe (18.3%), the Middle East and Africa (4.3%), and South and Central America (1.5%).
The Middle East and Africa surprisingly dwarfed all other regions in terms of generating profit through per unit of revenue, with a net profit margin of 20.7%, followed by North America (10.9%), Asia-Pacific (8.7%), Europe (8.2%), and South and Central America (7.5%).
The breakdown by sector reveals that the top five sectors by revenue accounted for 66.1% of the 2026 Forbes 2000 revenue pool, and 63.5% of total companies, which translates into $34.8 trillion and 1,321 companies, respectively.
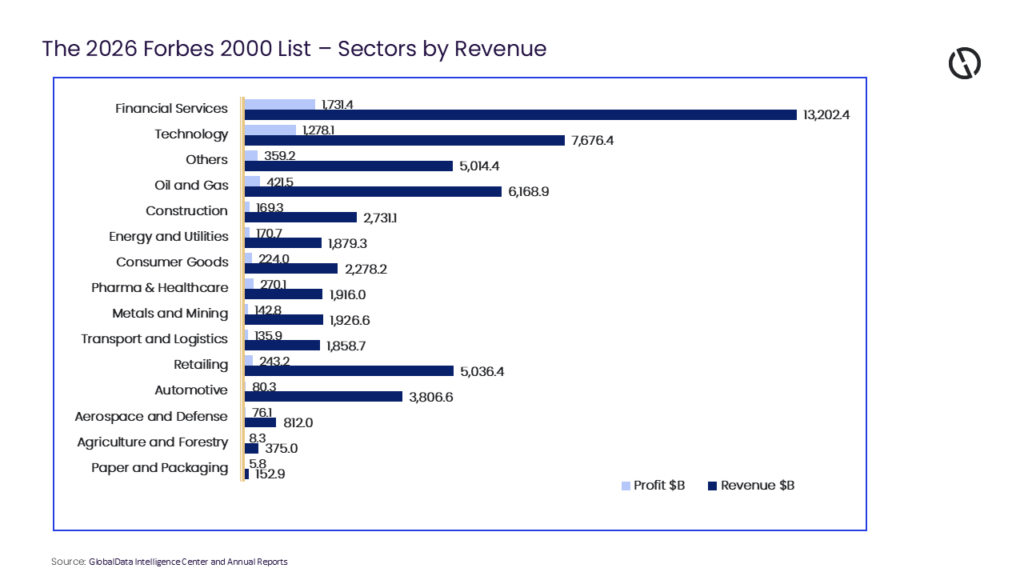
Financial services, technology & communications, and oil & gas were the leading profitable sectors with a combined aggregate profit of over $1.7 trillion, $1.3 trillion, and $421.5 billion, respectively.
The technology & communications reported the highest net profit margin of 16.6%, followed by pharmaceuticals and healthcare (14.1%), financial services (13.1%), consumer goods (9.8%), and aerospace and defense (9.4%). A few notable first-time entries include Bullish, Galaxy Digital, and Hanwha Corp.
Murthy Grandhi, Company Profiles Analyst at GlobalData, comments: “Automotive is the list’s problem child, with 77 companies recording a razor-thin margin of 2.1%. While Stellantis, Renault, and Ford lost $25.2 billion, $12.3 billion, and $8.2 billion, respectively, Toyota banked $24.7 billion—proof that even within a struggling sector, execution still separates winners from losers. Across the whole list, 125 companies reported net loss, from telecom names like Telefónica and EchoStar to Chinese property developer China Vanke, down $12.3 billion.”
With 592 companies—under 30% of the list—US firms’ pocket over 42% of all profit on the board, $2.2 trillion out of $20.5 trillion in revenue. Seven of the ten most profitable companies are US companies. Microsoft tops the profit table at $133.7 billion, edging out Alphabet’s $132.2 billion, followed by Nvidia ($120.1 billion) and Apple ($112.0 billion). And here’s the twist at the top of the revenue table: Amazon ($716.9 billion) barely beats Walmart ($713.2 billion), but it pockets $77.7 billion in profit compared to Walmart’s $21.9 billion.
Grandhi concludes: “GlobalData anticipates that profit will stay concentrated where geopolitics, supply chains, and policy tilt the field. US–China tech restrictions will keep AI and semiconductor gains anchored in a few US and Taiwanese leaders while pressuring Chinese exporters and automakers midway through the EV transition. Middle East volatility will continue to swing energy earnings even when sector margins are thin, and diverging interest-rate paths should sustain bank profitability while squeezing low-margin industrials and autos. Companies exposed to single-country supply chains — automakers, telecom operators, Chinese property developers — are already showing losses.”
