Australia Wind Power Market Analysis by Size, Installed Capacity, Power Generation, Regulations, Key Players and Forecast to 2035

Powered by

All the vital news, analysis, and commentary curated by our industry experts.

Australia Wind Power Market Report Overview

In 2023, the cumulative installed capacity for wind power in Australia was 10.92 GW and will grow at a CAGR of more than 11% during 2023-2035. In 2023, onshore wind was the dominant source of wind power generation across the country.

Australia Wind Power Market Outlook 2023-2035
Buy Full Report to Get More Insights into the Australian Wind Power Market Forecast,

Download a Free Report Sample

The Australia wind power market research report discusses the renewable power market in the country and predicts future outcomes until 2035. The report also gives detailed coverage of the renewable energy policy framework governing the Australian wind power market.

Cumulative Installed Capacity (2023) 10.92 GW
CAGR (2023-2035) >11%
Historical Period 2015-2022
Forecast Period 2023-2035
Regulations ·       Renewable Energy Target (RET) Scheme

·       Long Term Emissions Reduction Plan

Key Power Type ·       Onshore Wind

·       Offshore Wind

Leading Companies ·       AGL Energy Ltd

·       Iberdrola SA

·       Origin Energy Ltd

·       Renewable Energy Systems Holdings Ltd

·       Neoen SA

Key Active Plants (Onshore) ·       Stockyard Hill Wind Farm

·       Macarthur

·       Dundonnell Wind Farm

·       Coopers Gap

·       Bango Wind Farm

Key Deal Type ·       Acquisition

·       Debt Offerings

·       Asset Transaction

·       Partnership

·       Equity Offerings

Enquire & Decide Discover the perfect solution for your business needs. Enquire now and let us help you make an informed decision before making a purchase.

Australia Renewable Energy Policy Framework

  • The Ministerial Council of Energy released a document entitled Reform of Energy Markets, on December 11, 2003. The purpose of this document was to initiate the creation of a national power and natural gas market rather than a state-based provision for the markets. As a result, two federal-level institutions, the Australian Energy Market Commission (AEMC) and the Australian Energy Regulator (AER), were created. The AEMC, which was established under the Australian Energy Market Commission Establishment Act 2004, is responsible for rule and policymaking for the NEM.
  • In August 2009, the government introduced the RET scheme to deliver on the government’s assurance that a certain amount of electricity will be derived from renewable sources by 2020, this target was achieved. The RET scheme supersedes the previous Mandatory Renewable Energy Target (MRET) scheme, which was introduced in 2001. The MRET scheme obligated large wholesale buyers of power to support renewable energy generation.

Buy Full Report to Get More Insights into Australia’s Renewable Energy Policy Framework,

Download a Free Report Sample

Australia Wind Power Market – Competitive Landscape

AGL Energy Ltd, Iberdrola SA, Origin Energy Ltd, Neoen SA, and Renewable Energy Systems Holdings Ltd are a few of the market players in the wind power market in Australia.

 AGL Energy Ltd – Headquartered in Sydney, Australia, AGL Energy Ltd (AGL) is an integrated energy company that owns, operates, and develops energy assets and provides natural gas, electricity, solar photovoltaic solutions, and related products and services. The company’s power generation portfolio includes coal, gas, hydro, wind, solar, landfill, and biomass-based power generation facilities. It also invests in and operates natural gas exploration, development, and production tenements and operates natural gas storage facilities.

Australia Wind Power Market Analysis by Companies

Australia Wind Power Market Analysis by Companies

Buy Full Report to Get More Insights into the Australian Wind Power Market Companies,

Download a Free Report Sample

Australia Wind Power Market - Major Active Plants

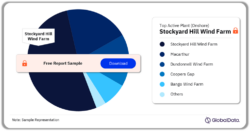
Stockyard Hill Wind Farm led the Australian wind power market under onshore sources in terms of total capacity contribution in 2024.

Australia Wind Power Market, by Active Plants, 2024 (%)
Australia Wind Power Market, by Active Plants, 2024 (%)

Buy the Full Report to Get More Insights into the Australian Wind Power Market Active Plants,

Download a Free Report Sample

Australia Wind Power Market Segmentation by Deal Types

In 2023, the wind power market in Australia recorded most of the deals in acquisitions and debt offerings. It was followed by an asset transaction.

Australia Wind Power Market Analysis, by Deal Types, 2023 (%)

Australia Wind Power Market Analysis, by Deal Types, 2023 (%)

Buy the Full Report to Get More Insights into the Australian Wind Power Market Deal Types,

Download a Free Report Sample

Segments Covered in the Report

Australia Wind Power Market Deal Type Outlook (2015-2035)

  • Acquisition
  • Debt Offerings
  • Asset Transaction
  • Partnership
  • Equity Offerings

Scope

The report analyses Australia’s wind power market. The scope of the research includes:

  • A brief introduction on global carbon emissions and global primary energy consumption.
  • An overview of the country’s renewable power market, highlighting installed capacity trends (2015-2035), generation trends (2015-2035), and installed capacity split by various renewable power sources.
  • Detailed overview of the country’s wind power market with installed capacity and generation trends and major active and upcoming wind power projects.
  • Deal analysis of the country’s wind power market.
  • Key policies and regulatory framework supporting the development of wind power sources.
  • Snapshots of some of the major market participants in the country.

Reasons to Buy

  • Enhance your decision-making capability in a more rapid and time-sensitive manner.
  • Identify key growth and investment opportunities in the country’s wind power market.
  • Facilitate decision-making based on strong historical and forecast data for the wind power market.
  • Position yourself to gain the maximum advantage of the industry’s growth potential.
  • Develop strategies based on the latest regulatory events.
  • Identify key partners and business development avenues.
  • Understand and respond to your competitors’ business structure, strategy, and prospects.

AGL Energy Ltd
Iberdrola SA
Origin Energy Ltd
Renewable Energy Systems Holdings Ltd
Neoen SA

Table of Contents

Table of Contents

List of Tables

List of Figures

1. Introduction

1.1 Carbon Dioxide Emissions, Global, 2015–2023

1.2 Primary Energy Consumption, Global, 2015–2023

1.3 Report Guidance

2. Renewable Power Market, Australia

2.1 Renewable Power Market, Australia, Installed Capacity, 2015-2035

– Renewable Power Market, Australia, Cumulative Installed Capacity by Source, 2015-2035

– Renewable Power Market, Australia, Cumulative Installed Capacity Share by Source, 2023 and 2035

– Renewable Power Market, Australia, Net Capacity Additions by Source, 2024-2035

– Renewable Power Market, Australia, Capacity Growth by Source, 2023-2035

2.2 Renewable Power Market, Australia, Power Generation, 2015-2035

– Renewable Power Market, Australia, Power Generation by Source, 2015-2035

– Renewable Power Market, Australia, Growth in Power Generation by Source, 2023-2035

3. Wind Power Market, Australia

3.1 Wind Power Market, Australia, Installed Capacity, 2015-2035

– Wind Power Market, Australia, Cumulative Installed Capacity Split by Onshore and Offshore Wind, 2015-2035

3.2 Wind Power Market, Australia, Power Generation, 2015-2035

– Wind Power Market, Australia, Power Generation by Type, 2015-2035

3.3 Wind Power Market, Australia, Market Size, 2015-2030

3.4 Wind Power Market, Australia, Power Plants

– Wind Power Market, Australia, Major Active Plants

– Wind Power Market, Australia, Snapshot of Upcoming Plants

– Wind Power Market, Australia, Key Under-construction Projects.

3.5 Wind Power Market, Australia, Deal Analysis, 2023

– Wind Power Market, Australia, Deal Volume vs. Deal Value, 2015–2023

– Wind Power Market, Australia, Split by Deal Type, 2023

3.6 Wind Power Market, Australia, Turbine Market, 2015-2028

– Wind Turbine Market, Australia, Annual Installed Capacity, 2015-2028

– Wind Turbine Market, Australia, Market Size, 2015-2028

4. Renewable Energy Policy, Australia

4.1 Renewable Energy Market, Overview

4.2 Policy Snapshot

4.3 Renewable Energy Targets

4.4 Renewable Energy Policy Framework

– Renewable Energy Target (RET) Scheme

– Climate Change Target 2030

– Long Term Emissions Reduction Plan

– Offshore Clean Energy Infrastructure Regulatory Framework

– Financial Incentives and Policy Support for Solar Power, Australia, Federal Incentives

– Clean Energy Finance Corporation (CEFC)

– Emissions Reduction Fund (ERF)

– 2023-24 Budget

– National Hydrogen Strategy

– Australia-Germany Hydrogen Accord – Hygate program

– Microgrids

– Australian Clean Hydrogen Trade Program (ACHTP)

4.5 State Level Policies and Incentives-South Australia

– Feed-in Tariffs

– South Australia Renewable Energy Auctions

– The Sustainability Incentives Scheme

– South Australia Energy and Emissions Reduction Agreement

– National Hydrogen Strategy – South Australia

4.6 State Level Policies and Incentives-New South Wales (NSW)

– Electricity Infrastructure Roadmap

– Assessing large-scale solar projects in NSW

– Proposed New Energy Policy Framework

– Feed-in Tariffs

– Funds for Renewable Energy in Regional Communities

– Solar Homes Policy

– Solar for Low Income Household

– Empowering Homes: Solar Battery Loan Program

– NSW Energy and Emissions Reduction Agreement

– National Hydrogen Strategy – New South Wales

– Small-scale Technology Certificates

4.7 State Level Policies and Incentives-Victoria

– Renewable Energy Action Plan

– Victoria’s Climate Change Strategy

– Feed-in Tariffs

– Agriculture Energy Investment Plan (AEIP)

– New Renewable Energy Target for Victoria (VRET)

– The Victorian Renewable Energy Auction Scheme (VREAS)

– Renewable Hydrogen Commercialization Pathways Fund

– Victorian Big Battery (VBB)

– National Hydrogen Strategy – Victoria

4.8 State Level Policies and Incentives-Tasmania

– Feed-in Tariffs

– Renewable Energy Action Plan

– Renewable Energy Target

– Tasmania Energy and Emissions Reduction Agreement

– National Hydrogen Strategy – Tasmania

– Tasmanian Renewable Hydrogen Action Plan

4.9 State Level Policies and Incentives-Queensland

– Feed-in Tariffs

 Queensland Renewable Energy Auctions

– Queensland interest-free solar loans

– Solar 150 initiative

– CleanCo

– National Hydrogen Strategy – Queensland

4.10 State Level Policies and Incentives-Australian Capital Territory

– ACT Renewable Energy Auctions

– Home Battery Storage Program

– Rooftop Solar Scheme

– Sustainable Household Scheme

– National Hydrogen Strategy – Australian Capital Territory

4.11 State Level Policies and Incentives-Western Australia

– Climate Policy

– Energy Transformation Strategy

– Distributed Energy Buyback Scheme (DEBS)

– National Hydrogen Strategy – Western Australia

4.12 State Level Policies and Incentives-Northern Territory

– Roadmap to achieve Renewable Energy Target

– Incentives for Renewable Energy

– Solar Energy Transformation Program (SETuP)

– National Hydrogen Strategy – Northern Territory

5. Wind Power Market, Australia, Company Profiles

5.1 AGL Energy Ltd

– AGL Energy Ltd – Company Overview

– AGL Energy Ltd – Business Description

– AGL Energy Ltd – SWOT Analysis

– AGL Energy Ltd – Major Products and Services

– AGL Energy Ltd – Head Office

5.2 Iberdrola SA

– Iberdrola SA – Company Overview

– Iberdrola SA – Business Description

– Iberdrola SA – SWOT Analysis

– Iberdrola SA – Major Products and Services

– Iberdrola SA – Head Office

5.3 Origin Energy Ltd

– Origin Energy Ltd – Company Overview

– Origin Energy Ltd – Business Description

– Origin Energy Ltd – SWOT Analysis

– Origin Energy Ltd – Major Products and Services

– Origin Energy Ltd – Head Office

5.4 Renewable Energy Systems Holdings Ltd

– Renewable Energy Systems Holdings Ltd – Company Overview

– Renewable Energy Systems Holdings Ltd – Major Products and Services

– Renewable Energy Systems Holdings Ltd – Head Office

5.5 Neoen SA

– Neoen SA – Company Overview

– – Neoen SA – Major Products and Services

– Neoen SA – Head Office

6. Appendix

6.1 Abbreviations

6.2 Methodology

– Coverage

– Secondary Research

– Primary Research

– Modelling and Forecasting

About GlobalData

Contact Us

Table

Table 1: Carbon Dioxide Emissions from Energy Consumption, Global, 2015–2023

Table 2: Primary Energy Consumption, Global, 2015–2023

Table 3: Renewable Power Market, Australia, Cumulative Installed Capacity by Source (GW), 2015-2035

Table 4: Renewable Power Market, Australia, Cumulative Installed Capacity Share by Source (%), 2023 and 2035

Table 5: Renewable Power Market, Australia, Net Capacity Additions by Source (GW), 2024-2035

Table 6: Renewable Power Market, Australia, Capacity Growth by Source, 2023-2035

Table 7: Renewable Power Market, Australia, Power Generation by Source (TWh), 2015-2035

Table 8: Renewable Power Market, Australia, Growth in Power Generation by Source, 2023-2035

Table 9: Wind Power Market, Australia, Installed Capacity (GW), 2015-2035

Table 10: Wind Power Market, Australia, Cumulative Installed Capacity by Type (GW), 2015-2035

Table 11: Wind Power Market, Australia, Power Generation (TWh), 2015-2035

Table 12: Wind Power Market, Australia, Power Generation by Type (TWh), 2015-2035

Table 13: Wind Power Market, Australia, Market Size ($M), 2015-2030

Table 14: Wind Power Market, Australia, Major Active Plants – Onshore

Table 15: Wind Power Market, Australia, Snapshot of Upcoming Plants

Table 16: Wind Power Market, Australia, Key Under-construction Projects

Table 17: Wind Power Market, Australia, Deal Volume vs. Deal Value ($M), 2015–2023

Table 18: Wind Power Market, Australia, Deals by Type, 2023

Table 19: Wind Turbine Market, Australia, Annual Installed Capacity (GW), 2015-2028

Table 20: Wind Turbine Market, Australia, Market Size ($M), 2015-2028

Table 21: Policy Snapshot, Australia, 2023

Table 22: New Large-scale Renewable Energy Target, Annual Targets, Australia (TWh), 2015–2030

Table 23: HyGATE program

Table 24: Time-Varying Minimum FiTs, 2023-24

Table 25: Tasmanian Renewable Hydrogen Action plan Targets

Table 26: Renewable Energy Reverse Auction Winners, ACT, Australia

Table 27: Capacity and number of generators by tariff in 2021

Table 28: Renewable Hydrogen Strategy, Western Australia

Table 29: AGL Energy Ltd, Major Products and Services

Table 30: Iberdrola SA, Major Products and Services

Table 31: Origin Energy Ltd, Major Products and Services

Table 32: Renewable Energy Systems Holdings Ltd, Major Products and Services

Table 33: Neoen SA, Major Products and Services

Table 34: Abbreviations

Figures

List of Figures

Figure 1: Carbon Dioxide Emissions from Energy Consumption, Global, 2015–2023

Figure 2: Primary Energy Consumption, Global, 2015–2023

Figure 3: Renewable Power Market, Australia, Cumulative Installed Capacity by Source (GW), 2015-2035

Figure 4: Renewable Power Market, Australia, Cumulative Installed Capacity Share by Source (%), 2023 and 2035

Figure 5: Renewable Power Market, Australia, Net Capacity Additions by Source (GW), 2024-2035

Figure 6: Renewable Power Market, Australia, Capacity Growth by Source, 2023-2035

Figure 7: Renewable Power Market, Australia, Power Generation by Source (TWh), 2015-2035

Figure 8: Renewable Power Market, Australia, Growth in Power Generation by Source, 2023-2035

Figure 9: Wind Power Market, Australia, Installed Capacity (GW), 2015-2035

Figure 10: Wind Power Market, Australia, Cumulative Installed Capacity by Type (GW), 2015-2035

Figure 11: Wind Power Market, Australia, Power Generation (TWh), 2015-2035

Figure 12: Wind Power Market, Australia, Power Generation by Type (TWh), 2015-2035

Figure 13: Wind Power Market, Australia, Market Size ($M), 2015-2030

Figure 14: Wind Power Market, Australia, Snapshot of Upcoming Plants

Figure 15: Wind Power Market, Australia, Deal Volume vs. Deal Value ($M), 2015–2023

Figure 16: Wind Power Market, Australia, Split by Deal Type (%), 2023

Figure 17: Wind Turbine Market, Australia, Annual Installed Capacity (GW), 2015-2028

Figure 18: Wind Turbine Market, Australia, Market Size ($M), 2015-2028

Frequently asked questions

Australia Wind Power Market Analysis by Size, Installed Capacity, Power Generation, Regulations, Key Players and Forecast to 2035 standard reports
Currency USD
$995

Can be used by individual purchaser only

$1,990

Can be shared globally by unlimited users within the purchasing corporation e.g. all employees of a single company


Undecided about purchasing this report?

Enquire Before Buying Download FREE Resources

Get in touch to find out about multi-purchase discounts

reportstore@globaldata.com
Tel +44 20 7947 2745

Sample Report

Australia Wind Power Market Analysis by Size, Installed Capacity, Power Generation, Regulations, Key Players and Forecast to 2035 was curated by the best experts in the industry and we are confident about its unique quality. However, we want you to make the most beneficial decision for your business, so we offer free sample pages to help you:

  • Assess the relevance of the report
  • Evaluate the quality of the report
  • Justify the cost

Download your copy of the sample report and make an informed decision about whether the full report will provide you with the insights and information you need.

Below is a sample report to understand what you are buying

See what our customers are saying
testimonial-image
testimonial-image
testimonial-image
testimonial-image
testimonial-image
testimonial-image
testimonial-image

“The GlobalData platform is our go-to tool for intelligence services. GlobalData provides an easy way to access comprehensive intelligence data around multiple sectors, which essentially makes it a one-for-all intelligence platform, for tendering and approaching customers.

GlobalData is very customer orientated, with a high degree of personalised services, which benefits everyday use. The highly detailed project intelligence and forecast reports can be utilised across multiple departments and workflow scopes, from operational to strategic level, and often support strategic decisions. GlobalData Analytics and visualisation solutions has contributed positively when preparing management presentations and strategic papers.”

Business Intelligence & Marketing Manager, SAL Heavy Lift

“COVID-19 has caused significant interference to our business and the COVID-19 intelligence from GlobalData has helped us reach better decisions around strategy. These two highlights have helped enormously to understand the projections into the future concerning our business units, we also utilise the project database to source new projects for Liebherr-Werk to use as an additional source to pitch for new business.”

Market Analyst & Management, Liebherr-Werk

Your daily news has saved me a lot of time and keeps me up-to-date with what is happening in the market, I like that you almost always have a link to the source origin. We also use your market data in our Strategic Business Process to support our business decisions. By having everything in one place on the Intelligence Center it has saved me a lot of time versus looking on different sources, the alert function also helps with this.

Head of Key Accounts, Saab AB

Having used several other market research companies, I find that GlobalData manages to provide that ‘difficult-to-get’ market data that others can’t, as well as very diverse and complete consumer surveys.

Marketing Intelligence Manager, Portugal Foods

Our experience with GlobalData has been very good, from the platform itself to the people. I find that the analysts and the account team have a high level of customer focus and responsiveness and therefore I can always rely on. The platform is more holistic than other providers. It is convenient and almost like a one stop shop. The pricing suite is highly competitive and value for our organisation.

I like reports that inform new segments such as the analysis on generation Z, millennials, the impact of COVID 19 to our banking customers and their new channel habits. Secondly the specialist insight on affluent sector significantly increases our understanding about this group of customers. The combination of those give us depth and breadth of the evolving market.

I’m in the business of answering and helping people make decisions so with the intelligence center I can do that, effectively and efficiently. I can share quickly key insights that answer and satisfy our country stakeholders by giving them many quality studies and primary research about competitive landscape beyond the outlook of our bank. It helps me be seen as an advisory partner and that makes a big difference. A big benefit of our subscription is that no one holds the whole data and because it allows so many people, so many different parts of our organisation have access, it enables all teams to have the same level of knowledge and decision support.

Head of Customer Insight and Research, Standard Chartered

“I know that I can always rely on Globaldata’s work when I’m searching for the right consumer and market insights. I use Globaldata insights to understand the changing market & consumer landscape and help create better taste & wellbeing solutions for our customers in food, beverage and healthcare industries.

Globaldata has the right data and the reports are of very high quality compared to your competitors. Globaldata not only has overall market sizes & consumer insights on food & beverages but also provides insights at the ingredient & flavour level. That is key for B2B companies like Givaudan. This way we understand our customers’ business and also gain insight to our unique industry”

Head of Consumer Sensory Insights, Givaudan

GlobalData provides a great range of information and reports on various sectors that is highly relevant, timely, easy to access and utilise.  The reports and data dashboards help engagement with clients; they provide valuable industry and market insights that can enrich client conversations and can help in the shaping of value propositions. Moreover, using GlobalData products has helped increase my knowledge of the finance sector, the players within it, and the general threats and opportunities.

I find the consumer surveys that are carried out to be extremely beneficial and not something I have seen anywhere else. They provided an insightful view of why and which consumers take (or don’t) particular financial products. This can help shape conversations with clients to ensure they make the right strategic decisions for their business.

One of the challenges I have found is that data in the payments space is often piecemeal. With GD all of the data I need is in one place, but it also comes with additional market reports that provide useful extra context and information. Having the ability to set-up alerts on relevant movements in the industry, be it competitors or customers, and have them emailed directly to me, ensures I get early sight of industry activity and don’t have to search for news.

Senior Account Manager, TSYS
Go even deeper with GlobalData Intelligence Center

Every Company Report we produce is powered by the GlobalData Intelligence Center.

Subscribing to our intelligence platform means you can monitor developments at Australia Wind Power Market Analysis by Size, Installed Capacity, Power Generation, Regulations, Key Players and Forecast to 2035 in real time.

  • Access a live Australia Wind Power Market Analysis by Size, Installed Capacity, Power Generation, Regulations, Key Players and Forecast to 2035 dashboard for 12 months, with up-to-the-minute insights.
  • Fuel your decision making with real-time deal coverage and media activity.
  • Turn insights on financials, deals, products and pipelines into powerful agents of commercial advantage.