Automotive Aftermarket Size, Trends and Analysis by Region, Component, Product Family, Channel and Segment Forecast to 2028
Powered by ![]()
Access in-depth insight and stay ahead of the market

Accessing the in-depth insights from the ‘Automotive Aftermarket’ report can help:
- Gain a valuable understanding of the current and future state of the market, allowing businesses to make informed decisions about market entry, product development, and investments.
- Identify competitors’ capabilities to stay ahead in the market.
- Identify segments and get an understanding of various stakeholders across different stages of the entire value chain.
- Anticipate changes in demand and adjust the business development strategies.
- Identify potential regions and countries for growth opportunities.
How is our ‘Automotive Aftermarket’ report different from other reports in the market?
- The report presents in-depth market sizing and forecasts at a segment level for more than 20 countries, including historical and forecast analysis for the period 2019-28 for market assessment.
- Detailed segmentation by:
- Component (volume in million units) – Oil, Windscreen Wash, Oil Filters, Brake Pads, Antifreeze or Coolant, Tires, Windscreen Wiper Blades, Spark Plugs, Air Filters, Cabin Filters, and Others
- Component (value in $Million) – Tires, Brake Pads, Windscreen Wash, Oil, Oil Filters, Antifreeze or Coolant, Windscreen Wiper Blades, Air Filters, Cabin Filters, Spark Plugs, and Others
- Product Family (value in $Million) – Wear & Tear, Service, Tires, Consumables, Crash Repair, Mechanical, and Accessories
- Channel (value in $Million) – Garages, Vehicle Manufacturer Networks, Autocentres, Tire Specialists, Parts Accessories, Online Sales, Hypermarkets, Petrol Stations, Fast Fits, Crash Repair Centres/Bodyshops, and Others
- Region (value in $Billion) – North America, Western Europe, Eastern Europe, Asia-Pacific, and the Rest of the World
- The report covers key market drivers and challenges impacting the automotive aftermarket.
- The report covers dashboard analytics for M&A deals, venture financing/private equity deals, job activity, and patent activities.
- The value chain in the report can help identify key companies involved in each stage of the production or service delivery process. This helps in understanding the competitive landscape and identifying potential collaboration opportunities.
- The report covers competitive profiling of key companies in the market to provide a deeper understanding of industry competition.
- The report can be a valuable tool for stakeholders to improve their operations, increase customer satisfaction, and maximize profitability by analyzing the latest automotive aftermarket trends, tracking market growth and demand, and evaluating the existing competition in the market.
We recommend this valuable source of information to:
- Auto Component Manufacturers
- Automotive OEMs
- Contract Manufacturers
- Tier-1 Suppliers
- Consulting & Professional Services Firms
- Venture Capital/Equity Firms/Investment Firms
Get a Snapshot of the Automotive Aftermarket, Download a Free Report Sample
Automotive Aftermarket Report Overview
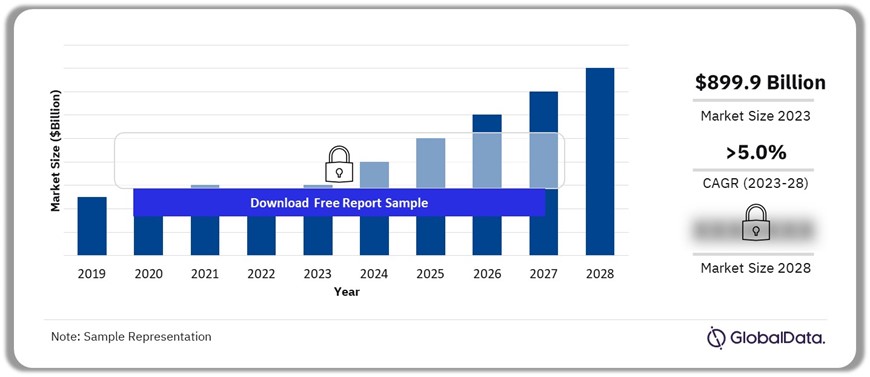
The automotive aftermarket size revenue was valued at $899.9 billion in 2023 and is expected to grow at a compound annual growth rate (CAGR) of more than 5% over the forecast period. The market growth is expected to be fueled by the shift to electric vehicles (EVs), the widespread adoption of advanced driver-assistance systems (ADAS) in vehicles, increasing e-commerce activity, and the popularity of shared mobility services. Additionally, regulatory requirements aimed at enhancing safety and environmental standards are escalating demand for products within the auto aftermarket sector.
The widespread adoption of online marketplaces and e-commerce platforms has significantly enhanced consumers’ access to aftermarket products and services. These platforms present a wide selection of offerings, ranging from specialized parts to professional services. This accessibility has leveled the playing field in the aftermarket industry, enabling vehicle owners to research and purchase products at their convenience, regardless of location or time. Additionally, online platforms streamline the process of comparing prices and features, empowering consumers to make well-informed decisions.
Automotive Aftermarket Outlook, 2019-2028 ($Billion)
Buy the Full Report for Additional Insights on the Automotive Aftermarket Forecast
Furthermore, the expansion of shared mobility services such as ridesharing and car-sharing platforms is influencing urban transportation patterns, particularly in densely populated areas. The high usage of vehicles in shared mobility services results in accelerated wear and tear, leading to increased demand for maintenance and repair services within the sector. Service providers catering to these shared vehicles need to adapt their offerings to accommodate the unique needs and usage patterns of fleet operators.
The widespread adoption of ADAS in vehicles is also driving significant changes in the sector, creating opportunities for specialized repair and calibration services, component sales, and aftermarket upgrades and enhancements. ADAS systems rely on sensors, cameras, radar, and other sophisticated technologies to operate effectively, and any misalignment or malfunction could compromise their performance and safety. Consequently, specialized repair and calibration services for ADAS components are becoming increasingly important within the sector.
Moreover, the demand for aftermarket services in the automotive industry is increasingly influenced by regulatory compliance requirements. Both automakers and vehicle owners are obligated to follow a range of safety, emissions, and other legal regulations. As these regulations become stricter or change, the need for aftermarket services increases. For example, government-mandated emissions standards frequently mandate regular vehicle inspections and maintenance to uphold environmental standards. Consequently, there is a rising need for aftermarket services such as emission testing, catalytic converter replacements, and engine tune-ups to ensure vehicles remain compliant.
| Market Size (2023) | $899.9 billion |
| CAGR (2023 to 2028) | >5% |
| Forecast Period | 2023-2028 |
| Historic Data | 2019-2022 |
| Report Scope & Coverage | Revenue Forecast, Volume Forecast, Value Chain, Company Landscape, Market Drivers |
| Component Segment
(in volume) |
Oil, Windscreen Wash, Oil Filters, Brake Pads, Antifreeze or Coolant, Tires, Windscreen Wiper Blades, Spark Plugs, Air Filters, Cabin Filters, and Others |
| Component Segment
(in value) |
Tires, Brake Pads, Windscreen Wash, Oil, Oil Filters, Antifreeze or Coolant, Windscreen Wiper Blades, Air Filters, Cabin Filters, Spark Plugs, and Others |
| Product Family Segment | Wear & Tear, Service, Tires, Consumables, Crash Repair, Mechanical, and Accessories |
| Channel Segment | Garages, Vehicle Manufacturer Networks, Autocentres, Tire Specialists, Parts Accessories, Online Sales, Hypermarkets, Petrol Stations, Fast Fits, Crash Repair Centres/Bodyshops, and Others |
| Geographies | North America, Western Europe, Asia-Pacific, Eastern Europe, and the Rest of the World |
| Countries | US, Canada, Mexico, UK, Germany, France, Italy, Spain, China, India, Japan, Indonesia, South Korea, Russia, Turkey, Greece, Poland, Czech Republic, Brazil, Argentina, and South Africa |
| Key Companies | AGC Inc., Aisin Corp., BorgWarner Inc., Bridgestone Corp., Corning Inc., Denso Corp., Shell plc, Valeo SA, Forvia SE, and Compagnie Generale des Etablissements Michelin |
| Enquire & Decide | Discover the perfect solution for your business needs. Enquire now and let us help you make an informed decision before making a purchase. |
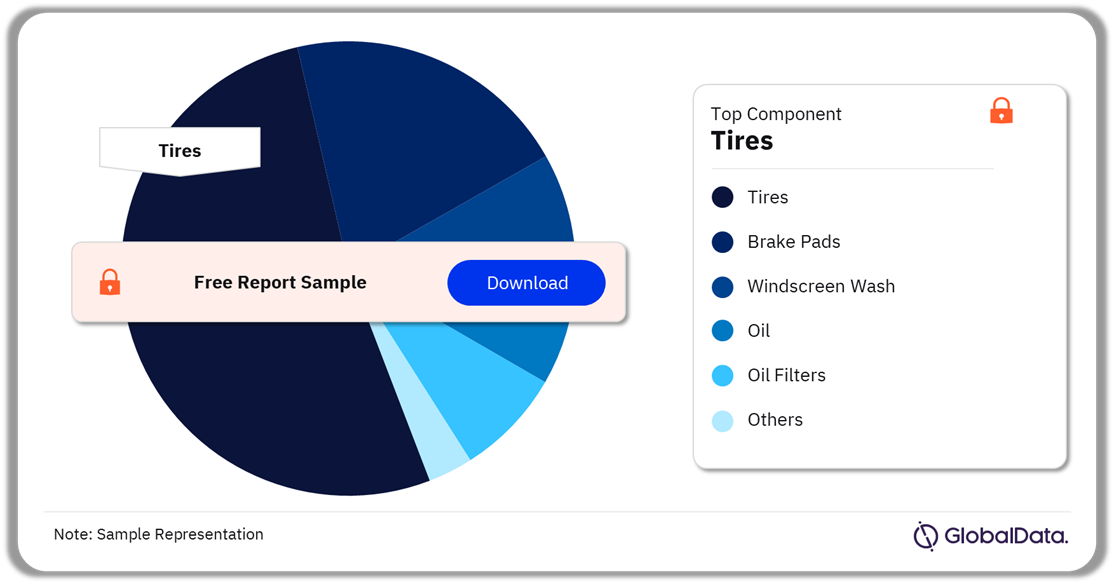
Automotive Aftermarket Segmentation by Component
Based on components, the market is categorized into tires, brake pads, windscreen wash, oil, oil filters, antifreeze or coolant, windscreen wiper blades, air filters, cabin filters, spark plugs, and others. In terms of value, tires play a significant role in the aftermarket, with their forecasted revenue contribution expected to be more than 12% in 2023. The increasing number of vehicles on the road, coupled with longer average vehicle lifespans, drives the demand for replacement tires.
In addition, oils (engine or motor oil) are being positioned to secure a substantial market share in terms of units sold, aiming for more than 25% of total sales in 2023. These are commonly sold aftermarket components through a range of channels such as garages, online retailers, auto centers, petrol stations, and even some hypermarkets or convenience stores. Additionally, there is a growing emphasis on environmentally friendly and sustainable oil options, reflecting broader trends in the automotive industry.
Automotive Aftermarket Analysis by Component, 2023 (%)
Buy the Full Report for More Information on Automotive Aftermarket by Component
In addition, filters such as oil filters, air filters, and cabin filters are also a significant component in the aftermarket sales for automobiles. These filters offer a range of benefits, including improved engine performance, better fuel efficiency, and enhanced air quality within the vehicle cabin. Many car enthusiasts and do-it-yourself (DIY) mechanics often opt for aftermarket filters to customize their vehicles or to replace worn-out factory-installed filters.
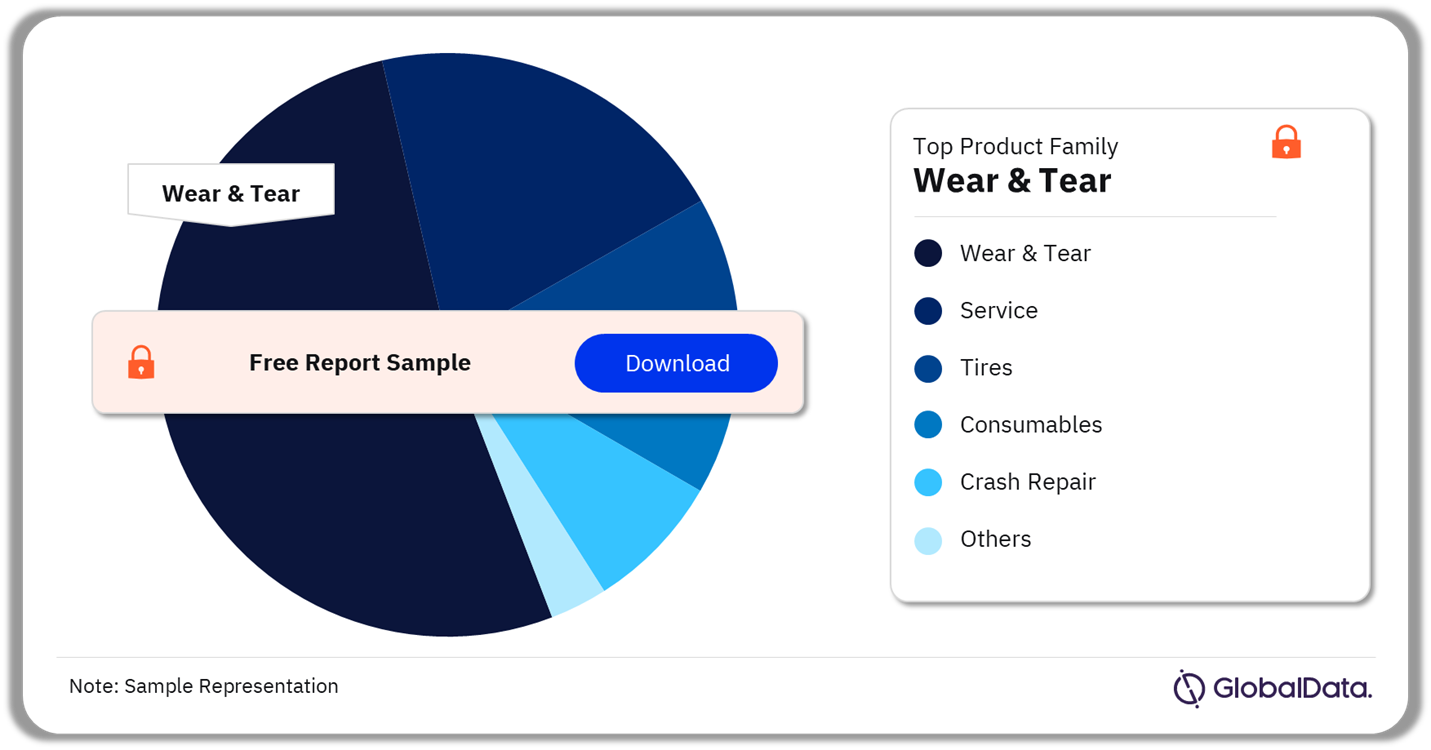
Automotive Aftermarket Segmentation by Product Family
The product family segment includes wear & tear, service, tires, consumables, crash repair, mechanical, and accessories. The forecast predicts that wear and tear parts will retain the largest market share, comprising more than 30% of the total global share. These parts are essential for the vehicle’s functionality and safety but need periodic replacement due to wear caused by friction, heat, or other factors.
Service parts are an integral aspect of the automotive aftermarket. These parts are essential for routine maintenance, repairs, and servicing of vehicles to ensure their optimal performance and durability. These encompass a wide range of components, including air filters, diesel filters, cabin filters, glow plugs, engine oil, spark plugs, and various other filters. Like wear and tear parts, service parts evolve alongside advancements in automotive technology. For example, advancements in filtration technology led to more efficient filters with better contaminant removal capabilities, contributing to improved engine performance.
Automotive Aftermarket Analysis by Product Family, 2023 (%)
Buy the Full Report for More Information on Automotive Aftermarket – By Product Family
Furthermore, tires play a crucial role in the auto aftermarket, experiencing consistent demand for replacements and maintenance services. They are retailed through diverse channels, which also provide essential tire maintenance services like rotation, balancing, alignment, and TPMS diagnostics. These services not only enhance tire performance and lifespan but also contribute significantly to the automotive aftermarket.
Automotive Aftermarket Segmentation by Channel
The distribution landscape encompasses various channels, including garages, vehicle manufacturer networks, auto centers, tire specialists, parts accessories outlets, and online sales platforms, among others. By 2023, garages are projected to capture a substantial market share, surpassing 25%. Moreover, this segment is expected to experience steady growth, with an anticipated compound annual growth rate (CAGR) exceeding 5% during the forecast period.
Garages are a pivotal component of the automotive aftermarket ecosystem, serving as hubs where vehicle maintenance, repairs, and customization take place. Their significance underscores the importance of understanding how the aftermarket is segmented by distribution channels, which directly impacts garages’ access to parts, tools, and services.
Automotive Aftermarket Share by Channel, 2023 (%)

Buy the Full Report for More Information on Automotive Aftermarket – By Channel
Furthermore, autocenters also play a significant role as a distribution channel. These establishments serve as centralized hubs for vehicle maintenance, repairs, and related services, offering consumers a convenient and specialized destination for their automotive needs. Autocenters typically provide a wide range of products and services, including parts, accessories, diagnostics, and mechanical repairs, catering to both individual vehicle owners and commercial clients. By offering comprehensive solutions under one roof, auto centers contribute to the efficient distribution of aftermarket goods and services, enhancing accessibility and customer satisfaction within the automotive ecosystem.
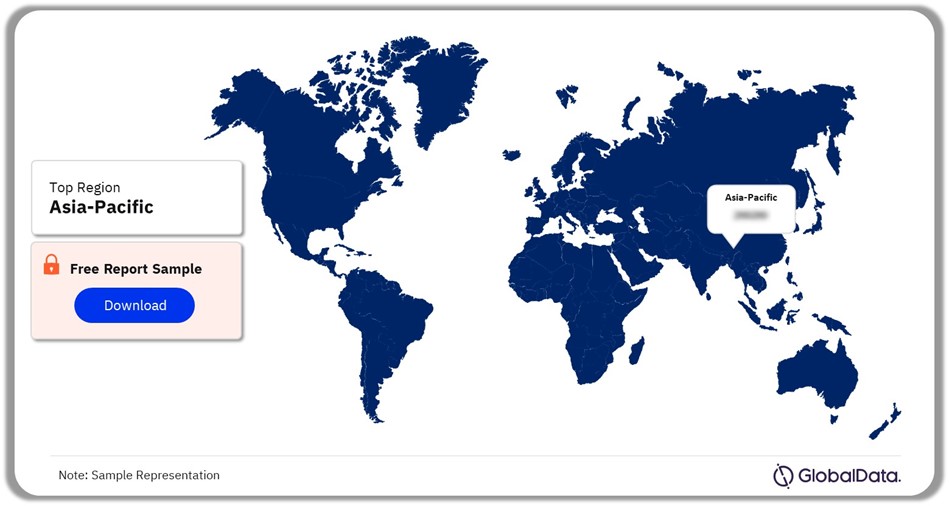
Automotive Aftermarket Analysis by Region
Asia-Pacific’s market share was the highest in 2023, capturing over 30% of the overall market size. China and Japan led the regional market, collectively accounting for over 70% of the regional market in 2023. Both countries boast large automotive manufacturing sectors, with a robust domestic market and a growing demand for aftermarket products and services. In addition, these countries are also witnessing shifts in consumer preferences towards electric and hybrid vehicles, as well as increasing emphasis on vehicle customization and personalization, which further stimulate aftermarket demand.
Both North America and Western Europe are witnessing slow growth, with a CAGR not exceeding 3% throughout the forecast period. This could be attributed to market saturation, changing consumer behaviors, increased competition, and economic challenges within these regions. Additionally, factors such as advancements in vehicle technology leading to longer-lasting parts and shifts towards electric vehicles (EVs) also contribute to this sluggish growth.
Automotive Aftermarket Share by Region, 2023 (%)
Buy the Full Report for Regional Insights into the Automotive Aftermarket
The growth of the automotive aftermarket in Eastern Europe is a significant trend. Many countries in Eastern Europe have an aging vehicle fleet, which requires regular maintenance and replacement of parts. This creates a steady demand for aftermarket products such as replacement parts, accessories, and maintenance services.
Automotive Aftermarket – Competitive Landscape
The industry is highly competitive. Established giants such as AutoZone, Advance Auto Parts, and O’Reilly Auto Parts continuously innovate their product offerings and service models to maintain their competitive edge. Moreover, the rise of e-commerce platforms has intensified competition, with online retailers such as Amazon and eBay expanding their presence, leveraging vast product selections, and streamlined purchasing experiences to attract consumers.
Strategic collaborations and acquisitions are vital for a competitive advantage. For instance, Sime Darby Bhd’s latest acquisition of a majority stake in UMW Holdings Sdn Bhd in Malaysia bolsters its product portfolio and strengthens its regional presence. Furthermore, forging partnerships with local automotive OEMs and wholesale distributors is increasingly essential for expanding market reach and improving customer accessibility. A good illustration is Lucas Oil’s recent expansion into the Brazilian market through a strategic alliance with Comercial Lucar, the largest wholesale distributor of lubricants and filters in the country. This move underscores Lucas Oil’s commitment to delivering high-quality automotive products to Brazilian customers while leveraging the expertise and reach of a trusted local partner.
Moreover, companies are constantly striving to innovate and introduce new products to secure a greater market share. In alignment with this trend, in March 2014, Michelin showcased their pioneering approach by introducing a revolutionary tire for the 2024 MotoE World Championship. These new tires, made from over 50% renewable or recycled materials, signify a major step towards a more sustainable and environmentally friendly future for the sport.
Leading Companies in the Automotive Aftermarket
- AGC Inc.
- Aisin Corp.
- BorgWarner Inc.
- Bridgestone Corp.
- Corning Inc.
- Denso Corp.
- Shell plc
- Valeo SA
- Forvia SE
- Compagnie Generale des Etablissements Michelin
Other Automotive Aftermarket Vendors Mentioned
Niterra Co. Ltd., Benteler International AG, Contemporary Amperex Technology Co. Ltd., and Valeo SE, among others.
Buy the Full Report to Know More About Leading Automotive Aftermarket Companies
Automotive Aftermarket Market Segments
GlobalData Plc has segmented the automotive aftermarket report by component (both value and volume), product family, channel, and region:
Automotive Aftermarket Component Outlook (Volume, Million Units; Revenue, $Million, 2019-28)
- Oil
- Windscreen wash
- Oil filters
- Brake pads
- Antifreeze or coolant
- Tires
- Windscreen wiper blades
- Spark plugs
- Air filters
- Cabin filters
- Others
Automotive Aftermarket Component Outlook (Revenue, $Million, 2019-28)
- Tires
- Brake pads
- Windscreen wash
- Oil
- Oil filters
- Antifreeze or coolant
- Windscreen wiper blades
- Air filters
- Spark plugs
- Cabin filters
- Others
Automotive Aftermarket Product Family Outlook (Revenue, $Million, 2019-28)
- Wear & Tear
- Service
- Tires
- Consumables
- Crash Repair
- Mechanical
- Accessories
Automotive Aftermarket Channel Outlook (Revenue, $Million, 2019-28)
- Garages
- Vehicle Manufacturer Networks
- Autocentres
- Tire Specialists
- Parts Accessories
- Online Sales
- Hypermarkets
- Petrol Stations
- Fast Fits
- Crash Repair Centres/Bodyshops
- Others
Automotive Aftermarket Regional Outlook (Revenue, $Million, 2019-28)
- North America
- US
- Canada
- Mexico
- Western Europe
- Germany
- UK
- Italy
- France
- Spain
- Rest of Western Europe
- Asia-Pacific
- China
- Japan
- India
- South Korea
- Indonesia
- Rest of Asia-Pacific
- Eastern Europe
- Russia
- Turkey
- Greece
- Czech Republic
- Poland
- Rest of Eastern Europe
- Rest of World
- Brazil
- Argentina
- South Africa
Scope
This report provides overview and service addressable market for automotive aftermarket.
It identifies the key trends impacting growth of the automotive aftermarket over the next 12 to 24 months.
It includes global market forecasts for the automotive aftermarket and analysis of M&A deals, VF/PE deals, patents, and hiring trends.
It contains details of M&A deals in the automotive aftermarket and challenges impacting the automotive aftermarket.
The report covers competitive profiling of key companies in the market to provide a deeper understanding of industry competition.
Key Highlights
The automotive aftermarket size revenue was valued at $899.9 billion in 2023 and is expected to grow at a compound annual growth rate (CAGR) of 5.4% over the forecast period. The market growth is expected to be fueled by the shift to electric vehicles (EVs), the widespread adoption of advanced driver-assistance systems (ADAS) in vehicles, increasing e-commerce activity, and the popularity of shared mobility services. Additionally, regulatory requirements aimed at enhancing safety and environmental standards are escalating demand for products within the auto aftermarket sector.
Reasons to Buy
• This market intelligence report offers a thorough, forward-looking analysis of the global automotive aftermarket by component (both in volume and value terms), product family, channel, region, and key drivers in a concise format to help executives build proactive and profitable growth strategies.
• Accompanying GlobalData’s forecast products, the report examines the assumptions and drivers behind ongoing and upcoming trends in the automotive aftermarket.
• The report also covers key market volume data of key components (in million units) within the automotive aftermarket.
• With more than 100 charts and tables, the report is designed for an executive-level audience, enhancing presentation quality.
• The report provides an easily digestible market assessment for decision-makers built around in-depth information gathered from key companies, which enables executives to quickly get up to speed with the current and emerging trends in automotive aftermarket.
• The broad perspective of the report coupled with comprehensive, actionable detail will help automotive OEMs, contract manufacturers, tier-1 suppliers, and other intermediaries succeed in growing the automotive aftermarket globally.
Key Players
AGC Inc.Aisin Corp.
BorgWarner Inc.
Bridgestone Corp.
Corning Inc.
Denso Corp.
Shell plc
Valeo SA
Forvia SE
Compagnie Generale des Etablissements Michelin
Table of Contents
Table
Figures
Frequently asked questions
-
What was the automotive aftermarket size in 2023?
The automotive aftermarket market size was valued at $899.9 billion in 2023.
-
What is the automotive aftermarket growth rate?
The automotive aftermarket is expected to grow at a CAGR of 5.4% during the forecast period.
-
What are the key automotive aftermarket market drivers?
The key factors influencing the automotive aftermarket comprise the transition to electric vehicles (EVs), the use of advanced driver-assistance systems (ADAS) in vehicles, growing e-commerce, a rise in shared mobility, and increasing regulatory push.
-
Which was the leading component segment in the automotive aftermarket in 2023?
In terms of volume, oils accounted for the largest automotive aftermarket component market share in 2023.
-
Which was the leading product family in the automotive aftermarket in 2023?
Wear & Tear Parts was the leading product family with the largest market share in the automotive aftermarket in 2023.
-
What was the leading channel in the automotive aftermarket in 2023?
Garages held the largest market share among automotive aftermarket channels in 2023.
-
Which was the leading regional market in the automotive aftermarket in 2023?
Asia-Pacific accounted for the largest automotive aftermarket regional market share in 2023.
-
Which are the leading automotive aftermarket companies globally?
The leading automotive aftermarket companies are AGC Inc., Aisin Corp., BorgWarner Inc., Bridgestone Corp., Corning Inc., Denso Corp., Shell plc, Valeo SA, Forvia SE, and Compagnie Generale des Etablissements Michelin.
-
Is there a third level of segmentation in the report?
GlobalData’s focus is on providing reliable and accurate data that is supported by robust research methodology. Our reports undergo rigorous quality checks and are based on primary and secondary research sources, ensuring that the numbers and insights provided are trustworthy. However, despite the best efforts to gather comprehensive data, there could be instances where the available data is limited, making it challenging to provide third-level segmentation. In such cases, GlobalData may choose to provide high-level insights and general trends rather than forcing segmentation that may not be backed by sufficient data. This approach ensures that the report’s overall quality and credibility are maintained.
Get in touch to find out about multi-purchase discounts
reportstore@globaldata.com
Tel +44 20 7947 2745
Every customer’s requirement is unique. With over 220,000 construction projects tracked, we can create a tailored dataset for you based on the types of projects you are looking for. Please get in touch with your specific requirements and we can send you a quote.
Sample Report
We are confident about Automotive Aftermarket Size, Trends and Analysis by Region, Component, Product Family, Channel and Segment Forecast to 2028 report's unique quality. However, we want you to make the most beneficial decision for your business, so we offer free sample pages to help you:
- Assess the relevance of the report
- Evaluate the quality of the report
- Justify the cost
Download your copy of the sample report and make an informed decision about whether the full report will provide you with the insights and information you need.


