Construction Market Size, Trends and Growth Forecasts by Regions and Countries, 2023-2027

Pages: 87 Published: June 30, 2023 Report Code: GDCN0032GO

Accessing in-depth insights from the ‘Construction Market’ report will give you:

  • An overview of the global construction industry to 2027.
  • Detailed outlook of the major regions: North America, Latin America, Western Europe, Eastern Europe, South Asia, South-East Asia, North-East Asia, Australasia, the Middle East and North Africa, and Sub-Saharan Africa.
  • Analysis of the latest data on construction output trends in emerging markets and advanced economies.
  • A comprehensive benchmarking of 91 leading construction markets according to construction market value and growth.

How is the ‘Construction Market’ report different from other reports in the market?

  • Evaluate regional construction trends from insight on output values and forecast data to 2027.
  • Identify the fastest growers to enable assessment and targeting of commercial opportunities in the markets best suited to strategic focus.
  • Identify the drivers in the global construction market and consider growth in emerging and developed economies. Formulate plans on where and how to engage with the market while minimizing any negative impact on revenues.
  • The construction output value is provided across the key sectors, namely Commercial, Energy and Utilities, Industrial, Infrastructure, Institutional, and Residential

We recommend this valuable source of information to anyone involved in:

  • Contractors Including Civil Works, Electrical, HVAC, and Others
  • Consultants/Designers
  • Building Material Merchants/Players
  • Construction Equipment Suppliers
  • Management Consultants and Investment Banks
  • Portfolio Managers/Buy-side Firms
  • Insurance Companies

To get a snapshot of the construction market report, download a free report sample

Construction Market Overview

The global construction industry will record a marked slowdown in output in real terms (constant prices) in 2023. The deceleration reflects the challenging conditions in most markets around the world in the form of high inflation and a tightening in monetary policy that has dampened investment.

This construction industry report provides a detailed analysis of the prospects for the global construction industry up to 2027. The report also covers the regional outlook with a country-wise overview and crucial updates from different construction sectors.

Key Segments ·       Residential Construction

·       Commercial Construction

·       Industrial Construction

·       Infrastructure

·       Energy and Utilities

Key Regions ·       North-East Asia

·       South-East Asia

·       South Asia

·       Australasia

·       Middle East and North Africa

·       Sub-Saharan Africa

·       US and Canada

·       Latin America

·       Western Europe

·       Eastern Europe and Central Asia

Enquire & Decide Discover the perfect solution for your business needs. Enquire now and let us help you make an informed decision before making a purchase.

For more insights on the construction industry forecasts, download a free sample report

Construction Market Segments

The key segments in the construction industry are residential construction, commercial construction, industrial construction, infrastructure, and energy and utilities construction.

Residential Construction: Globally, 2023 prediction reflects ongoing weakness in the US economy since last year. Additionally, many European markets have witnessed a sharp drop in residential building permits, due to high-interest rates and construction costs are taking a toll on new investment. Globally, residential construction had recovered well from the downturn in 2020 amid the disruption caused by the pandemic. This can be attributed to the growing government incentive schemes and a build-up of household savings helping to drive up residential building work, particularly on the renovation side to improve energy efficiency.

Industrial Construction: Industrial construction has also been recovering from the COVID-19-induced downturn in 2020. The rising global demand for manufactured products provided ample scope for renewed investment in manufacturing plants to improve capacity. The short-term outlook will be impacted by weaker investor confidence, but the expansion in “nearshoring” to minimize future risks to supply chain networks spread across the world is likely to support investment in new facilities in various sectors in open emerging markets. Furthermore, there has also been significant investment in manufacturing plants to produce Electric Vehicles (EVs) and components.

For more segment insights into the construction industry, download a free sample report

Construction Market Segmentation by Regions

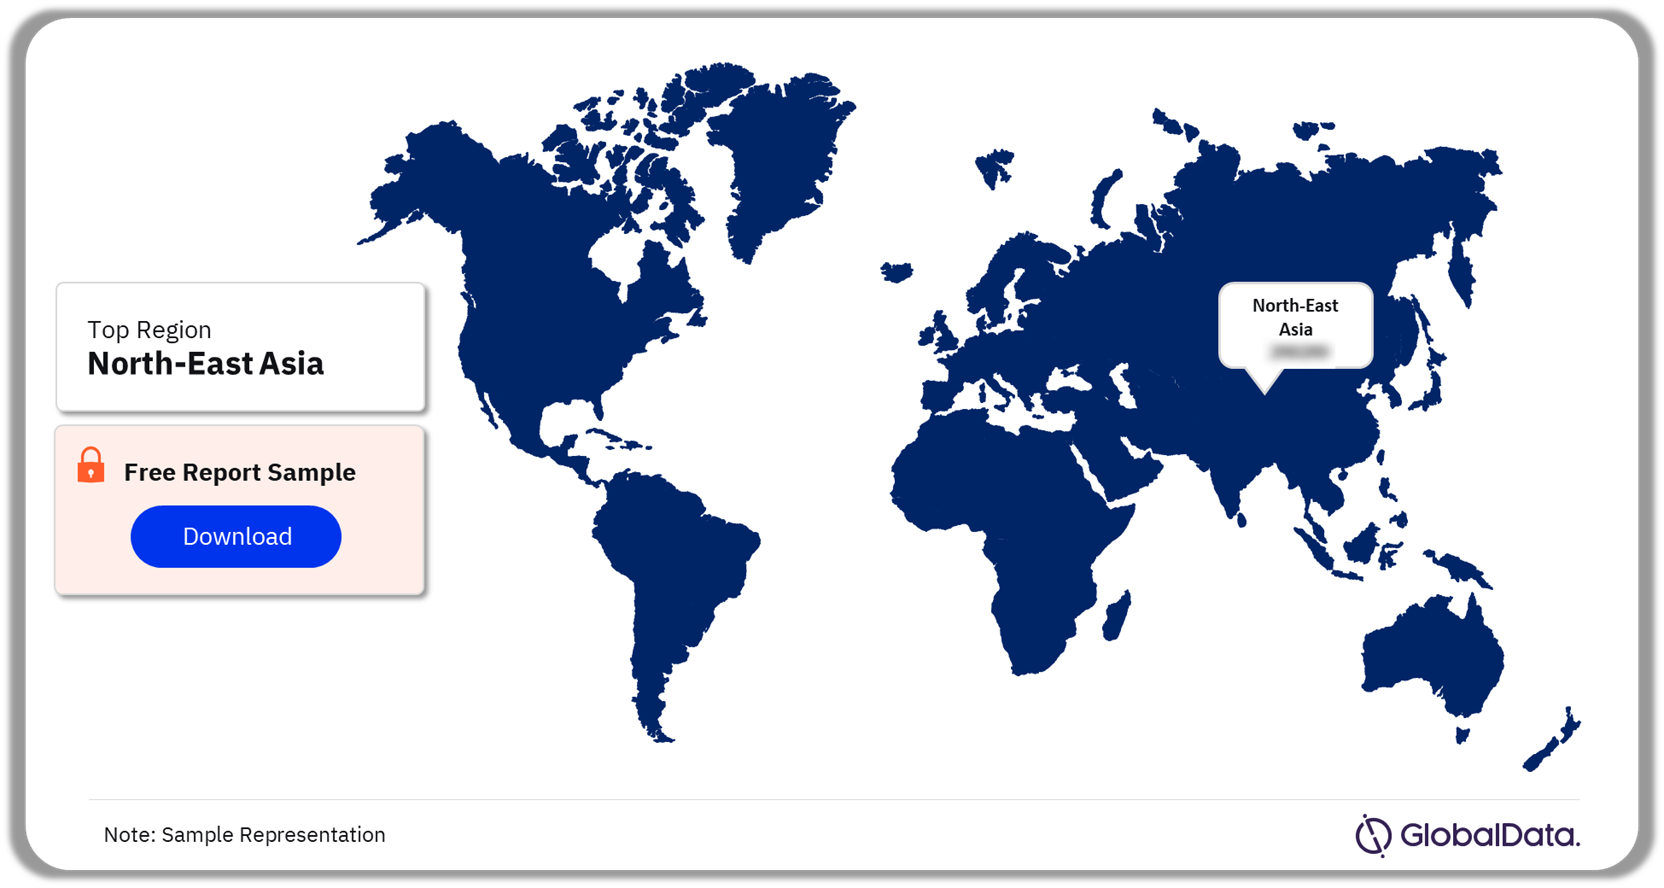
The key regions in the construction market are North-East Asia, South-East Asia, South Asia, Australasia, Middle East and North Africa, Sub-Saharan Africa, US and Canada, Latin America, Western Europe, and Eastern Europe and Central Asia. A substantial public infrastructure investment in China saw construction output in North-East Asia strengthen in the first quarter of this year, due to this GlobalData expects construction output in North-East Asia in 2023 to rise. This change has been made primarily due to a strengthening of construction activity in China. Construction activity in China remained robust in the first quarter of this year, as significant government infrastructure investment began to take shape. Through this year, construction activity in China will be primarily driven by public infrastructure works.

Construction Market Analysis by Regions, 2023 (%)

Construction Market Analysis by Regions, 2023 (%)

For more regional insights on the global construction market, download a free sample

Segments Covered in the Report

Global Construction Market Segments Outlook (Value, $ Billion, 2019-2027)

  • Residential Construction
  • Commercial Construction
  • Industrial Construction
  • Infrastructure
  • Energy and Utilities

Global Construction Market Regions Outlook (Value, $ Billion, 2019-2027)

  • North-East Asia
  • South-East Asia
  • South Asia
  • Australasia
  • Middle East and North Africa
  • Sub-Saharan Africa
  • North America
  • Latin America
  • Western Europe
  • Eastern Europe

Table of Contents

  • 1 Global Outlook
  • 2 Regional Outlook: US and Canada

    • 2.1 Overview
    • 2.2 Key Updates

  • 3 Regional Outlook: Latin America

    • 3.1 Overview
    • 3.2 Key Updates

  • 4 9Regional Outlook: Western Europe

    • 4.1 Overview
    • 4.2 Key Updates

  • 5 Regional Outlook: Eastern Europe and Central Asia

    • 5.1 Overview
    • 5.2 Key Updates

  • 6 Regional Outlook: South-East Asia

    • 6.1 Overview
    • 6.2 Key Updates

  • 7 Regional Outlook: South Asia

    • 7.1 Overview
    • 7.2 Key Updates

  • 8 Regional Outlook: Australasia

    • 8.1 Overview
    • 8.2 Key Updates

  • 9 Regional Outlook: North-East Asia

    • 9.1 Overview
    • 9.2 Key Updates

  • 10 Regional Outlook: Middle East and North Africa

    • 10.1 Overview
    • 10.2 Key Updates

  • 11 Regional Outlook: Sub-Saharan Africa

    • 11.1 Overview
    • 11.2 Key Updates

  • 12 About GlobalData
  • 13 Contact Us

List of Tables

Table 1: Global Construction Output Growth (Real, % Change), 2020–2027

Table 2: North America, Construction Output Value (Real, $ 2017 Billion), 2017–2027

Table 3: Latin America, Construction Output Value (Real, $ 2017 Billion), 2017–2027

Table 4: Middle East and North Africa, Construction Output Value (Real, $ 2017 Billion), 2017–2027

Table 5: Sub-Saharan Africa, Construction Output Value (Real, $ 2017 Billion), 2017–2027

Table 6: South-East Asia, Construction Output Value (Real, $ 2017 Billion), 2017–2027

Table 7: South Asia, Construction Output Value (Real, $ 2017 Billion), 2017–2027

Table 8: North-East Asia, Construction Output Value (Real, $ 2017 Billion), 2017–2027

Table 9: Australasia, Construction Output Value (Real, $ 2017 Billion), 2017–2027

Table 10: Western Europe, Construction Output Value (Real, $ 2017 Billion), 2017–2027

Table 11: Eastern Europe, Construction Output Value (Real, $ 2017 Billion), 2017–2027

Table 12: US and Canada, Construction Output Growth (Real, % Change)

Table 13: Latin America, Construction Output Growth (Real, % Change)

Table 14: Western Europe, Construction Output Growth (Real, % Change)

Table 15: Eastern Europe and Central Asia, Construction Output Growth (Real, % Change)

Table 16: South-East Asia, Construction Output Growth (Real, % Change)

Table 17: South Asia, Construction Output Growth (Real, % Change)

Table 18: Australasia, Construction Output Growth (Real, % Change)

Table 19: North-East Asia, Construction Output Growth (Real, % Change)

Table 20: Middle East and North Africa, Construction Output Growth (Real, % Change)

Table 21: Sub-Saharan Africa, Construction Output Growth (Real, % Change)

List of Figures

Figure 1: Global Construction Output Value by Sector (Real, Index 2019=100), 2019–2027

Figure 2: Global Construction Output Value by Region (Real, 2017 $ Billion), 2019–2027

Figure 3: US and Canada, Construction Output Value (Real, $ 2017 Billion)

Figure 4: The US, Construction Output (% change), Seasonally Adjusted in Nominal and Real Terms

Figure 5: The US, Construction Put in Place ($ Million, Nominal) Seasonally Adjusted Annual Rate

Figure 6: Canada, Construction Value-Add (CAD Million, 2012 Constant Prices), Quarterly Average, Seasonally Adjusted at Annual Rates

Figure 7: Latin America, Construction Output Value (Real, $ 2017 Billion)

Figure 8: Brazil, Construction Value-Add (BRL Billion, Seasonally Adjusted Chained 1995 Prices)

Figure 9: Mexico, Construction Value-add (2013 Prices, MXN Billion)

Figure 10: Argentina, Construction Value Add (ARS Million, 2004 Constant Prices)

Figure 11: Western Europe, Construction Output Value (Real, $ 2017 Billion)

Figure 12: Germany, Construction Value-Add (Chain Volume, EUR Million, Seasonally Adjusted)

Figure 13: Spain, Construction Value-Add (Chain Volume, EUR Million, Seasonally Adjusted)

Figure 14: France, Construction Value-Add (Chain Volume, EUR Million, Seasonally Adjusted)

Figure 15: Italy, Construction Value-Add (Chain Volume, EUR Million, Seasonally Adjusted)

Figure 16: UK, Construction Output Volume (Chain Volume Seasonally Adjusted, GBP Million)

Figure 17: Eastern Europe and Central Asia, Construction Output Value (Real, $ 2017 Billion)

Figure 18: Turkey, Construction Value Add (TKR Million, 2015 Chained Prices, Seasonally Adjusted)

Figure 19: Russia, Construction Activity Volume Index

Figure 20: Poland, Construction Value Add (PLN Million, 2015 Chained Prices, Seasonally Adjusted)

Figure 21: Czech Republic, Construction Value Add (CZK Million, 2015 Chained Prices, Seasonally Adjusted)

Figure 22: Hungary, Construction Value Add (HUF Million, 2015 Chained Prices, Seasonally Adjusted)

Figure 23: Romania, Construction Value Add (RON Million, 2015 Chained Prices, Seasonally Adjusted)

Figure 24: South and South-East Asia, Construction Output Value (Real, $ 2017 Billion)

Figure 25: Indonesia, Construction Value-Add (IDR Billion, 2010 Prices, Seasonally Adjusted)

Figure 26: Thailand, Construction Value-Add (THB Million, Seasonally Adjusted Chained Volume Measures)

Figure 27: Singapore, Construction Value-Add (SGD million, 2015 Chained Prices, Seasonally Adjusted)

Figure 28: Malaysia, Construction Value-Add (MYR Million, 2015 Prices, Seasonally Adjusted)

Figure 29: Philippines, Construction Value-Add (PHP Billion, 2018 Prices)

Figure 30: South Asia, Construction Output Value (Real, $ 2017 Billion)

Figure 31: India, Construction Value-Add (INR Billion, Constant Prices)

Figure 32: Sri Lanka, Construction Value-Add (Billion, 2015 Constant Prices)

Figure 33: Australasia, Construction Output Value (Real, $ 2017 Billion)

Figure 34: Australia, Construction Work Done (AUD Million, Chained 2018 Prices, Seasonally Adjusted)

Figure 35: Australia, Construction Value Add (Million AUD, Chained Volume Measures, 2018-19 Prices)

Figure 36: Australia, Building Approvals (Million AUD, Seasonally Adjusted, Chain Volume, 2018-19 Prices)

Figure 37: New Zealand, Volume of Building Work Put in Place, Million NZD, Seasonally Adjusted, 1999 Prices

Figure 38: New Zealand, Construction Value-add (Million NZD, Chained Volume Measures, 2009-10 Prices)

Figure 39: New Zealand, Building Consents Issued, Three-month moving average, Million NZD, (% Change YoY)

Figure 40: North-East Asia, Construction Output Value (Real, $ 2017 Billion)

Figure 41: China, Construction Value-Add Index, Constant Prices, % Change YoY

Figure 42: Japan, Construction Orders Received, JPY Billion, 3-month Moving Average

Figure 43: South Korea, Construction Value-Add (KRW Billion, 2015 Chained Prices, Seasonally Adjusted)

Figure 44: South Korea, Value of Construction Orders Received, KRW Billion, 3-month Moving Average

Figure 45: Taiwan, Construction Value-Add, TWD Million, 2016 Chained Prices

Figure 46: Hong Kong, Gross Value of Construction Work Performed, HKD Million, Seasonally Adjusted 2000 Chained Prices

Figure 47: Middle East and North Africa, Construction Output Value (Real, $ 2017 Billion)

Figure 48: Saudi Arabia, Construction Value-Add (SAR Million, Constant Prices)

Figure 49: Egypt, Construction Value Add (EGP Million, 2007 Constant Prices)

Figure 50: Sub-Saharan Africa, Construction Output Value (Real, $ 2017 Billion)

Figure 51: Nigeria, Construction Value-Add (NGN Billion, Constant Prices)

Frequently Asked Questions

North-East Asia, South-East Asia, South Asia, Australasia, Middle East and North Africa, Sub-Saharan Africa, North America, Latin America, Western Europe, and Eastern Europe are the key regions in the global construction industry.

Construction activity in North-East Asia strengthened in the first quarter of this year, and due to this, GlobalData expects construction output to increase in 2023.

Construction activity in China remained robust in the first quarter of this year, as significant government infrastructure investment began to take shape, thereby driving the North-East Asia construction market growth.

Residential construction, commercial construction, industrial construction, infrastructure, and energy and utilities construction are some of the construction market segments.

$4,950

Can be used by individual purchaser only

$14,850

Can be shared globally by unlimited users within the purchasing corporation e.g. all employees of a single company


Undecided about purchasing this report?

Enquire Before Buying Request a Free Sample

Get in touch to purchase a bespoke set of construction project profiles

reportstore@globaldata.com
Tel +44 (0) 20 7947 2960

Every customer’s requirement is unique. With over 220,000 construction projects tracked, we can create a tailored dataset for you based on the types of projects you are looking for. Please get in touch with your specific requirements and we can send you a quote.

Testimonial

“The GlobalData platform is our go-to tool for intelligence services. GlobalData provides an easy way to access comprehensive intelligence data around multiple sectors, which essentially makes it a one-for-all intelligence platform, for tendering and approaching customers.

GlobalData is very customer orientated, with a high degree of personalised services, which benefits everyday use. The highly detailed project intelligence and forecast reports can be utilised across multiple departments and workflow scopes, from operational to strategic level, and often support strategic decisions. GlobalData Analytics and visualisation solutions has contributed positively when preparing management presentations and strategic papers.”

Business Intelligence & Marketing Manager, SAL Heavy Lift

“COVID-19 has caused significant interference to our business and the COVID-19 intelligence from GlobalData has helped us reach better decisions around strategy. These two highlights have helped enormously to understand the projections into the future concerning our business units, we also utilise the project database to source new projects for Liebherr-Werk to use as an additional source to pitch for new business.”

Market Analyst & Management, Liebherr-Werk

Your daily news has saved me a lot of time and keeps me up-to-date with what is happening in the market, I like that you almost always have a link to the source origin. We also use your market data in our Strategic Business Process to support our business decisions. By having everything in one place on the Intelligence Center it has saved me a lot of time versus looking on different sources, the alert function also helps with this.

Head of Key Accounts, Saab AB

Having used several other market research companies, I find that GlobalData manages to provide that ‘difficult-to-get’ market data that others can’t, as well as very diverse and complete consumer surveys.

Marketing Intelligence Manager, Portugal Foods