Digital Payments Market Size, Share, Trends and Analysis by Region, Mode of Payment, Industry and Segment Forecast to 2030

Powered by

Access in-depth insight and stay ahead of the market

Accessing the in-depth insight from the ‘Digital Payments’ report can help you:

  • Make informed decisions about market entry, technology adoption, and consumer spending patterns
  • Identify your competitors’ capabilities to stay ahead in the market
  • Identify promising segment analysis (Mode of Payment and Industry), growth trends, regional trends, and markets to expand your regional presence, product portfolio or successful investment
  • Anticipate expected changes in demand and adjust your business development strategies

How is our ‘Digital Payments’ report different from other reports in the market?

  • The report presents in-depth market sizing and forecast at a segment level for more than 30 countries including historical and forecast analysis by transaction value and volume for the period 2020-2030 for market assessment
  • Detailed segmentation by mode of payment – digital wallet, credit card, debit card, online banking, others
  • The report highlights segmentation at industry level – retail, hospitality, entertainment, healthcare, others
  • The report offers technological and regulatory trends, along with driving and challenging factors impacting the digital payments market.
  • The growth innovation matrix included in the report, divides the market players into four categories i.e., flagbearers, contenders, specialists, and experimenters, which will help value chain participants in understanding how competition is performing based on their revenue growth and their R&D efforts
  • The report provides an analysis of M&As, venture financing deals, patent activity, social media, and jobs in the digital payment market.
  • Competitive landscape includes list of key emerging companies/technology disruptors/innovators and recent mergers & acquisitions
  • Competitive profiling and benchmarking of key players in the market to provide deeper understanding of industry competition

We recommend this valuable source of information to anyone involved in:

  • Digital Payments Company
  • Fintech Company
  • BNPL companies
  • Retail Banks
  • Ecommerce Companies
  • Online Retailers
  • Venture Capitalists
  • Investment Advisors
  • Consultancy Firms
  • Management Consultants and Analysts

To Get a Snapshot of the Digital Payments Market Report, Download a Free Report Sample

 Digital Payments Market Overview

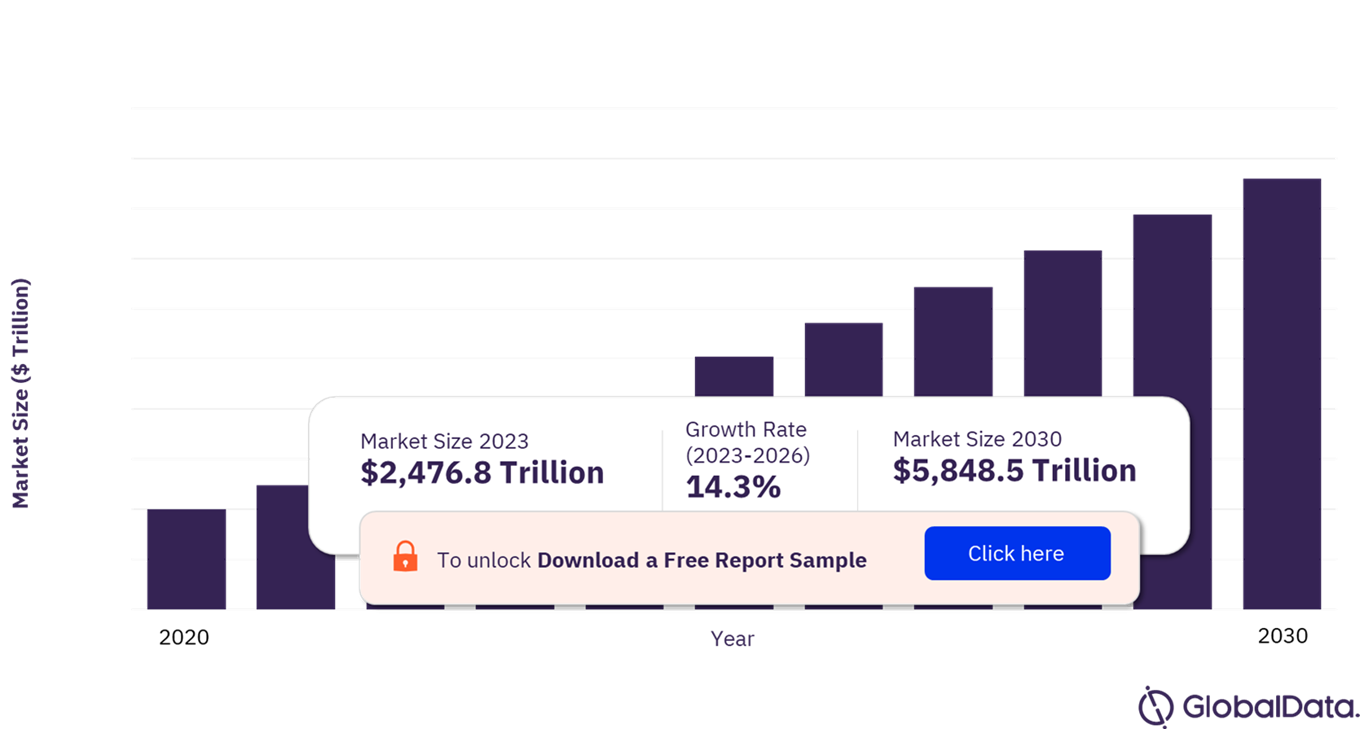
The digital payments market size will be valued at $2,476.8 trillion in 2023 and is expected to grow at a CAGR of 14.3% over the forecast period. The rise in the adoption of digital payments is expected to be propelled by a high level of convenience offered as they allow users to make transactions quickly and easily. In addition,  they eliminate the need for physical cash or checks, which can be inconvenient and time-consuming to handle.

Digital Payments Market Outlook, 2020-2030 ($ Trillion)

Digital Payments Market Outlook, 2020-2030 ($ Trillion)

View Sample Report for Additional Insights on Digital Payments Market Forecast, Download a Free Report Sample

Governments globally have been advocating and endorsing digital payments for several reasons, such as improving financial inclusion, minimizing cash usage, enhancing transparency, and promoting economic progress. For example, the Digital India campaign by the Government of India is aimed at transforming the country into a digital economy. One of the key components of this campaign is the promotion of digital payments through initiatives such as BHIM (Bharat Interface for Money), which is a mobile app based on UPI (Unified Payments Interface) that lets users make payments directly from their bank accounts.

The market faces significant challenges from lack of infrastructure and security concerns which are expected to impact growth over the forecast period. Digital payments require a reliable and fast internet connection, which is often lacking in many parts of the world. This makes it difficult for people in rural or remote areas to access digital payment platforms. Digital payments are also vulnerable to fraud, including identity theft, account takeover, and phishing attacks. Cybercriminals can steal user credentials, use malware to intercept transactions, or set up fake websites or apps to trick users into providing their personal and financial information.

Market Size by Transaction Value in 2023 $2,476.8 trillion
Market Size by Transaction Value in 2030 $5,848.5 trillion
CAGR (2023-2030) 14.3%
Forecast Period 2023-2030
Historic Data 2020-2022
Report Scope & Coverage Revenue Forecast, Competitive Index, Company Landscape, Growth Trends
Mode of Payment Digital Wallet, Credit Card, Debit Card, Online Banking, Others
Industry Retail, Hospitality, Entertainment, Healthcare, Others
Region Coverage North America, Europe, Asia Pacific, South & Central America, Middle East & Africa
Country Coverage US, Canada, UK, France, Germany, Russia, Italy, Netherlands, Belgium, Spain, Ireland, Denmark, Finland, Poland, Sweden, China, India, Japan, South Korea, Australia, Indonesia, Singapore, Malaysia, Saudi Arabia, South Africa, Turkey, Mexico, Brazil, Colombia, Argentina, Peru
Key Companies Alibaba Group Holding Ltd, American Express Co, Apple Inc, Google LLC, Mastercard Inc, PayPal Holdings Inc, Visa Inc, Discover Financial Services, ACI Worldwide Inc, Amazon.com Inc, Fiserv Inc, One97 Communications Ltd., Samsung Electronics Co Ltd, Fidelity National Information Services Inc, and The Western Union Co.

Digital Payments Market Segmentation by Mode of Payment

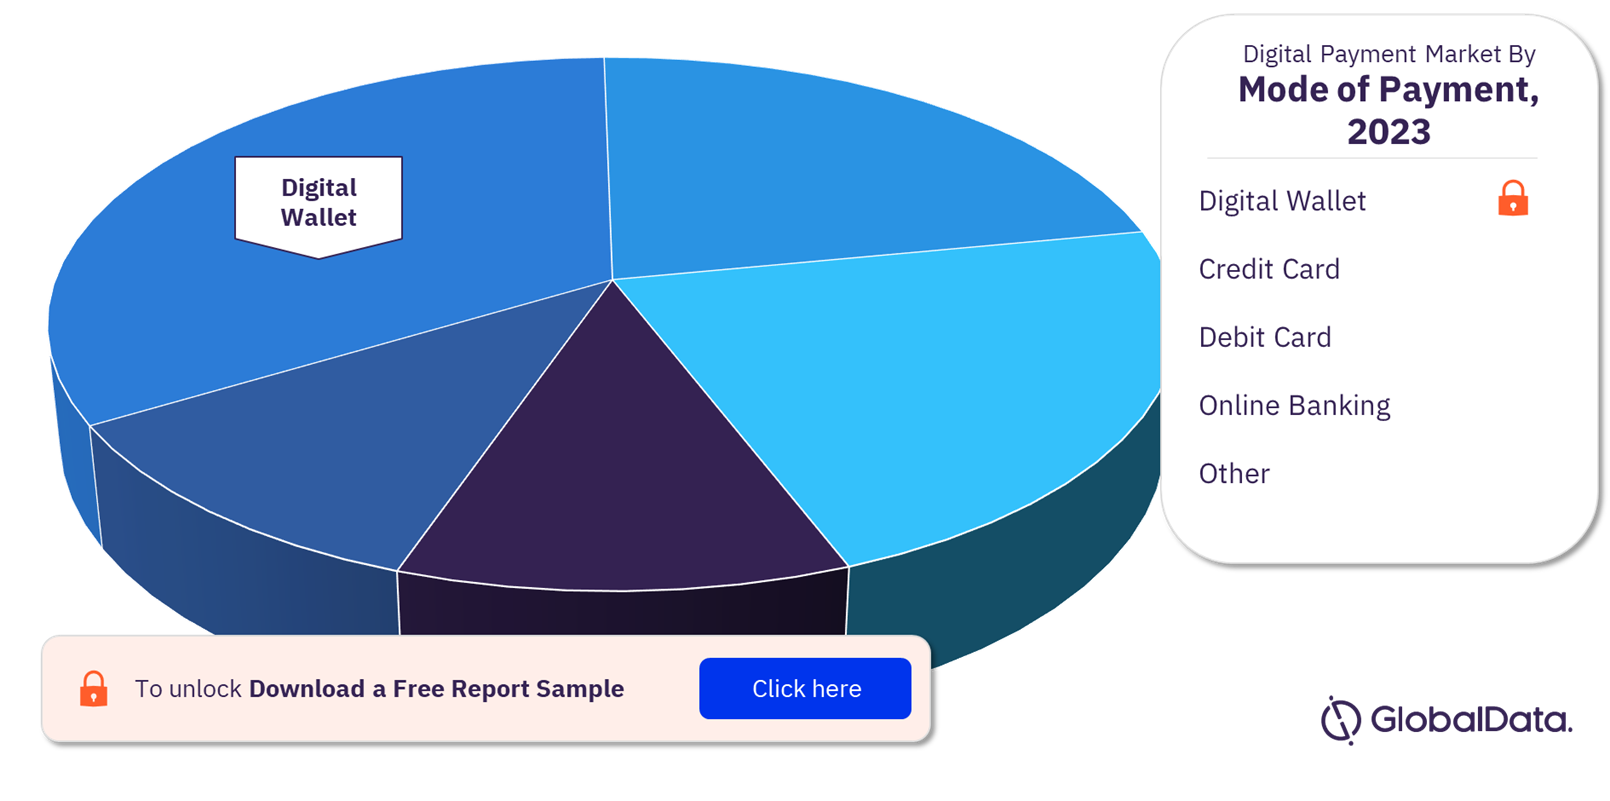
Digital payments market by mode of payment, includes digital wallets, credit cards, debit cards, online banking, and others. Digital wallets are commonly used for digital payments. They offer a convenient and secure way to make transactions online or through mobile devices and store payment information. They also provide an efficient and streamlined transaction process for digital payments by storing consumers’ debit and credit cards.

Currently, digital wallets are directly linked to cards, but they pose an indirect threat to card payments as they can be linked to users’ accounts, enabling A2A and P2P transfers through real-time payment (RTP) rails or even blockchain systems for back-end processing. This has the potential to make payment transactions more efficient and cost-effective for merchants, as they would have reduced transaction fees to pay compared to card scheme providers.

Digital Payments Market Share by Mode of Payment, 2023 (%)

Digital Payments Market Share by Mode of Payment, 2023 (%)

Fetch Sample PDF for Segment-Specific Revenues and Shares, Download a Free Report Sample

Digital payments made through credit cards have gained significant popularity as a growing number of individuals opt to make purchases online or via mobile devices. Credit cards provide numerous advantages for digital payments, such as convenience, security, and the ability to earn reward points or cashback on purchases. Credit card companies employ several security measures to safeguard against fraudulent and unauthorized transactions, with many now offering supplementary security features such as two-factor authentication, fraud alerts, and real-time transaction monitoring. Although digital payments through credit cards are convenient, there are typically associated fees such as annual fees, foreign transaction fees, or balance transfer fees.

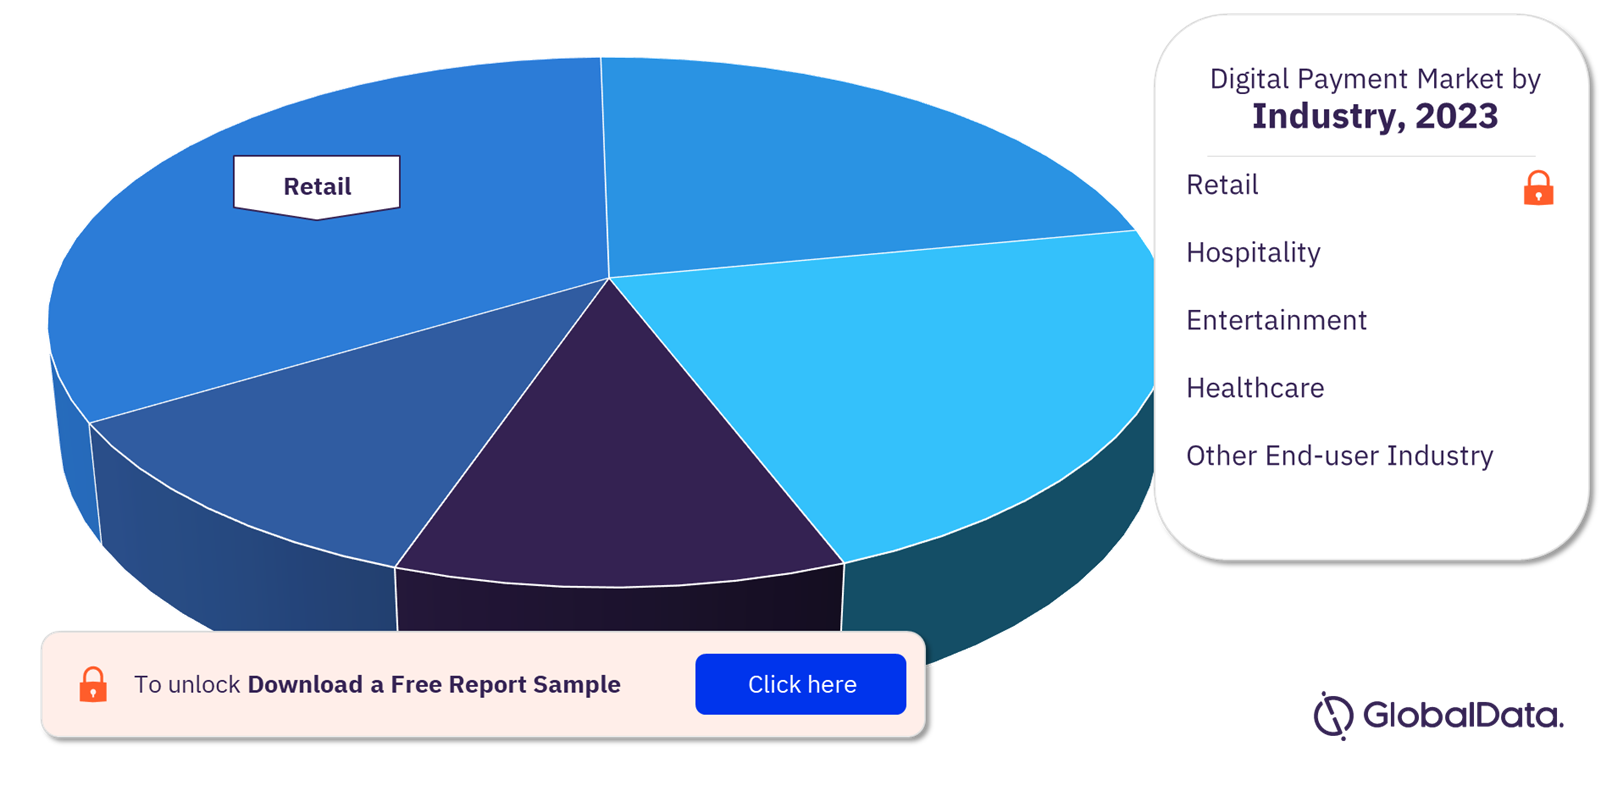
Digital Payments Market Segmentation by Industry

Traditionally, online payments referred specifically to ecommerce, being the buying and selling of goods and services over the internet. But as internet technologies have become more pervasive and portable, more and more types of payment are moving online. Now digital payments are used in most of the industries as a primary mode of payment.

In the pursuit of maximizing revenue-generating transactions, the payments industry has traditionally been advocating for cashless societies. Efforts by governments to discourage the use of cash, such as in Italy and India where the objective is to reduce the size of the black economy and increase tax revenues from electronic payments, are supported by the payments industry. The COVID-19 pandemic has accelerated this trend, with governments and companies worldwide promoting and launching mobile payment services.

Digital Payments Market Share by Industry, 2023 (%)

Digital Payments Market Share by Industry, 2023 (%)

Digital Payments Market Outlook Report with Detailed Segment Analysis is Available with GlobalData Now! Download a Free Report Sample

The use of digital payments in the healthcare sector is increasing to streamline payment processes, reduce administrative expenses, and improve patient satisfaction. Several healthcare providers now offer online payment portals, enabling patients to pay their bills electronically using credit or debit cards, or other digital payment options. Additionally, patients can access their billing statements, payment history, and insurance information through the online portal. With the emergence of mobile payment apps such as Apple Pay, Google Pay, or Samsung Pay, patients can now make healthcare payments through their smartphones or other mobile devices. Such apps allow patients to securely store their payment details and make payments efficiently and quickly.

Many hotels and other hospitality businesses offer online booking and payment systems, allowing customers to carry out bookings and make payments digitally. This proves to be more convenient for customers and helps businesses to reduce administrative costs. Contactless payment methods such as Near Field Communication (NFC) or Quick Response (QR) codes are becoming more popular in the hospitality industry, allowing customers to make payments without physically touching a payment terminal. This helps to reduce the risk of transmitting viruses or other pathogens and are more convenient for customers.

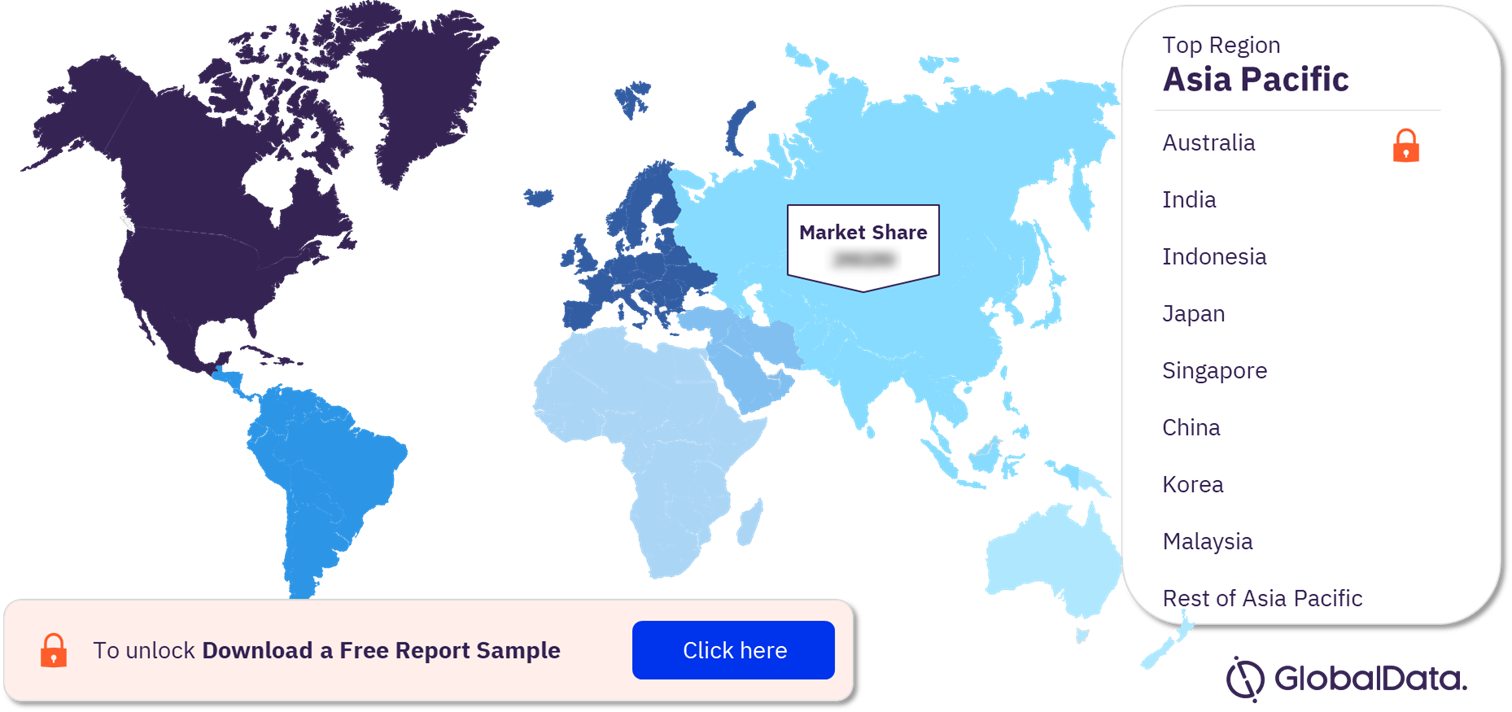
Digital Payments Market Analysis by Region

The Asia Pacific digital payment market by transaction value and volume was the highest in 2023, capturing over 50% of the overall market. The regional demand by value of transactions was led by China and UK collectively accounting for over 50% of the digital payments market in 2023. The regional demand by volume of transactions was led by China and US collectively accounting for over 40% of the digital payments market in 2023.

Asia Pacific is projected to retain the largest share by 2030 accounting for a major share of the global digital payments market by transaction value and volume, with a forecasted growth rate exceeding 15% from 2023 to 2030. Governments in the Asia Pacific region have been promoting digital payments in order to increase financial inclusion, reduce the use of cash, and drive economic growth. The government of India has introduced several policies and initiatives, such as the Unified Payments Interface (UPI) and the Bharat Interface for Money (BHIM) app, to make digital payments more accessible and convenient.

Asia-Pacific Digital Payments Market Share by Country, 2023 (%)

Asia-Pacific Digital Payments Market Share by Country, 2023 (%)

View Sample Report for Additional Digital Payments Market Insights, Download a Free Report Sample

Digital payments have become increasingly popular in Europe, with many countries adopting digital payment technologies. For example, the European Union launched the Single Euro Payments Area Instant Credit Transfer (SCT Inst) scheme, which allows for instant payments across participating countries. The EU’s revised Payment Services Directive (PSD2) has introduced the open banking regulations that require banks to share customer data with third-party providers to facilitate innovative payment services and improve financial inclusion. Europe is seeing significant growth in digital payments, driven by a range of factors such as changing consumer behavior, technological innovation, and regulatory developments.

Digital Payments Market – Competitive Landscape

Starting from 2019, there have been two main trends in the online payments industry. Firstly, established payment providers and processors have been consolidating, while dominant players have been acquiring new technology providers. This consolidation began with the merger between Fiserv and First Data in 2019, followed by FIS acquiring Worldpay and Global Payments acquiring TSYS in the same year. In 2020, Ingenico Group was acquired by Worldline. These significant transactions were primarily driven by the acquirers’ desire to broaden the range of services they offer to consumers, in response to the increasing adoption of alternative payment methods. These acquirers aim to provide comprehensive solutions that cater to all the requirements of both merchants and consumers.

The leading companies that specialize in digital payments are Alibaba Group Holding Ltd, American Express Co, Apple Inc, Google LLC, Mastercard Inc, PayPal Holdings Inc, Visa Inc, Discover Financial Services, ACI Worldwide Inc, Amazon.com Inc, Fiserv Inc, One97 Communications Ltd., Samsung Electronics Co Ltd, Fidelity National Information Services Inc, and The Western Union Co.

Leading Players in the Digital Payments Market

  • Alibaba Group Holding Ltd.
  • American Express Co.
  • Apple Inc.
  • Google LLC
  • Mastercard Inc.
  • PayPal Holdings Inc.
  • Visa Inc.
  • Discover Financial Services
  • ACI Worldwide Inc.
  • com Inc.
  • Fiserv Inc.
  • One97 Communications Ltd.
  • Samsung Electronics Co Ltd
  • Fidelity National Information Services Inc.
  • The Western Union Co.

Other Digital Payments Market Vendors Mentioned

Adyen, Affirm, Afterpay, Bud, China UnionPay, Danske, G+D, Global Payments, JPMorgan Chase, Jumio, Klarna, Monzo, MoneyGram, M-PESA, Plaid, Revolut, Ripple, RuPay, Square, Stripe, Tencent, Tink, TrueLayer, Trulioo, Wise, and Veridium

To Know More About Leading Digital Payments Market Players, Download a Free Report Sample

Digital Payments Market Segments and Scope

GlobalData Plc has segmented the digital payments market report by mode of payment, industry, and region:

Digital Payments Market Mode of Payment Outlook (Transaction Value and Volume, $ Trillion, 2020-2030)

  • Digital wallet
  • Credit Card
  • Debit Card
  • Online banking
  • Other

Digital Payments Market Industry Outlook (Transaction Value and Volume, $ Trillion, 2020-2030)

  • Retail
  • Hospitality
  • Entertainment
  • Healthcare
  • Other End-user Industry

Digital Payments Market Regional Outlook (Transaction Value and Volume, $ Trillion, 2020-2030)

  • North America
  • US
  • Canada
  • Asia-pacific
  • Australia
  • India
  • Indonesia
  • Japan
  • Singapore
  • China
  • Korea
  • Malaysia
  • Rest of Asia Pacific
  • Europe
  • Russia
  • Belgium
  • Germany
  • Italy
  • Spain
  • Ireland
  • Denmark
  • Finland
  • Netherlands
  • Poland
  • Sweden
  • France
  • UK
  • Rest of Europe
  • South and Central America
  • Mexico
  • Brazil
  • Colombia
  • Argentina
  • Peru
  • Rest of South and Central America
  • Middle East and Africa
  • South Africa
  • Turkey
  • Saudi Arabia
  • Rest of Middle East and Africa

Key Players

Alibaba Group Holding Ltd.
American Express Co.
Apple Inc.
Google LLC
Mastercard Inc.
PayPal Holdings Inc.
Visa Inc.
Discover Financial Services
ACI Worldwide Inc.
Amazon.com Inc.
Fiserv Inc.
One97 Communications Ltd.
Samsung Electronics Co Ltd
Fidelity National Information Services Inc.
The Western Union Co.

Table of Contents

  • Chapter 1 Executive Summary
  • Chapter 2 Research Scope and Segmentation
  • Chapter 3 Market Overview
  • Chapter 4 Digital Payments – Industry Trend Analysis

    • 4.1 Macroeconomic Indicators
    • 4.2 Technological Trends
    • 4.3 Regulatory Trends
    • 4.3 Digital Payments – Market Drivers
    • 4.4 Digital Payments – Market Restraints
    • 4.5 M&A Analysis
    • 4.6 Venture Financing Analysis
    • 4.7 Patent Analysis
    • 4.8 Social Media Analysis
    • 4.9 Job Analysis

  • Chapter 5 Digital Payments Segment Outlook By Transaction Value

    • 5.1 Global Market Revenue Snapshot
    • 5.2 Global Digital Payments Market by Mode of Payment

      • 5.2.1 Global Digital Payments Market Estimates and Forecasts, by Mode of Payment, 2020-2030 ($B)

    • 5.3 Global Digital Payments Market by Industry

      • 5.3.1 Global Digital Payments Market Estimates and Forecasts, by Industry, 2020-2030 ($B)

  • Chapter 6 Digital Payments Regional Outlook By Transaction Value

    • 6.1 Digital Payments – Regional Deep Dive
    • 6.2 North America

      • 6.2.1 North America Digital Payments Market Estimates & Forecasts, by Mode of Payment 2020-2030 ($B)
      • 6.2.2 North America Digital Payments Market Estimates & Forecasts, by Industry 2020-2030 ($B)
      • 6.2.3 US

        • 6.2.3.1 US Digital Payments Market Estimates & Forecasts, by Mode of Payment 2020-2030 ($B)
        • 6.2.3.2 US Digital Payments Market Estimates & Forecasts, by Industry 2020-2030 ($B)

      • 6.2.4 Canada

        • 6.2.4.1 Canada Digital Payments Market Estimates & Forecasts, by Mode of Payment 2020-2030 ($B)
        • 6.2.4.2 Canada Digital Payments Market Estimates & Forecasts, by Industry 2020-2030 ($B)

    • 6.3 Europe

      • 6.3.1 Europe Digital Payments Market Estimates & Forecasts, by Mode of Payment 2020-2030 ($B)
      • 6.3.2 Europe Digital Payments Market Estimates & Forecasts, by Industry 2020-2030 ($B)
      • 6.3.3 Germany

        • 6.2.3.1 Canada Digital Payments Market Estimates & Forecasts, by Mode of Payment 2020-2030 ($B)
        • 6.2.3.2 Canada Digital Payments Market Estimates & Forecasts, by Industry 2020-2030 ($B)

      • 6.3.4 France

        • 6.2.4.1 Canada Digital Payments Market Estimates & Forecasts, by Mode of Payment 2020-2030 ($B)
        • 6.2.4.2 Canada Digital Payments Market Estimates & Forecasts, by Industry 2020-2030 ($B)

      • 6.3.5 UK

        • 6.2.5.1 Canada Digital Payments Market Estimates & Forecasts, by Mode of Payment 2020-2030 ($B)
        • 6.2.5.2 Canada Digital Payments Market Estimates & Forecasts, by Industry 2020-2030 ($B)

      • 6.3.6 Italy

        • 6.3.6.1 Canada Digital Payments Market Estimates & Forecasts, by Mode of Payment 2020-2030 ($B)
        • 6.3.6.2 Canada Digital Payments Market Estimates & Forecasts, by Industry 2020-2030 ($B)

      • 6.3.7 Spain

        • 6.3.7.1 Canada Digital Payments Market Estimates & Forecasts, by Mode of Payment 2020-2030 ($B)
        • 6.3.7.2 Canada Digital Payments Market Estimates & Forecasts, by Industry 2020-2030 ($B)

      • 6.3.8 Russia

        • 6.3.8.1 Russia Digital Payments Market Estimates & Forecasts, by Mode of Payment 2020-2030 ($B)
        • 6.3.8.2 Russia Digital Payments Market Estimates & Forecasts, by Industry 2020-2030 ($B)

      • 6.3.9 Belgium

        • 6.3.9.1 Belgium Digital Payments Market Estimates & Forecasts, by Mode of Payment 2020-2030 ($B)
        • 6.3.9.2 Belgium Digital Payments Market Estimates & Forecasts, by Industry 2020-2030 ($B)

      • 6.3.10 Ireland

        • 6.3.10.1 Ireland Digital Payments Market Estimates & Forecasts, by Mode of Payment 2020-2030 ($B)
        • 6.3.10.2 Ireland Digital Payments Market Estimates & Forecasts, by Industry 2020-2030 ($B)

      • 6.3.11 Denmark

        • 6.3.11.1 Denmark Digital Payments Market Estimates & Forecasts, by Mode of Payment 2020-2030 ($B)
        • 6.3.11.2 Denmark Digital Payments Market Estimates & Forecasts, by Industry 2020-2030 ($B)

      • 6.3.12 Finland

        • 6.3.12.1 Finland Digital Payments Market Estimates & Forecasts, by Mode of Payment 2020-2030 ($B)
        • 6.3.12.2 Finland Digital Payments Market Estimates & Forecasts, by Industry 2020-2030 ($B)

      • 6.3.13 Netherlands

        • 6.3.13.1 Netherlands Digital Payments Market Estimates & Forecasts, by Mode of Payment 2020-2030 ($B)
        • 6.3.13.2 Netherlands Digital Payments Market Estimates & Forecasts, by Industry 2020-2030 ($B)

      • 6.3.14 Poland

        • 6.3.14.1 Poland Digital Payments Market Estimates & Forecasts, by Mode of Payment 2020-2030 ($B)
        • 6.3.14.2 Poland Digital Payments Market Estimates & Forecasts, by Industry 2020-2030 ($B)

      • 6.3.15 Sweden

        • 6.3.15.1 Sweden Digital Payments Market Estimates & Forecasts, by Mode of Payment 2020-2030 ($B)
        • 6.3.15.2 Sweden Digital Payments Market Estimates & Forecasts, by Industry 2020-2030 ($B)

      • 6.3.16 Rest of Europe

        • 6.3.16.1 Rest of Europe Digital Payments Market Estimates & Forecasts, by Mode of Payment 2020-2030 ($B)
        • 6.3.16.2 Rest of Europe Digital Payments Market Estimates & Forecasts, by Industry 2020-2030 ($B)

    • 6.4 Asia Pacific

      • 6.4.1 Asia Pacific Digital Payments Market Estimates & Forecasts, by Mode of Payment 2020-2030 ($B)
      • 6.4.2 Asia Pacific Digital Payments Market Estimates & Forecasts, by Industry 2020-2030 ($B)
      • 6.4.3 China

        • 6.4.3.1 China Digital Payments Market Estimates & Forecasts, by Mode of Payment 2020-2030 ($B)
        • 6.4.3.2 China Digital Payments Market Estimates & Forecasts, by Industry 2020-2030 ($B)

      • 6.4.4 Japan

        • 6.4.4.1 China Digital Payments Market Estimates & Forecasts, by Mode of Payment 2020-2030 ($B)
        • 6.4.4.2 China Digital Payments Market Estimates & Forecasts, by Industry 2020-2030 ($B)

      • 6.4.5 India

        • 6.4.5.1 China Digital Payments Market Estimates & Forecasts, by Mode of Payment 2020-2030 ($B)
        • 6.4.5.2 China Digital Payments Market Estimates & Forecasts, by Industry 2020-2030 ($B)

      • 6.4.6 South Korea

        • 6.4.6.1 China Digital Payments Market Estimates & Forecasts, by Mode of Payment 2020-2030 ($B)
        • 6.4.6.2 China Digital Payments Market Estimates & Forecasts, by Industry 2020-2030 ($B)

      • 6.4.7 Australia

        • 6.4.7.1 Australia Digital Payments Market Estimates & Forecasts, by Mode of Payment 2020-2030 ($B)
        • 6.4.7.2 Australia Digital Payments Market Estimates & Forecasts, by Industry 2020-2030 ($B)

      • 6.4.8 Indonesia

        • 6.4.8.1 Indonesia Digital Payments Market Estimates & Forecasts, by Mode of Payment 2020-2030 ($B)
        • 6.4.8.2 Indonesia Digital Payments Market Estimates & Forecasts, by Industry 2020-2030 ($B)

      • 6.4.9 Singapore

        • 6.4.9.1 Singapore Digital Payments Market Estimates & Forecasts, by Mode of Payment 2020-2030 ($B)
        • 6.4.9.2 Singapore Digital Payments Market Estimates & Forecasts, by Industry 2020-2030 ($B)

      • 6.4.10 Malaysia

        • 6.4.10.1 Malaysia Digital Payments Market Estimates & Forecasts, by Mode of Payment 2020-2030 ($B)
        • 6.4.10.2 Malaysia Digital Payments Market Estimates & Forecasts, by Industry 2020-2030 ($B)

      • 6.4.11 Rest of Asia Pacific

        • 6.4.4.11 Rest of Asia Pacific Digital Payments Market Estimates & Forecasts, by Mode of Payment 2020-2030 ($B)
        • 6.4.4.11 Rest of Asia Pacific Digital Payments Market Estimates & Forecasts, by Industry 2020-2030 ($B)

    • 6.5 Central & South America

      • 6.5.1 Central & South America Digital Payments Market Estimates & Forecasts, by Mode of Payment 2020-2030 ($B)
      • 6.5.2 Central & South America Digital Payments Market Estimates & Forecasts, by Industry 2020-2030 ($B)
      • 6.5.3 Brazil

        • 6.5.3.1 Brazil Digital Payments Market Estimates & Forecasts, by Mode of Payment 2020-2030 ($B)
        • 6.5.3.2 Brazil Digital Payments Market Estimates & Forecasts, by Industry 2020-2030 ($B)

      • 6.5.4 Argentina

        • 6.5.4.1 Argentina Digital Payments Market Estimates & Forecasts, by Mode of Payment 2020-2030 ($B)
        • 6.5.4.2 Argentina Digital Payments Market Estimates & Forecasts, by Industry 2020-2030 ($B)

      • 6.5.5 Mexico

        • 6.5.5.1 Mexico Digital Payments Market Estimates & Forecasts, by Mode of Payment 2020-2030 ($B)
        • 6.5.5.2 Mexico Digital Payments Market Estimates & Forecasts, by Industry 2020-2030 ($B)

      • 6.5.6 Colombia

        • 6.5.6.1 Colombia Digital Payments Market Estimates & Forecasts, by Mode of Payment 2020-2030 ($B)
        • 6.5.6.2 Colombia Digital Payments Market Estimates & Forecasts, by Industry 2020-2030 ($B)

      • 6.5.7 Peru

        • 6.5.7.1 Peru Digital Payments Market Estimates & Forecasts, by Mode of Payment 2020-2030 ($B)
        • 6.5.7.2 Peru Digital Payments Market Estimates & Forecasts, by Industry 2020-2030 ($B)

      • 6.5.8 Rest of Central & South America

        • 6.5.8.1 Rest of Central & South America Digital Payments Market Estimates & Forecasts, by Mode of Payment 2020-2030 ($B)
        • 6.5.8.2 Rest of Central & South America Digital Payments Market Estimates & Forecasts, by Industry 2020-2030 ($B)

    • 6.6 Middle East & Africa

      • 6.6.1 Middle East & Africa Digital Payments Market Estimates & Forecasts, by Mode of Payment 2020-2030 ($B)
      • 6.6.2 Middle East & Africa Digital Payments Market Estimates & Forecasts, by Industry 2020-2030 ($B)
      • 6.6.3 South Africa

        • 6.6.3.1 South Africa Digital Payments Market Estimates & Forecasts, by Mode of Payment 2020-2030 ($B)
        • 6.6.3.2 South Africa Digital Payments Market Estimates & Forecasts, by Industry 2020-2030 ($B)

      • 6.6.4 Saudi Arabia

        • 6.6.4.1 Saudi Arabia Digital Payments Market Estimates & Forecasts, by Mode of Payment 2020-2030 ($B)
        • 6.6.4.2 Saudi Arabia Digital Payments Market Estimates & Forecasts, by Industry 2020-2030 ($B)

      • 6.6.5 Turkey

        • 6.6.5.1 Turkey Digital Payments Market Estimates & Forecasts, by Mode of Payment 2020-2030 ($B)
        • 6.6.5.2 Turkey Digital Payments Market Estimates & Forecasts, by Industry 2020-2030 ($B)

      • 6.6.6 Rest of Middle East & Africa

        • 6.6.6.1 Rest of Middle East & Africa Digital Payments Market Estimates & Forecasts, by Mode of Payment 2020-2030 ($B)
        • 6.6.6.2 Rest of Middle East & Africa Digital Payments Market Estimates & Forecasts, by Industry 2020-2030 ($B)

  • Chapter 7 Digital Payments Segment Outlook By Transaction Volume

    • 7.1 Global Market Revenue Snapshot
    • 7.2 Global Digital Payments Market by Mode of Payment

      • 7.2.1 Global Digital Payments Market Estimates and Forecasts, by Mode of Payment, 2020-2030 (B)

    • 7.3 Global Digital Payments Market by Industry

      • 7.3.1 Global Digital Payments Market Estimates and Forecasts, by Industry, 2020-2030 (B)

  • Chapter 8 Digital Payments Regional Outlook By Transaction Volume

    • 8.1 Digital Payments – Regional Deep Dive
    • 8.2 North America

      • 8.2.1 North America Digital Payments Market Estimates & Forecasts, by Mode of Payment 2020-2030 (B)
      • 8.2.2 North America Digital Payments Market Estimates & Forecasts, by Industry 2020-2030 (B)
      • 8.2.3 US

        • 8.2.3.1 US Digital Payments Market Estimates & Forecasts, by Mode of Payment 2020-2030 (B)
        • 8.2.3.2 US Digital Payments Market Estimates & Forecasts, by Industry 2020-2030 (B)

      • 8.2.4 Canada

        • 8.2.4.1 Canada Digital Payments Market Estimates & Forecasts, by Mode of Payment 2020-2030 (B)
        • 8.2.4.2 Canada Digital Payments Market Estimates & Forecasts, by Industry 2020-2030 (B)

    • 8.3 Europe

      • 8.3.1 Europe Digital Payments Market Estimates & Forecasts, by Mode of Payment 2020-2030 (B)
      • 8.3.2 Europe Digital Payments Market Estimates & Forecasts, by Industry 2020-2030 (B)
      • 8.3.3 Germany

        • 8.2.3.1 Canada Digital Payments Market Estimates & Forecasts, by Mode of Payment 2020-2030 (B)
        • 8.2.3.2 Canada Digital Payments Market Estimates & Forecasts, by Industry 2020-2030 (B)

      • 8.3.4 France

        • 8.2.4.1 Canada Digital Payments Market Estimates & Forecasts, by Mode of Payment 2020-2030 (B)
        • 8.2.4.2 Canada Digital Payments Market Estimates & Forecasts, by Industry 2020-2030 (B)

      • 8.3.5 UK

        • 8.2.5.1 Canada Digital Payments Market Estimates & Forecasts, by Mode of Payment 2020-2030 (B)
        • 8.2.5.2 Canada Digital Payments Market Estimates & Forecasts, by Industry 2020-2030 (B)

      • 8.3.6 Italy

        • 8.3.6.1 Canada Digital Payments Market Estimates & Forecasts, by Mode of Payment 2020-2030 (B)
        • 8.3.6.2 Canada Digital Payments Market Estimates & Forecasts, by Industry 2020-2030 (B)

      • 8.3.7 Spain

        • 8.3.7.1 Canada Digital Payments Market Estimates & Forecasts, by Mode of Payment 2020-2030 (B)
        • 8.3.7.2 Canada Digital Payments Market Estimates & Forecasts, by Industry 2020-2030 (B)

      • 8.3.8 Russia

        • 8.3.8.1 Russia Digital Payments Market Estimates & Forecasts, by Mode of Payment 2020-2030 (B)
        • 8.3.8.2 Russia Digital Payments Market Estimates & Forecasts, by Industry 2020-2030 (B)

      • 8.3.9 Belgium

        • 8.3.9.1 Belgium Digital Payments Market Estimates & Forecasts, by Mode of Payment 2020-2030 (B)
        • 8.3.9.2 Belgium Digital Payments Market Estimates & Forecasts, by Industry 2020-2030 (B)

      • 8.3.10 Ireland

        • 8.3.10.1 Ireland Digital Payments Market Estimates & Forecasts, by Mode of Payment 2020-2030 (B)
        • 8.3.10.2 Ireland Digital Payments Market Estimates & Forecasts, by Industry 2020-2030 (B)

      • 8.3.11 Denmark

        • 8.3.11.1 Denmark Digital Payments Market Estimates & Forecasts, by Mode of Payment 2020-2030 (B)
        • 8.3.11.2 Denmark Digital Payments Market Estimates & Forecasts, by Industry 2020-2030 (B)

      • 8.3.12 Finland

        • 8.3.12.1 Finland Digital Payments Market Estimates & Forecasts, by Mode of Payment 2020-2030 (B)
        • 8.3.12.2 Finland Digital Payments Market Estimates & Forecasts, by Industry 2020-2030 (B)

      • 8.3.13 Netherlands

        • 8.3.13.1 Netherlands Digital Payments Market Estimates & Forecasts, by Mode of Payment 2020-2030 (B)
        • 8.3.13.2 Netherlands Digital Payments Market Estimates & Forecasts, by Industry 2020-2030 (B)

      • 8.3.14 Poland

        • 8.3.14.1 Poland Digital Payments Market Estimates & Forecasts, by Mode of Payment 2020-2030 (B)
        • 8.3.14.2 Poland Digital Payments Market Estimates & Forecasts, by Industry 2020-2030 (B)

      • 8.3.15 Sweden

        • 8.3.15.1 Sweden Digital Payments Market Estimates & Forecasts, by Mode of Payment 2020-2030 (B)
        • 8.3.15.2 Sweden Digital Payments Market Estimates & Forecasts, by Industry 2020-2030 (B)

      • 8.3.16 Rest of Europe

        • 8.3.16.1 Rest of Europe Digital Payments Market Estimates & Forecasts, by Mode of Payment 2020-2030 (B)
        • 8.3.16.2 Rest of Europe Digital Payments Market Estimates & Forecasts, by Industry 2020-2030 (B)

    • 8.4 Asia Pacific

      • 8.4.1 Asia Pacific Digital Payments Market Estimates & Forecasts, by Mode of Payment 2020-2030 (B)
      • 8.4.2 Asia Pacific Digital Payments Market Estimates & Forecasts, by Industry 2020-2030 (B)
      • 8.4.3 China

        • 8.4.3.1 China Digital Payments Market Estimates & Forecasts, by Mode of Payment 2020-2030 (B)
        • 8.4.3.2 China Digital Payments Market Estimates & Forecasts, by Industry 2020-2030 (B)

      • 8.4.4 Japan

        • 8.4.4.1 China Digital Payments Market Estimates & Forecasts, by Mode of Payment 2020-2030 (B)
        • 8.4.4.2 China Digital Payments Market Estimates & Forecasts, by Industry 2020-2030 (B)

      • 8.4.5 India

        • 8.4.5.1 China Digital Payments Market Estimates & Forecasts, by Mode of Payment 2020-2030 (B)
        • 8.4.5.2 China Digital Payments Market Estimates & Forecasts, by Industry 2020-2030 (B)

      • 8.4.6 South Korea

        • 8.4.6.1 China Digital Payments Market Estimates & Forecasts, by Mode of Payment 2020-2030 (B)
        • 8.4.6.2 China Digital Payments Market Estimates & Forecasts, by Industry 2020-2030 (B)

      • 8.4.7 Australia

        • 8.4.7.1 Australia Digital Payments Market Estimates & Forecasts, by Mode of Payment 2020-2030 (B)
        • 8.4.7.2 Australia Digital Payments Market Estimates & Forecasts, by Industry 2020-2030 (B)

      • 8.4.8 Indonesia

        • 8.4.8.1 Indonesia Digital Payments Market Estimates & Forecasts, by Mode of Payment 2020-2030 (B)
        • 8.4.8.2 Indonesia Digital Payments Market Estimates & Forecasts, by Industry 2020-2030 (B)

      • 8.4.9 Singapore

        • 8.4.9.1 Singapore Digital Payments Market Estimates & Forecasts, by Mode of Payment 2020-2030 (B)
        • 8.4.9.2 Singapore Digital Payments Market Estimates & Forecasts, by Industry 2020-2030 (B)

      • 8.4.10 Malaysia

        • 8.4.10.1 Malaysia Digital Payments Market Estimates & Forecasts, by Mode of Payment 2020-2030 (B)
        • 8.4.10.2 Malaysia Digital Payments Market Estimates & Forecasts, by Industry 2020-2030 (B)

      • 8.4.11 Rest of Asia Pacific

        • 8.4.4.11 Rest of Asia Pacific Digital Payments Market Estimates & Forecasts, by Mode of Payment 2020-2030 (B)
        • 8.4.4.11 Rest of Asia Pacific Digital Payments Market Estimates & Forecasts, by Industry 2020-2030 (B)

    • 8.5 Central & South America

      • 8.5.1 Central & South America Digital Payments Market Estimates & Forecasts, by Mode of Payment 2020-2030 (B)
      • 8.5.2 Central & South America Digital Payments Market Estimates & Forecasts, by Industry 2020-2030 (B)
      • 8.5.3 Brazil

        • 8.5.3.1 Brazil Digital Payments Market Estimates & Forecasts, by Mode of Payment 2020-2030 (B)
        • 8.5.3.2 Brazil Digital Payments Market Estimates & Forecasts, by Industry 2020-2030 (B)

      • 8.5.4 Argentina

        • 8.5.4.1 Argentina Digital Payments Market Estimates & Forecasts, by Mode of Payment 2020-2030 (B)
        • 8.5.4.2 Argentina Digital Payments Market Estimates & Forecasts, by Industry 2020-2030 (B)

      • 8.5.5 Mexico

        • 8.5.5.1 Mexico Digital Payments Market Estimates & Forecasts, by Mode of Payment 2020-2030 (B)
        • 8.5.5.2 Mexico Digital Payments Market Estimates & Forecasts, by Industry 2020-2030 (B)

      • 8.5.6 Colombia

        • 8.5.6.1 Colombia Digital Payments Market Estimates & Forecasts, by Mode of Payment 2020-2030 (B)
        • 8.5.6.2 Colombia Digital Payments Market Estimates & Forecasts, by Industry 2020-2030 (B)

      • 8.5.7 Peru

        • 8.5.7.1 Peru Digital Payments Market Estimates & Forecasts, by Mode of Payment 2020-2030 (B)
        • 8.5.7.2 Peru Digital Payments Market Estimates & Forecasts, by Industry 2020-2030 (B)

      • 8.5.8 Rest of Central & South America

        • 8.5.8.1 Rest of Central & South America Digital Payments Market Estimates & Forecasts, by Mode of Payment 2020-2030 (B)
        • 8.5.8.2 Rest of Central & South America Digital Payments Market Estimates & Forecasts, by Industry 2020-2030 (B)

    • 8.6 Middle East & Africa

      • 8.6.1 Middle East & Africa Digital Payments Market Estimates & Forecasts, by Mode of Payment 2020-2030 (B)
      • 8.6.2 Middle East & Africa Digital Payments Market Estimates & Forecasts, by Industry 2020-2030 (B)
      • 8.6.3 South Africa

        • 8.6.3.1 South Africa Digital Payments Market Estimates & Forecasts, by Mode of Payment 2020-2030 (B)
        • 8.6.3.2 South Africa Digital Payments Market Estimates & Forecasts, by Industry 2020-2030 (B)

      • 8.6.4 Saudi Arabia

        • 8.6.4.1 Saudi Arabia Digital Payments Market Estimates & Forecasts, by Mode of Payment 2020-2030 (B)
        • 8.6.4.2 Saudi Arabia Digital Payments Market Estimates & Forecasts, by Industry 2020-2030 (B)

      • 8.6.5 Turkey

        • 8.6.5.1 Turkey Digital Payments Market Estimates & Forecasts, by Mode of Payment 2020-2030 (B)
        • 8.6.5.2 Turkey Digital Payments Market Estimates & Forecasts, by Industry 2020-2030 (B)

      • 8.6.6 Rest of Middle East & Africa

        • 8.6.6.1 Rest of Middle East & Africa Digital Payments Market Estimates & Forecasts, by Mode of Payment 2020-2030 (B)
        • 8.6.6.2 Rest of Middle East & Africa Digital Payments Market Estimates & Forecasts, by Industry 2020-2030 (B)

  • Chapter 9 Competitive Landscape

    • 9.1 Digital Payments- Vendor Growth-Innovation Matrix
    • 9.2 Competitive Positioning of vendors in the Digital payments market
    • 9.3 Digital Payments – Mergers & Acquisitions

  • Chapter 10 Company Profiles

    • 10.1 Alibaba Group Holding Ltd
    • 10.2 American Express Co
    • 10.3 Apple Inc
    • 10.4 Google LLC
    • 10.5 Mastercard Inc
    • 10.6 PayPal Holdings Inc
    • 10.7 Visa Inc
    • 10.8 Discover Financial Services
    • 10.9 ACI Worldwide Inc
    • 10.10 Amazon.com Inc
    • 10.11 Fiserv Inc
    • 10.12 One97 Communications Ltd.
    • 10.13 Samsung Electronics Co Ltd
    • 10.14 Fidelity National Information Services Inc

Figures

List of Figures

Fig 1: Digital Payment Market – Segmentation

Fig 2: Digital Payment Market – Timeline

Fig 3: Digital Payment Market- Value Chain Analysis

Fig 4: Digital Payment Market- M&A Analysis

Fig 5: Digital Payment Market- VF Analysis

Fig 6: Digital Payment Market- Patent Analysis

Fig 7: Digital Payment Market- Social Media Analysis

Fig 8: Digital Payment Market- Job Analysis

Fig 9: Global Digital Payment Market By Mode of Payment, 2020 – 2030 ($B)

Fig 10: Global Digital Payment Market By Industry, 2020 – 2030 ($B)

Fig 11: North America Digital Payment Market By Mode of Payment, 2020 – 2030 ($B)

Fig 12: North America Digital Payment Market By Industry, 2020 – 2030 ($B)

Fig 13: US Digital Payment Market By Mode of Payment, 2020 – 2030 ($B)

Fig 14: US Digital Payment Market By Industry, 2020 – 2030 ($B)

Fig 15: Canada Digital Payment Market By Mode of Payment, 2020 – 2030 ($B)

Fig 16: Canada Digital Payment Market By Industry, 2020 – 2030 ($B)

Fig 17: Asia Pacific Digital Payment Market By Mode of Payment, 2020 – 2030 ($B)

Fig 18: Asia Pacific Digital Payment Market By Industry, 2020 – 2030 ($B)

Fig 19: Australia Digital Payment Market By Mode of Payment, 2020 – 2030 ($B)

Fig 20: Australia Digital Payment Market By Industry, 2020 – 2030 ($B)

Fig 21: India Digital Payment Market By Mode of Payment, 2020 – 2030 ($B)

Fig 22: India Digital Payment Market By Industry, 2020 – 2030 ($B)

Fig 23: Indonesia Digital Payment Market By Mode of Payment, 2020 – 2030 ($B)

Fig 24: Indonesia Digital Payment Market By Industry, 2020 – 2030 ($B)

Fig 25: Japan Digital Payment Market By Mode of Payment, 2020 – 2030 ($B)

Fig 26: Japan Digital Payment Market By Industry, 2020 – 2030 ($B)

Fig 27: Singapore Digital Payment Market By Mode of Payment, 2020 – 2030 ($B)

Fig 28: Singapore Digital Payment Market By Industry, 2020 – 2030 ($B)

Fig 29: China Digital Payment Market By Mode of Payment, 2020 – 2030 ($B)

Fig 30: China Digital Payment Market By Industry, 2020 – 2030 ($B)

Fig 31: Korea Digital Payment Market By Mode of Payment, 2020 – 2030 ($B)

Fig 32: Korea Digital Payment Market By Industry, 2020 – 2030 ($B)

Fig 33: Malaysia Digital Payment Market By Mode of Payment, 2020 – 2030 ($B)

Fig 34: Malaysia Digital Payment Market By Industry, 2020 – 2030 ($B)

Fig 35: Rest of Asia Pacific Digital Payment Market By Mode of Payment, 2020 – 2030 ($B)

Fig 36: Rest of Asia Pacific Digital Payment Market By Industry, 2020 – 2030 ($B)

Fig 37: Europe Digital Payment Market By Mode of Payment, 2020 – 2030 ($B)

Fig 38: Europe Digital Payment Market By Industry, 2020 – 2030 ($B)

Fig 39: Russia Digital Payment Market By Mode of Payment, 2020 – 2030 ($B)

Fig 40: Russia Digital Payment Market By Industry, 2020 – 2030 ($B)

Fig 41: Belgium Digital Payment Market By Mode of Payment, 2020 – 2030 ($B)

Fig 42: Belgium Digital Payment Market By Industry, 2020 – 2030 ($B)

Fig 43: Germany Digital Payment Market By Mode of Payment, 2020 – 2030 ($B)

Fig 44: Germany Digital Payment Market By Industry, 2020 – 2030 ($B)

Fig 45: Italy Digital Payment Market By Mode of Payment, 2020 – 2030 ($B)

Fig 46: Italy Digital Payment Market By Industry, 2020 – 2030 ($B)

Fig 47: Spain Digital Payment Market By Mode of Payment, 2020 – 2030 ($B)

Fig 48: Spain Digital Payment Market By Industry, 2020 – 2030 ($B)

Fig 49: Ireland Digital Payment Market By Mode of Payment, 2020 – 2030 ($B)

Fig 50: Ireland Digital Payment Market By Industry, 2020 – 2030 ($B)

Fig 51: Denmark Digital Payment Market By Mode of Payment, 2020 – 2030 ($B)

Fig 52: Denmark Digital Payment Market By Industry, 2020 – 2030 ($B)

Fig 53: Finland Digital Payment Market By Mode of Payment, 2020 – 2030 ($B)

Fig 54: Finland Digital Payment Market By Industry, 2020 – 2030 ($B)

Fig 55: Netherlands Digital Payment Market By Mode of Payment, 2020 – 2030 ($B)

Fig 56: Netherlands Digital Payment Market By Industry, 2020 – 2030 ($B)

Fig 57: Poland Digital Payment Market By Mode of Payment, 2020 – 2030 ($B)

Fig 58: Poland Digital Payment Market By Industry, 2020 – 2030 ($B)

Fig 59: Sweden Digital Payment Market By Mode of Payment, 2020 – 2030 ($B)

Fig 60: Sweden Digital Payment Market By Industry, 2020 – 2030 ($B)

Fig 61: France Digital Payment Market By Mode of Payment, 2020 – 2030 ($B)

Fig 62: France Digital Payment Market By Industry, 2020 – 2030 ($B)

Fig 63: UK Digital Payment Market By Mode of Payment, 2020 – 2030 ($B)

Fig 64: UK Digital Payment Market By Industry, 2020 – 2030 ($B)

Fig 65: Rest of Europe Digital Payment Market By Mode of Payment, 2020 – 2030 ($B)

Fig 66: Rest of Europe Digital Payment Market By Industry, 2020 – 2030 ($B)

Fig 67: South & Central America Digital Payment Market By Mode of Payment, 2020 – 2030 ($B)

Fig 68: South & Central America Digital Payment Market By Industry, 2020 – 2030 ($B)

Fig 69: Argentina Digital Payment Market By Mode of Payment, 2020 – 2030 ($B)

Fig 70: Argentina Digital Payment Market By Industry, 2020 – 2030 ($B)

Fig 71: Mexico Digital Payment Market By Mode of Payment, 2020 – 2030 ($B)

Fig 72: Mexico Digital Payment Market By Industry, 2020 – 2030 ($B)

Fig 73: Brazil Digital Payment Market By Mode of Payment, 2020 – 2030 ($B)

Fig 74: Brazil Digital Payment Market By Industry, 2020 – 2030 ($B)

Fig 75: Colombia Digital Payment Market By Mode of Payment, 2020 – 2030 ($B)

Fig 76: Colombia Digital Payment Market By Industry, 2020 – 2030 ($B)

Fig 77: Peru Digital Payment Market By Mode of Payment, 2020 – 2030 ($B)

Fig 78: Peru Digital Payment Market By Industry, 2020 – 2030 ($B)

Fig 79: Rest of South & Central America Digital Payment Market By Mode of Payment, 2020 – 2030 ($B)

Fig 80: Rest of South & Central America Digital Payment Market By Industry, 2020 – 2030 ($B)

Fig 81: Middle East & Africa Digital Payment Market By Mode of Payment, 2020 – 2030 ($B)

Fig 82: Middle East & Africa Digital Payment Market By Industry, 2020 – 2030 ($B)

Fig 83: Saudi Arabia Digital Payment Market By Mode of Payment, 2020 – 2030 ($B)

Fig 84: Saudi Arabia Digital Payment Market By Industry, 2020 – 2030 ($B)

Fig 85: Turkey Digital Payment Market By Mode of Payment, 2020 – 2030 ($B)

Fig 86: Turkey Digital Payment Market By Industry, 2020 – 2030 ($B)

Fig 87: South Africa Digital Payment Market By Mode of Payment, 2020 – 2030 ($B)

Fig 88: South Africa Digital Payment Market By Industry, 2020 – 2030 ($B)

Fig 89: Rest of Middle East & Africa Digital Payment Market By Mode of Payment, 2020 – 2030 ($B)

Fig 90: Rest of Middle East & Africa Digital Payment Market By Industry, 2020 – 2030 ($B)

Fig 91: Global Digital Payment Market By Mode of Payment, 2020 – 2030 (B)

Fig 92: Global Digital Payment Market By Industry, 2020 – 2030 (B)

Fig 93: North America Digital Payment Market By Mode of Payment, 2020 – 2030 (B)

Fig 94: North America Digital Payment Market By Industry, 2020 – 2030 (B)

Fig 95: US Digital Payment Market By Mode of Payment, 2020 – 2030 (B)

Fig 96: US Digital Payment Market By Industry, 2020 – 2030 (B)

Fig 97: Canada Digital Payment Market By Mode of Payment, 2020 – 2030 (B)

Fig 98: Canada Digital Payment Market By Industry, 2020 – 2030 (B)

Fig 99: Asia Pacific Digital Payment Market By Mode of Payment, 2020 – 2030 (B)

Fig 100: Asia Pacific Digital Payment Market By Industry, 2020 – 2030 (B)

Fig 101: Australia Digital Payment Market By Mode of Payment, 2020 – 2030 (B)

Fig 102: Australia Digital Payment Market By Industry, 2020 – 2030 (B)

Fig 103: India Digital Payment Market By Mode of Payment, 2020 – 2030 (B)

Fig 104: India Digital Payment Market By Industry, 2020 – 2030 (B)

Fig 105: Indonesia Digital Payment Market By Mode of Payment, 2020 – 2030 (B)

Fig 106: Indonesia Digital Payment Market By Industry, 2020 – 2030 (B)

Fig 107: Japan Digital Payment Market By Mode of Payment, 2020 – 2030 (B)

Fig 108: Japan Digital Payment Market By Industry, 2020 – 2030 (B)

Fig 109: Singapore Digital Payment Market By Mode of Payment, 2020 – 2030 (B)

Fig 110: Singapore Digital Payment Market By Industry, 2020 – 2030 (B)

Fig 111: China Digital Payment Market By Mode of Payment, 2020 – 2030 (B)

Fig 112: China Digital Payment Market By Industry, 2020 – 2030 (B)

Fig 113: Korea Digital Payment Market By Mode of Payment, 2020 – 2030 (B)

Fig 114: Korea Digital Payment Market By Industry, 2020 – 2030 (B)

Fig 115: Malaysia Digital Payment Market By Mode of Payment, 2020 – 2030 (B)

Fig 116: Malaysia Digital Payment Market By Industry, 2020 – 2030 (B)

Fig 117: Rest of Asia Pacific Digital Payment Market By Mode of Payment, 2020 – 2030 (B)

Fig 118: Rest of Asia Pacific Digital Payment Market By Industry, 2020 – 2030 (B)

Fig 119: Europe Digital Payment Market By Mode of Payment, 2020 – 2030 (B)

Fig 120: Europe Digital Payment Market By Industry, 2020 – 2030 (B)

Fig 121: Russia Digital Payment Market By Mode of Payment, 2020 – 2030 (B)

Fig 122: Russia Digital Payment Market By Industry, 2020 – 2030 (B)

Fig 123: Belgium Digital Payment Market By Mode of Payment, 2020 – 2030 (B)

Fig 124: Belgium Digital Payment Market By Industry, 2020 – 2030 (B)

Fig 125: Germany Digital Payment Market By Mode of Payment, 2020 – 2030 (B)

Fig 126: Germany Digital Payment Market By Industry, 2020 – 2030 (B)

Fig 127: Italy Digital Payment Market By Mode of Payment, 2020 – 2030 (B)

Fig 128: Italy Digital Payment Market By Industry, 2020 – 2030 (B)

Fig 129: Spain Digital Payment Market By Mode of Payment, 2020 – 2030 (B)

Fig 130: Spain Digital Payment Market By Industry, 2020 – 2030 (B)

Fig 131: Ireland Digital Payment Market By Mode of Payment, 2020 – 2030 (B)

Fig 132: Ireland Digital Payment Market By Industry, 2020 – 2030 (B)

Fig 133: Denmark Digital Payment Market By Mode of Payment, 2020 – 2030 (B)

Fig 134: Denmark Digital Payment Market By Industry, 2020 – 2030 (B)

Fig 135: Finland Digital Payment Market By Mode of Payment, 2020 – 2030 (B)

Fig 136: Finland Digital Payment Market By Industry, 2020 – 2030 (B)

Fig 137: Netherlands Digital Payment Market By Mode of Payment, 2020 – 2030 (B)

Fig 138: Netherlands Digital Payment Market By Industry, 2020 – 2030 (B)

Fig 139: Poland Digital Payment Market By Mode of Payment, 2020 – 2030 (B)

Fig 140: Poland Digital Payment Market By Industry, 2020 – 2030 (B)

Fig 141: Sweden Digital Payment Market By Mode of Payment, 2020 – 2030 (B)

Fig 142: Sweden Digital Payment Market By Industry, 2020 – 2030 (B)

Fig 143: France Digital Payment Market By Mode of Payment, 2020 – 2030 (B)

Fig 144: France Digital Payment Market By Industry, 2020 – 2030 (B)

Fig 145: UK Digital Payment Market By Mode of Payment, 2020 – 2030 (B)

Fig 146: UK Digital Payment Market By Industry, 2020 – 2030 (B)

Fig 147: Rest of Europe Digital Payment Market By Mode of Payment, 2020 – 2030 (B)

Fig 148: Rest of Europe Digital Payment Market By Industry, 2020 – 2030 (B)

Fig 149: South & Central America Digital Payment Market By Mode of Payment, 2020 – 2030 (B)

Fig 150: South & Central America Digital Payment Market By Industry, 2020 – 2030 (B)

Fig 151: Argentina Digital Payment Market By Mode of Payment, 2020 – 2030 (B)

Fig 152: Argentina Digital Payment Market By Industry, 2020 – 2030 (B)

Fig 153: Mexico Digital Payment Market By Mode of Payment, 2020 – 2030 (B)

Fig 154: Mexico Digital Payment Market By Industry, 2020 – 2030 (B)

Fig 155: Brazil Digital Payment Market By Mode of Payment, 2020 – 2030 (B)

Fig 156: Brazil Digital Payment Market By Industry, 2020 – 2030 (B)

Fig 157: Colombia Digital Payment Market By Mode of Payment, 2020 – 2030 (B)

Fig 158: Colombia Digital Payment Market By Industry, 2020 – 2030 (B)

Fig 159: Peru Digital Payment Market By Mode of Payment, 2020 – 2030 (B)

Fig 160: Peru Digital Payment Market By Industry, 2020 – 2030 (B)

Fig 161: Rest of South & Central America Digital Payment Market By Mode of Payment, 2020 – 2030 (B)

Fig 162: Rest of South & Central America Digital Payment Market By Industry, 2020 – 2030 (B)

Fig 163: Middle East & Africa Digital Payment Market By Mode of Payment, 2020 – 2030 (B)

Fig 164: Middle East & Africa Digital Payment Market By Industry, 2020 – 2030 (B)

Fig 165: Saudi Arabia Digital Payment Market By Mode of Payment, 2020 – 2030 (B)

Fig 166: Saudi Arabia Digital Payment Market By Industry, 2020 – 2030 (B)

Fig 167: Turkey Digital Payment Market By Mode of Payment, 2020 – 2030 (B)

Fig 168: Turkey Digital Payment Market By Industry, 2020 – 2030 (B)

Fig 169: South Africa Digital Payment Market By Mode of Payment, 2020 – 2030 (B)

Fig 170: South Africa Digital Payment Market By Industry, 2020 – 2030 (B)

Fig 171: Rest of Middle East & Africa Digital Payment Market By Mode of Payment, 2020 – 2030 (B)

Fig 172: Rest of Middle East & Africa Digital Payment Market By Industry, 2020 – 2030 (B)

Fig 173: Digital Payment – Vendor Growth-Innovation Matrix

Fig 174: Alibaba Group Holding Ltd: Company Overview

Fig 175: Alibaba Group Holding Ltd: Financial Performance

Fig 176: American Express Co: Company Overview

Fig 177: American Express Co: Financial Performance

Fig 178: Apple Inc: Company Overview

Fig 179: Apple Inc: Financial Performance

Fig 180: Google LLC: Company Overview

Fig 181: Google LLC: Financial Performance

Fig 182: Mastercard Inc: Company Overview

Fig 183: Mastercard Inc: Financial Performance

Fig 184: PayPal Holdings Inc: Company Overview

Fig 185: PayPal Holdings Inc: Financial Performance

Fig 186: Visa Inc: Company Overview

Fig 187: Visa Inc: Financial Performance

Fig 188: Discover Financial Services: Company Overview

Fig 189: Discover Financial Services: Financial Performance

Fig 190: ACI Worldwide Inc: Company Overview

Fig 191: ACI Worldwide Inc: Financial Performance

Fig 192: Amazon.com Inc: Company Overview

Fig 193: Amazon.com Inc: Financial Performance

Fig 194: Fiserv Inc: Company Overview

Fig 195: Fiserv Inc: Financial Performance

Fig 196: One97 Communications Ltd.: Company Overview

Fig 197: One97 Communications Ltd.: Financial Performance

Fig 198: Samsung Electronics Co Ltd: Company Overview

Fig 199: Samsung Electronics Co Ltd: Financial Performance

Fig 200: Fidelity National Information Services Inc: Company Overview

Fig 201: Fidelity National Information Services Inc: Financial Performance

Fig 202: The Western Union Co: Company Overview

Fig 203: The Western Union Co: Financial Performance

Fig 204: Core Objectives of the Market Study

Fig 205: Research Approach

Fig 206: Analysis Flow

Fig 207: Quality Control Flow

Frequently asked questions

  • What will be the digital payment market size in 2023?

    The digital payment market size globally by transaction value will be $2,476.8 trillion in 2023.

  • What is the digital payment market growth rate?

    The digital payment market is expected to grow at a CAGR of 14.3% over the forecast period (2023-2030).

  • What are the key digital payment market drivers?

    Convenience and security offered by digital payments along with the globalization of ecommerce are some of the major factors driving the digital payment market growth.

  • What are the key digital payment market segments?

    Mode of Payment: Digital Wallet, Credit Card, Debit Card, Online Banking, Others

    End-use Industry: Retail, Hospitality, Entertainment, Healthcare, Others

  • Which are the leading digital payment companies globally?

    The leading digital payment companies are Alibaba Group Holding Ltd, American Express Co, Apple Inc, Google LLC, Mastercard Inc, PayPal Holdings Inc, Visa Inc, Discover Financial Services, ACI Worldwide Inc, Amazon.com Inc, Fiserv Inc, One97 Communications Ltd., Samsung Electronics Co Ltd, Fidelity National Information Services Inc, and The Western Union Co.

  • Is there a third level of segmentation in the report?

    GlobalData’s focus is on providing reliable and accurate data that is supported by robust research methodology. Our reports undergo rigorous quality checks and are based on primary and secondary research sources, ensuring that the numbers and insights provided are trustworthy.  However, despite the best efforts to gather comprehensive data, there could be instances where the available data is limited, making it challenging to provide third level segmentation. In such cases, GlobalData may choose to provide high-level insights and general trends rather than forcing segmentation that may not be backed by sufficient data. This approach ensures that the report’s overall quality and credibility are maintained.

Currency USD
$3,950

Can be used by individual purchaser only

$7,950

Can be shared globally by unlimited users within the purchasing corporation e.g. all employees of a single company


Undecided about purchasing this report?

Enquire Before Buying Request a Free Sample

Get in touch to find out about multi-purchase discounts

reportstore@globaldata.com
Tel +44 20 7947 2745

Every customer’s requirement is unique. With over 220,000 construction projects tracked, we can create a tailored dataset for you based on the types of projects you are looking for. Please get in touch with your specific requirements and we can send you a quote.

Sample Report

We are confident about Digital Payments Market Size, Share, Trends and Analysis by Region, Mode of Payment, Industry and Segment Forecast to 2030 report's unique quality. However, we want you to make the most beneficial decision for your business, so we offer free sample pages to help you:

  • Assess the relevance of the report
  • Evaluate the quality of the report
  • Justify the cost

Download your copy of the sample report and make an informed decision about whether the full report will provide you with the insights and information you need.

Below is a sample report to understand what you are buying

See what our customers are saying

“The GlobalData platform is our go-to tool for intelligence services. GlobalData provides an easy way to access comprehensive intelligence data around multiple sectors, which essentially makes it a one-for-all intelligence platform, for tendering and approaching customers.

GlobalData is very customer orientated, with a high degree of personalised services, which benefits everyday use. The highly detailed project intelligence and forecast reports can be utilised across multiple departments and workflow scopes, from operational to strategic level, and often support strategic decisions. GlobalData Analytics and visualisation solutions has contributed positively when preparing management presentations and strategic papers.”

Business Intelligence & Marketing Manager, SAL Heavy Lift

“COVID-19 has caused significant interference to our business and the COVID-19 intelligence from GlobalData has helped us reach better decisions around strategy. These two highlights have helped enormously to understand the projections into the future concerning our business units, we also utilise the project database to source new projects for Liebherr-Werk to use as an additional source to pitch for new business.”

Market Analyst & Management, Liebherr-Werk

Your daily news has saved me a lot of time and keeps me up-to-date with what is happening in the market, I like that you almost always have a link to the source origin. We also use your market data in our Strategic Business Process to support our business decisions. By having everything in one place on the Intelligence Center it has saved me a lot of time versus looking on different sources, the alert function also helps with this.

Head of Key Accounts, Saab AB

Having used several other market research companies, I find that GlobalData manages to provide that ‘difficult-to-get’ market data that others can’t, as well as very diverse and complete consumer surveys.

Marketing Intelligence Manager, Portugal Foods

Our experience with GlobalData has been very good, from the platform itself to the people. I find that the analysts and the account team have a high level of customer focus and responsiveness and therefore I can always rely on. The platform is more holistic than other providers. It is convenient and almost like a one stop shop. The pricing suite is highly competitive and value for our organisation.

I like reports that inform new segments such as the analysis on generation Z, millennials, the impact of COVID 19 to our banking customers and their new channel habits. Secondly the specialist insight on affluent sector significantly increases our understanding about this group of customers. The combination of those give us depth and breadth of the evolving market.

I’m in the business of answering and helping people make decisions so with the intelligence center I can do that, effectively and efficiently. I can share quickly key insights that answer and satisfy our country stakeholders by giving them many quality studies and primary research about competitive landscape beyond the outlook of our bank. It helps me be seen as an advisory partner and that makes a big difference. A big benefit of our subscription is that no one holds the whole data and because it allows so many people, so many different parts of our organisation have access, it enables all teams to have the same level of knowledge and decision support.

Head of Customer Insight and Research, Standard Chartered

“I know that I can always rely on Globaldata’s work when I’m searching for the right consumer and market insights. I use Globaldata insights to understand the changing market & consumer landscape and help create better taste & wellbeing solutions for our customers in food, beverage and healthcare industries.

Globaldata has the right data and the reports are of very high quality compared to your competitors. Globaldata not only has overall market sizes & consumer insights on food & beverages but also provides insights at the ingredient & flavour level. That is key for B2B companies like Givaudan. This way we understand our customers’ business and also gain insight to our unique industry”

Head of Consumer Sensory Insights, Givaudan

GlobalData provides a great range of information and reports on various sectors that is highly relevant, timely, easy to access and utilise.  The reports and data dashboards help engagement with clients; they provide valuable industry and market insights that can enrich client conversations and can help in the shaping of value propositions. Moreover, using GlobalData products has helped increase my knowledge of the finance sector, the players within it, and the general threats and opportunities.

I find the consumer surveys that are carried out to be extremely beneficial and not something I have seen anywhere else. They provided an insightful view of why and which consumers take (or don’t) particular financial products. This can help shape conversations with clients to ensure they make the right strategic decisions for their business.

One of the challenges I have found is that data in the payments space is often piecemeal. With GD all of the data I need is in one place, but it also comes with additional market reports that provide useful extra context and information. Having the ability to set-up alerts on relevant movements in the industry, be it competitors or customers, and have them emailed directly to me, ensures I get early sight of industry activity and don’t have to search for news.

Senior Account Manager, TSYS
Financial Services
New
Worldline - Competitor Profile
$350 | March 2024
Financial Services
New
Bulgaria Cards and Payments - Opportunities and Risks to 2028
$2,750 | April 2024
Go even deeper with GlobalData Intelligence Center

Every Company Report we produce is powered by the GlobalData Intelligence Center.

Subscribing to our intelligence platform means you can monitor developments at Digital Payments Market Size, Share, Trends and Analysis by Region, Mode of Payment, Industry and Segment Forecast to 2030 in real time.

  • Access a live Digital Payments Market Size, Share, Trends and Analysis by Region, Mode of Payment, Industry and Segment Forecast to 2030 dashboard for 12 months, with up-to-the-minute insights.
  • Fuel your decision making with real-time deal coverage and media activity.
  • Turn insights on financials, deals, products and pipelines into powerful agents of commercial advantage.