
Accessing the in-depth insight from the ‘Digital Twins Market’ report can help you:
- Make informed decisions about investments, partnerships, and product development
- Identify your competitors positioning to stay ahead in the market
- Identify segments and get an understanding of various stakeholders across different stages of the entire value chain
- Identify major verticals and their use cases
- Anticipate expected changes in demand and adjust your business development strategies
- Identify potential areas of disruption
- Identify potential regions and countries for growth opportunities
How is our ‘Digital Twins Market Analysis Report’ different from other reports in the market?
- Provides comprehensive market sizing information at a segment level for over 20 countries, including historical and forecast analysis for the period 2019-2030, helping to make informed investment decisions and identify new growth and market entry opportunities. Our market sizing numbers are supported by robust research methodology and subject matter experts.
- Offers detailed segmentation by product/service – software and services, and key vertical segments – Manufacturing, Construction, Energy, Medical & Pharmaceutical, Defense, Utilities, Transportation & Logistics, and Others and their use cases helping to identify areas for investment or partnership opportunities.
- A detailed value chain while identifying the key incumbents and disruptors at each layer that includes details on companies that offer connectivity, data, twin platform, application, and services. The report helps businesses identify ways to optimize their operations, reduce costs, and enhance their competitive advantage.
- The report’s analysis of the latest trends and dynamics impacting the digital twin market, including M&A/venture financing deals, hiring trends, and social media trends, enables businesses to stay up-to-date with the latest developments in the industry, and to anticipate and respond to changes in demand.
- The report provides competitor market positioning (categorizing players as flagbearers, experimenters, contenders, and specialists) offering digital twin software and servicesin the market. This enables businesses to identify key competitors and assess their strengths and weaknesses.
We recommend this valuable source of information to anyone involved in:
- OEM Digital Twin Manufacturers
- Software Providers
- Managed Service Providers
- Data Management /Business Intelligence Companies
- Augmented Reality and Virtual Reality Companies
- Visualization and Streaming Analytics Companies
- Venture Capitalists/Private Equity/Investment Banks
- Edge Computing and Cloud HPC Infrastructure Companies
- AEC Firms
- Engineering, Procurement, and Construction (EPC) Companies
- Consulting Firms
Digital Twin Market Report Overview
The digital twin market size was valued at $17.5 billion in 2023. The market will grow at a CAGR of 36.3% over the forecast period. The following are some of the key highlights of the digital twin market:
- The adoption of predictive maintenance software tools integrated with digital twin capabilities is anticipated to bode well for the market growth over the next few years.
- The digital twin market growth is primarily driven by the increasing adoption of enabling technologies in the manufacturing and construction sector.
- Additionally, technological advancements in Building Information Modelling (BIM), simulation software, and visualization software by integrating with digital twin capabilities are expected to favor the market growth over the next few years.
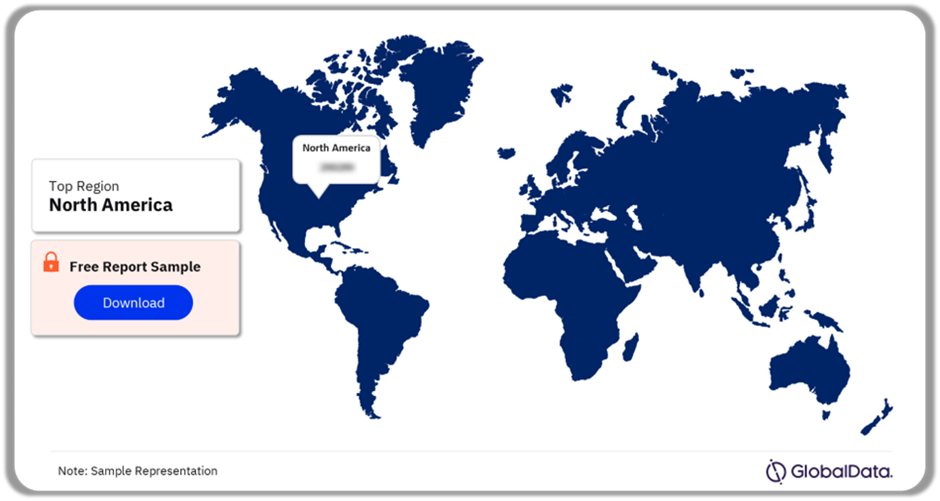
- North America digital twin market accounted for the highest share in 2023.
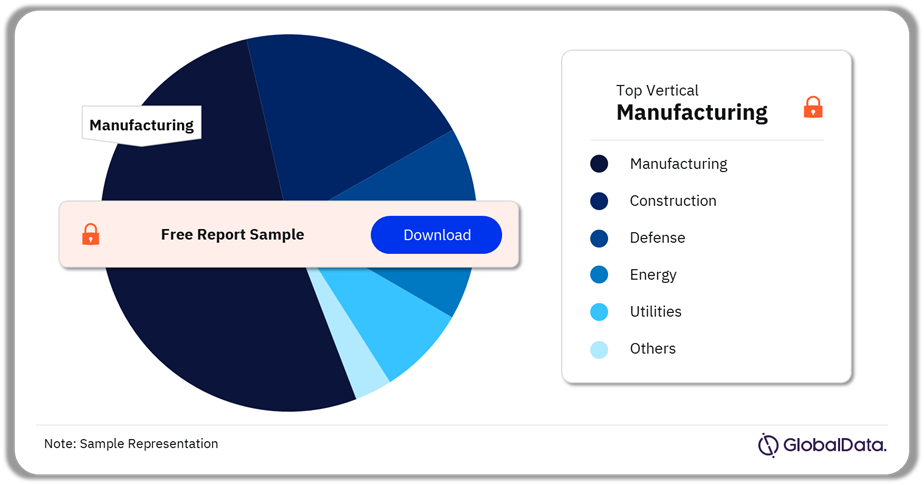
- Manufacturing was the leading vertical of the market in 2023.
Digital Twin Market Outlook, 2023-2030 ($ billion)
 Buy the Full Report for More Insights on the Digital Twin Market Forecast, Download a Free Report Sample
The digital twin market encapsulates software/platform that is used to create a virtual representation of a component, asset, system, process, or enterprise. The visual representation of these types of digital twins is carried out by various enabling technologies such as Enterprise IoT platforms, asset performance management software, analytics software, or simulation tools created by various software vendors and service providers. The market also features service revenue generated by software vendors and third-party service providers offering digital twin software services.
| Market Size 2023 | $17.5 billion |
| Market Size 2030 | $154.0 billion |
| CAGR (2022-2030) | 36.3% |
| Forecast Period | 2022-2030 |
| Historic Period | 2019-2021 |
| Report Scope & Coverage | Revenue Forecast, Competitive Index, and Growth Trends |
| Product/Service Segment |
Software and Service |
| Vertical Segment |
Manufacturing, Construction, Medical Devices & Pharmaceutical Defense, Transportation & Logistics, Energy, Utilities, and Others |
| Key Companies |
Ansys Inc, Autodesk Inc; Amazon Web Services (AWS), Bentley Systems Inc, Dassault Systèmes SE, GE Digital, IBM Corporation, Microsoft Corporation, Siemens AG, and Schneider Electric. |
| Enquire & Decide | Discover the perfect solution for your business needs. Enquire now and let us help you make an informed decision before making a purchase. |
Digital Twin Market Segmentation by Vertical
Based on the vertical segment, the digital twin market has been categorized into manufacturing, construction, medical devices & pharmaceutical, defense, transportation & logistics, energy, utilities, and others. The manufacturing segment is inclusive of the automotive and aerospace sector. The soaring adoption of simulation software and CAD tools for product design and maintenance, repair, and overhaul (MRO) is expected to drive the digital twin market growth over the forecast period. Also, the integration of asset performance management with AI and Machine Learning to detect failures in real-time is expected to drive the Digital twin market growth over the forecast period.
Digital Twin Market Share by Vertical, 2023 (%)
Buy the Full Report Fetch Sample PDF for Segment-Specific Revenues and shares, Download a Free Report Sample
The construction segment is expected to grow at a CAGR of 37.4% over the forecast period. The construction segment is inclusive of architectural, engineering, and construction firms that specialize in the building of physical structures such as houses, industrial plants, roads, and bridges. Favorable government initiatives to develop smart cities with help of the Public-Private-Partnership (PPP) model are expected to drive the market growth over the forecast period.
Digital Twin Market Analysis by Region
North America accounted for the largest market share of over 40% of the overall market size. The regional demand was led by the US accounted for $5.0 billion in 2023 of the market. The increasing demand for innovative solutions, notably in advanced automation use cases in the manufacturing sector is anticipated to drive the digital twin market demand over the forecast period.
Digital Twin Market Analysis by Region, 2023 (%)
 Buy the Full Report for More Regional Digital Twin Market Insights, Download a Free Report Sample
Europe accounted for over 20% of the market share in the global digital twin market, with a forecasted growth rate exceeding 30% from 2022 to 2030. The region is primarily driven by the increasing adoption of digital twins by government agencies to develop sustainable public infrastructure.
Digital Twin Market - Competitive Landscape
The digital twin is an extremely fragmented market. It is characterized by Original Equipment Manufacturers (OEMs) such as General Electric and Siemens, software vendors such as AWS, Dassault Systemes, and service providers such as TCS, Wipro, and Capgemini, and vertical-specific digital twin vendors. Innovation and partnership are key growth initiatives carried out by the vendors in this space.
Digital Twin Vendor Growth Innovation Index

For Further Analysis on the Competitive Landscape of Digital Twin Market, Download a Free Report Sample
The digital twin market is an amalgamation of various enabling technology providers such as virtual and augmented reality, visualization, and simulation software. Merger and acquisition (M&A) activity in this space has been steadily increasing over recent years, though the actual number of dedicated deals centered around digital twins remains small. For instance, in December 2022, Hexagon AB, a global leader in digital reality solutions, acquired LocLab, one of the 3D digital twin content providers. The acquisition enabled the former company to integrate its HxDR, a cloud-based storage, visualization, and collaboration platform, with the latter company’s 3D digital content. The integration will further enhance its existing platform to deploy its solution within urban planning, transportation, and construction among others.
Leading Players in the Digital Twin Market
- Ansys Inc
- Autodesk Inc
- Amazon Web Services (AWS)
- Bentley Systems Inc
- Dassault Systèmes SE
- GE Digital
- IBM Corporation
- Microsoft Corporation
- Siemens AG
- Schneider Electric
Other Digital Twin Market Vendors Mentioned
Robert Bosch GmbH, Atkins (SNC-Lavalin Group Inc), Atos SE, Wipro Ltd, Unity Technologies, TCS Ltd, Hitachi Ltd, Infosys Ltd, Accenture Plc, Capgemini SE, NTT Data, Cognizant, ABB Ltd, DXC Technology, LTI Mindtree, EPAM, Virtusa, Happiest Minds, Neewee, NavVis, QiO Technologies, Cognite, GFT Technologies, SenSat, PETRA Data Science, Swim, Synavision, Pratiti Technologies, Braincube, Cybertwin, and Eigen
Buy the Full Report for More Insights into the Leading Digital Twin Market Players, Download a Free Report Sample
Digital Twin Market Research Overview
| Market Size 2023 | $17.5 billion |
| Market Size 2030 | $154.0 billion |
| CAGR (2022-2030) | 36.3% |
| Forecast Period | 2022-2030 |
| Historic Period | 2019-2021 |
| Report Scope & Coverage | Revenue Forecast, Competitive Index, and Growth Trends |
| Product/Service Segment | Software and Service |
| Vertical Segment | Manufacturing, Construction, Medical Devices & Pharmaceutical
Defense, Transportation & Logistics, Energy, Utilities, and Others |
| Key Companies | Ansys Inc, Autodesk Inc; Amazon Web Services (AWS), Bentley Systems Inc, Dassault Systèmes SE, GE Digital, IBM Corporation, Microsoft Corporation, Siemens AG, and Schneider Electric. |
Digital Twin Market Scope
GlobalData Plc has segmented the digital twin market report by product/service, vertical, and region:
Digital Twin Product/Service Outlook (Revenue, USD Billion, 2019-2030)
- Service
- Software
Digital Twin Vertical Outlook (Revenue, USD Billion, 2019-2030)
- Manufacturing
- Construction
- Medical & Pharmaceutical
- Defense
- Transportation & Logistics
- Energy
- Utilities
- Others
Digital Twin Regional Outlook (Revenue, USD Billion, 2019-2030)
- North America
- US
- Canada
- Europe
- Germany
- UK
- Italy
- France
- Spain
- Netherlands
- Sweden
- Rest of Europe
- Asia Pacific
- China
- Japan
- India
- Australia
- South Korea
- Rest of Asia Pacific
- South & Central America
- Brazil
- Mexico
- Argentina
- Rest of South & Central America
- Middle East & Africa
- United Arab Emirates (UAE)
- Saudi Arabia
- South Africa
- Rest of Middle East & Africa
The market intelligence report provides an in-depth analysis of the following –
- Digital twin market outlook: analysis as well as historical figures and forecasts of revenue opportunities for product/service, vertical, and regional segments.
- The competitive landscape: an examination of the positioning of leading players of software and service vendors in the digital twin market.
- Porter’s five forces analysis: demonstrates the strength of suppliers and buyers along with market competition in the market.
- PEST analysis: provides analysis for macroeconomic and technological factors in the digital twin market.
- Company snapshots: analysis of the market position of leading vendors in the digital twin market.
- Underlying assumptions behind our published base-case forecasts, as well as potential market developments that would alter, either positively or negatively, our base-case outlook.
Reasons to buy
- This market intelligence report offers a thorough, forward-looking analysis of the global digital twin market product/service, and vertical their key opportunities in a concise format to help executives build proactive and profitable growth strategies.
- Accompanying GlobalData’s Forecast products, the report examines the assumptions and drivers behind ongoing and upcoming trends in the digital twin market.
- The report highlights the product/service segment (software and services) and key vertical segments (manufacturing, construction, medical devices & pharmaceutical, defense, transportation & logistics, energy, utilities, and others)
- With more than 50 figures and tables, the report is designed for an executive-level audience, boasting presentation quality.
- The report provides an easily digestible market assessment for decision-makers built around in-depth information gathered from local market players, which enables executives to quickly get up to speed with the current and emerging trends in the digital twin market.
- The broad perspective of the report coupled with comprehensive, actionable detail will help technology stakeholders, service providers, and other market players succeed in growing the digital twin market globally.
Key Stakeholders
Table of Contents
Tables
Table 1 Key Trends Overview
Table 2 Global Digital Twin Market, 2019 – 2030 (US$ Billion)
Table 3 Global Digital Twin Market By Product/Service, 2019 – 2030 (US$ Billion)
Table 4 Global Digital Twin Market By Vertical, 2019 – 2030 (US$ Billion)
Table 5 North America Digital Twin Market By Product/Service, 2019 – 2030 (US$ Billion)
Table 6 North America Digital Twin Market By Vertical, 2019 – 2030 (US$ Billion)
Table 7 US Digital Twin Market By Product/Service, 2019 – 2030 (US$ Billion)
Table 8 US Digital Twin Market By Vertical, 2019 – 2030 (US$ Billion)
Table 9 Canada Digital Twin Market By Product/Service, 2019 – 2030 (US$ Billion)
Table 10 Canada Digital Twin Market By Vertical, 2019 – 2030 (US$ Billion)
Table 11 Europe Digital Twin Market By Product/Service, 2019 – 2030 (US$ Billion)
Table 12 Europe Digital Twin Market By Vertical, 2019 – 2030 (US$ Billion)
Table 13 UK Digital Twin Market By Product/Service, 2019 – 2030 (US$ Billion)
Table 14 UK Digital Twin Market By Vertical, 2019 – 2030 (US$ Billion)
Table 15 Germany Digital Twin Market By Product/Service, 2019 – 2030 (US$ Billion)
Table 16 Germany Digital Twin Market By Vertical, 2019 – 2030 (US$ Billion)
Table 17 France Digital Twin Market By Product/Service, 2019 – 2030 (US$ Billion)
Table 18 France Digital Twin Market By Vertical, 2019 – 2030 (US$ Billion)
Table 19 Italy Digital Twin Market By Product/Service, 2019 – 2030 (US$ Billion)
Table 20 Italy Digital Twin Market By Vertical, 2019 – 2030 (US$ Billion)
Table 21 Spain Digital Twin Market By Product/Service, 2019 – 2030 ($Bn)
Table 22 Spain Digital Twin Market By Vertical, 2019 – 2030 (US$ Billion)
Table 23 Netherlands Digital Twin Market By Product/Service, 2019 – 2030 (US$ Billion)
Table 24 Netherlands Digital Twin Market By Vertical, 2019 – 2030 (US$ Billion)
Table 25 Sweden Digital Twin Market By Product/Service, 2019 – 2030 (US$ Billion)
Table 26 Sweden Digital Twin Market By Vertical, 2019 – 2030 (US$ Billion)
Table 27 Rest of Europe Digital Twin Market By Product/Service, 2019 – 2030 (US$ Billion)
Table 28 Rest of Europe Digital Twin Market By Vertical, 2019 – 2030 (US$ Billion)
Table 29 South & Central America Digital Twin Market By Product/Service, 2019 – 2030 (US$ Billion)
Table 30 South & Central America Digital Twin Market By Vertical, 2019 – 2030 (US$ Billion)
Table 31 Brazil Digital Twin Market By Product/Service, 2019 – 2030 (US$ Billion)
Table 32 Brazil Digital Twin Market By Vertical, 2019 – 2030 (US$ Billion)
Table 33 Argentina Digital Twin Market By Product/Service, 2019 – 2030 (US$ Billion)
Table 34 Argentina Digital Twin Market By Vertical, 2019 – 2030 (US$ Billion)
Table 35 Mexico Digital Twin Market By Product/Service, 2019 – 2030 (US$ Billion)
Table 36 Mexico Digital Twin Market By Vertical, 2019 – 2030 (US$ Billion)
Table 37 Rest of South & Central America Digital Twin Market By Product/Service, 2019 – 2030 (US$ Billion)
Table 38 Rest of South & Central America Digital Twin Market By Vertical, 2019 – 2030 (US$ Billion)
Table 39 Asia Pacific Digital Twin Market By Product/Service, 2019 – 2030 (US$ Billion)
Table 40 Asia Pacific Digital Twin Market By Vertical, 2019 – 2030 (US$ Billion)
Table 41 China Digital Twin Market By Product/Service, 2019 – 2030 (US$ Billion)
Table 42 China Digital Twin Market By Vertical, 2019 – 2030 (US$ Billion)
Table 43 India Digital Twin Market By Product/Service, 2019 – 2030 (US$ Billion)
Table 44 India Digital Twin Market By Vertical, 2019 – 2030 (US$ Billion)
Table 45 Japan Digital Twin Market By Product/Service, 2019 – 2030 (US$ Billion)
Table 46 Japan Digital Twin Market By Vertical, 2019 – 2030 (US$ Billion)
Table 47 Australia Digital Twin Market By Product/Service, 2019 – 2030 (US$ Billion)
Table 48 Australia Digital Twin Market By Vertical, 2019 – 2030 (US$ Billion)
Table 49 South Korea Digital Twin Market By Product/Service, 2019 – 2030 (US$ Billion)
Table 50 South Korea Digital Twin Market By Vertical, 2019 – 2030 (US$ Billion)
Table 51 Rest of Asia Pacific Digital Twin Market By Product/Service, 2019 – 2030 (US$ Billion)
Table 52 Rest of Asia Pacific Digital Twin Market By Vertical, 2019 – 2030 (US$ Billion)
Table 53 Middle East & Africa Digital Twin Market By Product/Service, 2019 – 2030 (US$ Billion)
Table 54 Middle East & Africa Digital Twin Market By Vertical, 2019 – 2030 (US$ Billion)
Table 55 UAE Digital Twin Market By Product/Service, 2019 – 2030 (US$ Billion)
Table 56 UAE Digital Twin Market By Vertical, 2019 – 2030 (US$ Billion)
Table 57 Saudi Arabia Digital Twin Market By Product/Service, 2019 – 2030 (US$ Billion)
Table 58 Saudi Arabia Digital Twin Market By Vertical, 2019 – 2030 (US$ Billion)
Table 59 South Africa Digital Twin Market By Product/Service, 2019 – 2030 (US$ Billion)
Table 60 South Africa Digital Twin Market By Vertical, 2019 – 2030 (US$ Billion)
Table 61 Rest of Middle East & Africa Digital Twin Market By Product/Service, 2019 – 2030 (US$ Billion)
Table 62 Rest of Middle East & Africa Digital Twin Market By Vertical, 2019 – 2030 (US$ Billion)
Graphs
Fig.1 Digital Twin Market Snapshot, 2022-2030
Fig.2 Digital Twin Sector Overview
Fig.3 Digital Twin Market Segmentation
Fig.4 Digital Twin Industry Value Chain Analysis
Fig.5 Digital Twin Connectivity Layer: Key Leaders & Disruptors
Fig.6 Digital Twin Data Layer: Key Leaders & Disruptors
Fig.7 Digital Twin Platform: Key Leaders & Disruptors
Fig.8 Digital Twin App: Key Leaders & Disruptors
Fig.9 Digital Twin Service Layer: Key Leaders & Disruptors
Fig.10 Global Digital Twin Market Porter’s Five Force Model and Market Competition Analysis
Fig.11 Global Digital Twin Market PEST Analysis
Fig.12 Digital Twin Market – Key Drivers Impact Analysis
Fig.13 Digital Twin– Key Market Challenges/Impediments Impact Analysis
Fig.14 Digital Twin Market– M&A Activity Dashboard
Fig.15 Digital Twin Market – Patent Activity Dashboard
Fig.16 Digital Twin Market– Job Analytics Dashboard
Fig.17 Digital Twin Market – Venture Financing Dashboard
Fig.18 Digital Twin Market– Social Media Analytics Dashboard
Fig.19 Global Digital Twin Market – Revenue Opportunity Forecast, 2019-2030 (US$ Billion)
Fig.20 Global Digital Twin Market By Product/Service, 2019-2030 (US$ Billion)
Fig.21 Global Digital Twin Market By Vertical, 2019-2030 (US$ Billion)
Fig.22 Digital Twin Market– Regional Market Overview
Fig.23 North America Digital Twin Market Snapshot
Fig.24 North America Digital Twin Market By Product/Service – 2022 & 2030, Revenue (US$ Bn) and Market Share (%)
Fig.25 North America Digital Twin Market By Vertical– 2022 & 2030, Revenue (US$ Bn) and Market Share (%)
Fig.26 US Digital Twin Market Product/Service – 2022 & 2030, Revenue (US$ Bn) and Market Share (%)
Fig.27 US Digital Twin Market By Vertical– 2022 & 2030, Revenue (US$ Bn) and Market Share (%)
Fig.28 Canada Digital Twin Market Product/Service – 2022 & 2030, Revenue (US$ Bn) and Market Share (%)
Fig.29 Canada Digital Twin Market By Vertical– 2022 & 2030, Revenue (US$ Bn) and Market Share (%)
Fig.30 Europe Digital Twin Market Snapshot
Fig.31 Europe Digital Twin Market By Product/Service – 2022 & 2030, Revenue (US$ Bn) and Market Share (%)
Fig.32 Europe Digital Twin Market By Vertical– 2022 & 2030, Revenue (US$ Bn) and Market Share (%)
Fig.33 UK Digital Twin Market Product/Service – 2022 & 2030, Revenue (US$ Bn) and Market Share (%)
Fig.34 UK Digital Twin Market By Vertical– 2022 & 2030, Revenue (US$ Bn) and Market Share (%)
Fig.35 Germany Digital Twin Market Product/ Service Share – 2022& 2030 (%)
Fig.36 Germany Digital Twin Market By Vertical– 2022 & 2030, Revenue (US$ Bn) and Market Share (%)
Fig.37 France Digital Twin Market Product/Service – 2022 & 2030, Revenue (US$ Bn) and Market Share (%)
Fig.38 France Digital Twin Market By Vertical– 2022 & 2030, Revenue (US$ Bn) and Market Share (%)
Fig.39 Italy Digital Twin Market Product/Service – 2022 & 2030, Revenue (US$ Bn) and Market Share (%)
Fig.40 Italy Digital Twin Market By Vertical– 2022 & 2030, Revenue (US$ Bn) and Market Share (%)
Fig.41 Spain Digital Twin Market Product/Service – 2022 & 2030, Revenue (US$ Bn) and Market Share (%)
Fig.42 Spain Digital Twin Market By Vertical– 2022 & 2030, Revenue (US$ Bn) and Market Share (%)
Fig.43 Netherlands Digital Twin Market Product/Service – 2022 & 2030, Revenue (US$ Bn) and Market Share (%)
Fig.44 Netherlands Digital Twin Market By Vertical– 2022 & 2030, Revenue (US$ Bn) and Market Share (%)
Fig.45 Sweden Digital Twin Market Product/Service – 2022 & 2030, Revenue (US$ Bn) and Market Share (%)
Fig.46 Sweden Digital Twin Market By Vertical– 2022 & 2030, Revenue (US$ Bn) and Market Share (%)
Fig.47 Rest of Europe Digital Twin Market Product/Service – 2022 & 2030, Revenue (US$ Bn) and Market Share (%)
Fig.48 Rest of Europe Digital Twin Market By Vertical– 2022 & 2030, Revenue (US$ Bn) and Market Share (%)
Fig.49 South & Central America Digital Twin Market Snapshot
Fig.50 South & Central America Digital Twin Market By Product/Service – 2022 & 2030, Revenue (US$ Bn) and Market Share (%)
Fig.51 South & Central America Digital Twin Market By Vertical– 2022 & 2030, Revenue (US$ Bn) and Market Share (%)
Fig.52 Brazil Digital Twin Market Product/Service – 2022 & 2030, Revenue (US$ Bn) and Market Share (%)
Fig.53 Brazil Digital Twin Market By Vertical– 2022 & 2030, Revenue (US$ Bn) and Market Share (%)
Fig.54 Argentina Digital Twin Market Product/Service – 2022 & 2030, Revenue (US$ Bn) and Market Share (%)
Fig.55 Argentina Digital Twin Market By Vertical– 2022 & 2030, Revenue (US$ Bn) and Market Share (%)
Fig.56 Mexico Digital Twin Market Product/Service – 2022 & 2030, Revenue (US$ Bn) and Market Share (%)
Fig.57 Mexico Digital Twin Market By Vertical– 2022 & 2030, Revenue (US$ Bn) and Market Share (%)
Fig.58 Rest of South & Central America Digital Twin Market Product/Service – 2022 & 2030, Revenue (US$ Bn) and Market Share (%)
Fig.59 Rest of South & Central America Digital Twin Market By Vertical– 2022 & 2030, Revenue (US$ Bn) and Market Share (%)
Fig.60 Asia Pacific Digital Twin Market Snapshot
Fig.61 Asia Pacific Digital Twin Market By Product/Service – 2022 & 2030, Revenue (US$ Bn) and Market Share (%)
Fig.62 Asia Pacific Digital Twin Market By Vertical– 2022 & 2030, Revenue (US$ Bn) and Market Share (%)
Fig.63 China Digital Twin Market Product/Service – 2022 & 2030, Revenue (US$ Bn) and Market Share (%)
Fig.64 China Digital Twin Market By Vertical– 2022 & 2030, Revenue (US$ Bn) and Market Share (%)
Fig.65 India Digital Twin Market Product/Service – 2022 & 2030, Revenue (US$ Bn) and Market Share (%)
Fig.66 India Digital Twin Market By Vertical– 2022 & 2030, Revenue (US$ Bn) and Market Share (%)
Fig.67 Japan Digital Twin Market Product/Service – 2022 & 2030, Revenue (US$ Bn) and Market Share (%)
Fig.68 Japan Digital Twin Market By Vertical– 2022 & 2030, Revenue (US$ Bn) and Market Share (%)
Fig.69 Australia Digital Twin Market Product/Service – 2022 & 2030, Revenue (US$ Bn) and Market Share (%)
Fig.70 Australia Digital Twin Market By Vertical– 2022 & 2030, Revenue (US$ Bn) and Market Share (%)
Fig.71 South Korea Digital Twin Market Product/Service – 2022 & 2030, Revenue (US$ Bn) and Market Share (%)
Fig.72 South Korea Digital Twin Market By Vertical– 2022 & 2030, Revenue (US$ Bn) and Market Share (%)
Fig.73 Rest of Asia Pacific Digital Twin Market Product/Service – 2022 & 2030, Revenue (US$ Bn) and Market Share (%)
Fig.74 Rest of Asia Pacific Digital Twin Market By Vertical– 2022 & 2030, Revenue (US$ Bn) and Market Share (%)
Fig.75 Middle East & Africa Digital Twin Market Snapshot
Fig.76 Middle East & Africa Digital Twin Market By Product/Service – 2022 & 2030, Revenue (US$ Bn) and Market Share (%)
Fig.77 Middle East & Africa Digital Twin Market By Vertical– 2022 & 2030, Revenue (US$ Bn) and Market Share (%)
Fig.78 UAE Digital Twin Market Product/Service – 2022 & 2030, Revenue (US$ Bn) and Market Share (%)
Fig.79 UAE Digital Twin Market By Vertical– 2022 & 2030, Revenue (US$ Bn) and Market Share (%)
Fig.80 Saudi Arabia Digital Twin Market Product/Service – 2022 & 2030, Revenue (US$ Bn) and Market Share (%)
Fig.81 Saudi Arabia Digital Twin Market By Vertical– 2022 & 2030, Revenue (US$ Bn) and Market Share (%)
Fig.82 South Africa Digital Twin Market Product/Service – 2022 & 2030, Revenue (US$ Bn) and Market Share (%)
Fig.83 South Africa Digital Twin Market By Vertical– 2022 & 2030, Revenue (US$ Bn) and Market Share (%)
Fig.84 Rest of Middle East & Africa Digital Twin Market Product/Service – 2022 & 2030, Revenue (US$ Bn) and Market Share (%)
Fig.85 Rest of Middle East & Africa Digital Twin Market By Vertical– 2022 & 2030, Revenue (US$ Bn) and Market Share (%)
Fig.86 Digital Twin Software: Growth-Innovation Matrix
Fig.87 Digital Twin Services: Growth-Innovation Matrix
Fig.88 Information Procurement
Fig.89 Data Analysis Model
Fig.90 Research Methodology