High Performance Computing Market Trends and Analysis by Region, Component, Deployment, Application and Segment Forecast to 2026

Powered by

Access in-depth insight and stay ahead of the market

Accessing the in-depth insights from the High Performance Computing’ report can help:

  • Understand the current and future state of the market, allowing businesses to make informed decisions about market entry, product development, and investments.
  • Identify competitors’ capabilities to stay ahead in the market.
  • Identify segments and get an understanding of various stakeholders across different stages of the entire value chain.
  • Anticipate changes in demand and adjust the business development strategies.
  • Identify potential regions and countries for growth opportunities.

How is our High Performance Computingreport different from other reports in the market?

  • The report presents in-depth market sizing and forecasts at a segment level for more than 20 countries, including historical and forecast analysis for the period 2019-2026 for market assessment.
  • The report offers detailed segmentation by:
    • Component Server, Storage, Network, Software, Services, and Cloud
    • Deployment On-Premise and Cloud
  • Application Academic, Government, Manufacturing, Bio-Sciences, Financial Services, and Others
  • Region – North America, Europe, Asia-Pacific, South & Central America, and Middle East & Africa
  • The report covers key market drivers and challenges impacting the high performance computing
  • The report covers dashboard analytics for M&A deals, venture financing/private equity deals, job activity, social media analysis, and patent activities.
  • The value chain in the report can help identify key companies involved in each stage of the value chain. This helps in understanding the competitive landscape and potential collaboration opportunities.
  • Competitive profiling of key companies in the market to provide a deeper understanding of industry competition.
  • The report can be a valuable tool for stakeholders to improve their operations, increase customer satisfaction, and maximize profitability by analyzing the latest high performance computing drivers, tracking market growth and demand, and evaluating the existing competition in the market.

We recommend this valuable source of information to:

  • ​Cloud Computing Solutions Providers
  • ​Cloud Service Providers
  • ​Edge Computing Solutions Providers
  • ​Data Center Solution Providers
  • ​Server Providers
  • ​Storage Manufacturers
  • ​Networking Equipment Providers
  • ​HPC Cloud Service Providers
  • ​Investment and VC firms
  • ​Consultants

Get a Snapshot of the High Performance Computing Market, Download a Free Report Sample

High Performance Computing Report Overview

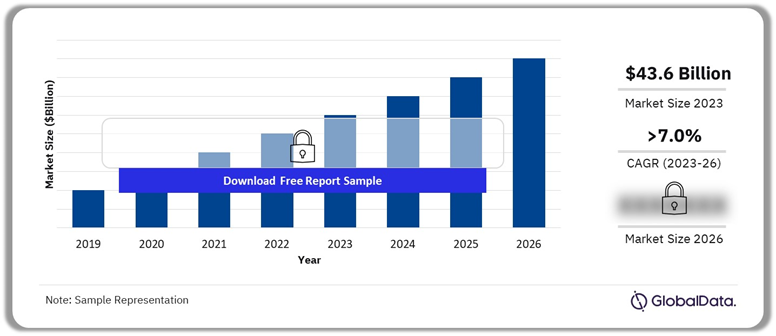
The high performance computing (HPC) market size was valued at $43.6 billion in 2023 and is expected to grow at a compound annual growth rate (CAGR) of more than 7% over the forecast period. The surge in cloud adoption, coupled with the emergence of HPC as a Service (HPCaaS) and the rise of edge computing, is expected to boost the demand for high-performance computing. Additionally, the continuous evolution of cutting-edge technologies such as machine learning (ML), the Internet of Things (IoT), and AI further augments the need for extensive data processing, making them key drivers of HPC demand in the coming years. These advancements offer scalability, cost-effectiveness, faster processing speeds, and reduced latency, enhancing the overall value proposition of high-performance computing solutions.

AI-enhanced HPC systems are driving advancements across various industries, including healthcare, finance, manufacturing, and more. For example, in healthcare, AI-powered HPC systems can analyze medical imaging data to assist in diagnosing diseases with greater accuracy and speed. In finance, these systems can perform intricate risk assessments and predictive analytics to optimize investment strategies. The synergy between AI and HPC also extends to scientific research, where complex simulations and modeling tasks can benefit from AI-driven optimization and acceleration.

High Performance Computing Market Outlook, 2019-2026 ($Billion)

High Performance Computing Market Outlook, 2019-2026 ($Billion)

Buy the Full Report for Additional Insights on the High Performance Computing Market Forecast

Download a Free Report Sample

High performance edge computing presents a potential solution to overcome the limitations of both local high performance computing data centers and cloud based HPC deployments. Edge computing involves deploying and utilizing computer processing near the data source. The benefits of edge computing include enhanced performance and cost savings achieved by developing, hosting, and powering applications closer to their point of consumption. Industries such as retail, live entertainment, and gaming with low-latency requirements are leveraging HPC at the edge for robust processing power, driving market expansion.

Traditionally, high performance computing systems were confined to local data centers; however, new solutions are emerging, with cloud-based HPC being the most prominent among them. Market trends indicate that the cloud is experiencing rapid growth within the HPC segment, becoming one of the fastest-growing business units. The shift towards cloud-based solutions is driven by the flexibility they offer. Cloud computing can augment in-house infrastructure capacity or enhance a company’s agility, particularly for those operating across multiple sites. The cloud provides a flexible method for overseeing IT infrastructure, facilitating the modernization of enterprise applications, and propelling market growth.

Despite the advantages of cloud computing, certain operations may not be suitable for the cloud environment. Some clients who initially migrated their high performance computing operations to the cloud have later transitioned some or all operations back on-premise due to concerns regarding security, regulations, and latency/performance issues. To maximize the benefits of the cloud while addressing its limitations, vendors are now offering hybrid solutions where HPC operations are distributed between on-premise and cloud environments.

Market Size (2023) $43.6 billion
CAGR (2023 – 2026) >7%
Forecast Period 2023-2026
Historic Data 2019-2021
Report Scope & Coverage Revenue Forecast, Value Chain, Company Profiles, Market Drivers & Challenges, Technology Trends, COVID-19 Impact Analysis, and PORTER’s
Component Server, Storage, Network, Software, Services, and Cloud
Application Academic, Government, Manufacturing, Bio-Sciences, Financial Services, and Others
Deployment On-Premise and Cloud
Region North America, Europe, Asia-Pacific, South & Central America, and Middle East & Africa
Key Countries US, Canada, UK, Germany, France, Italy, Spain, Netherlands, Switzerland, China, India, Japan, Singapore, South Korea, Australia, Saudi Arabia, UAE, South Africa, Brazil, and Mexico
Key Companies Hewlett Packard Enterprise Co., Lenovo Group Ltd., International Business Machines Corp. (IBM), Dell Technologies Inc., Huawei Investment & Holding Co. Ltd., Fujitsu Ltd., Intel Corp., Advanced Micro Devices Inc., NVIDIA Corp., and STMicroelectronics NV.
Enquire & Decide Discover the perfect solution for your business needs. Enquire now and let us help you make an informed decision before making a purchase.

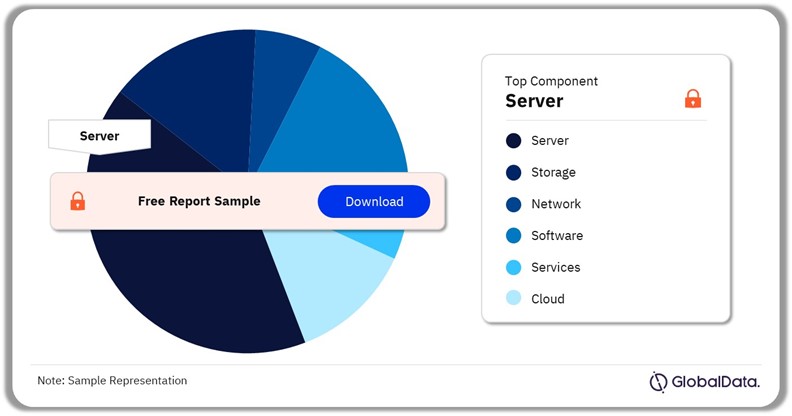
High Performance Computing Market Segmentation by Component

The market is segregated by component into server, storage, network, software, services, and cloud. While cloud and network are important, servers tend to hold the major market share. Servers are expected to dominate the market in 2023 and maintain the leading position over the forecast period. High performance computing servers are extensively used in scientific research for simulations, modeling, and data analysis in fields such as physics, chemistry, biology, and climate science. Researchers require high-performance computing capabilities to tackle complex problems and run simulations that demand significant computational resources.

Organizations are turning to cloud-based HPC solutions to meet their computational needs for tasks such as simulations, data analysis, machine learning, and scientific research. Cloud providers are also investing in specialized hardware and software offerings tailored for high performance computing workloads, further driving the adoption of cloud computing in this domain. As a result, the cloud component is gaining traction within the high performance computing market.

High Performance Computing Market Share by Component, 2023 (%)

High Performance Computing Market Share by Component, 2023 (%)

Buy the Full Report for More Information on High Performance Computing Market By Component

Download a Free Report Sample

Moreover, the services component is forecast to experience moderate growth. This sector encompasses maintenance and repair, system engineering, system integration, training, programming, and other related services. The emergence of high performance computing cloud solutions has increased the demand for services, particularly in training and programming. Nevertheless, as prominent companies have already established their cloud services, the services segment is anticipated to exhibit flat growth throughout the forecast period.

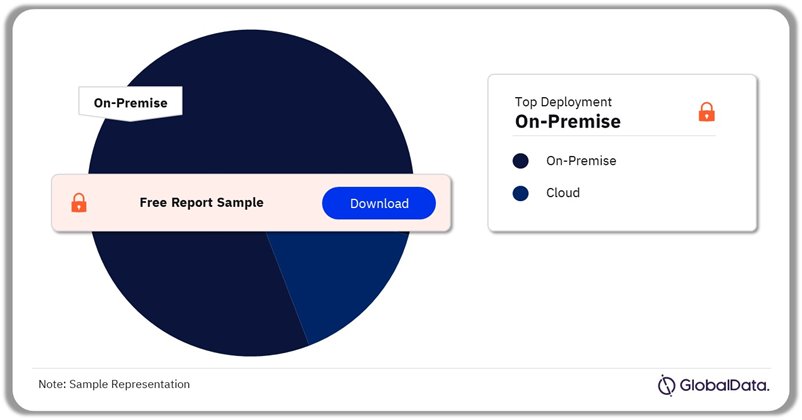
High Performance Computing Market Segmentation by Deployment

High-performance computing can be implemented through two primary methods: on-premises and cloud-based solutions. Traditionally, major market competitors have favored on-premises HPC systems, which offer a sense of familiarity and control. Concerns surrounding data security and privacy when utilizing cloud services have prompted many companies to lean towards on-premises setups. With a growing emphasis on data protection, the demand for on-premises HPC systems is expected to remain robust in the foreseeable future.

In an on-premises HPC deployment, organizations build and manage their own HPC clusters, comprising servers, storage solutions, and related infrastructure. This approach affords direct oversight of hardware, security, and customization options. However, it necessitates substantial initial investments and ongoing maintenance efforts.

High Performance Computing Market Share by Deployment, 2023 (%)

High Performance Computing Market Share by Deployment, 2023 (%)

Buy the Full Report for More Information on High Performance Computing Market By Deployment

Download a Free Report Sample

Furthermore, cloud-based high performance computing systems are anticipated to experience rapid expansion during the forecast period. The cloud offers a more agile framework for managing IT infrastructure, especially in facilitating the modernization of enterprise applications. For instance, Azure provides extensive support for diverse HPC architectures, including computer-aided engineering services, computational fluid dynamics simulations, and 3D video rendering. These solutions are scalable to thousands of compute cores, offering the flexibility to extend existing on-premises clusters.

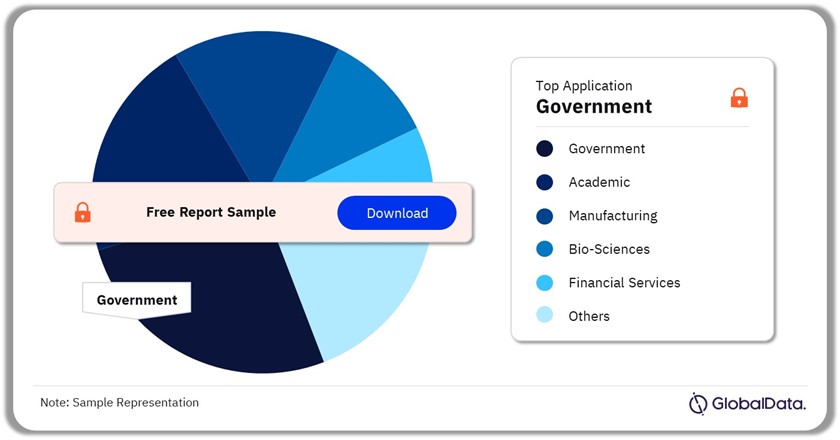
High Performance Computing Market Segmentation by Application

In the high performance computing market, the bio-sciences domain stands out for its significant utilization of HPC solutions, contributing notably to the segment’s robust expansion. This sector encompasses genomics, bioinformatics, pharmaceutical research, drug discovery, and proteomics applications. Research remains a cornerstone of high performance computing application, particularly evident in the medical and biosciences fields. Notably, powerful computing clusters have played a pivotal role during the COVID-19 pandemic, facilitating vital scientific endeavors such as virus understanding and vaccine development.

In addition, high performance computing finds extensive use in the government sector. Governments utilize HPC for tasks such as cryptography, simulating nuclear weapon designs, analyzing intelligence data, and developing defense technologies. HPC helps in creating sophisticated models for strategic planning and predicting potential threats. Furthermore, governments fund a significant portion of scientific research, which often requires heavy computational resources.

High Performance Computing Market Share by Application, 2023 (%)

High Performance Computing Market Share by Application, 2023 (%)

Buy the Full Report for More Information on High Performance Computing Market By Application

Download a Free Report Sample

Within the private sector, financial services emerge as prominent consumers of high performance computing capabilities. Investment firms leverage this technology for predictive analysis of stock market trends and high-frequency trading. Additionally, banks utilize HPC to bolster fraud detection measures. Centralized fraud detection systems aggregate data from diverse sources, enabling proactive identification and mitigation of cyber threats while fortifying data privacy. These systems must possess robust anomaly detection capabilities to ensure efficacy.

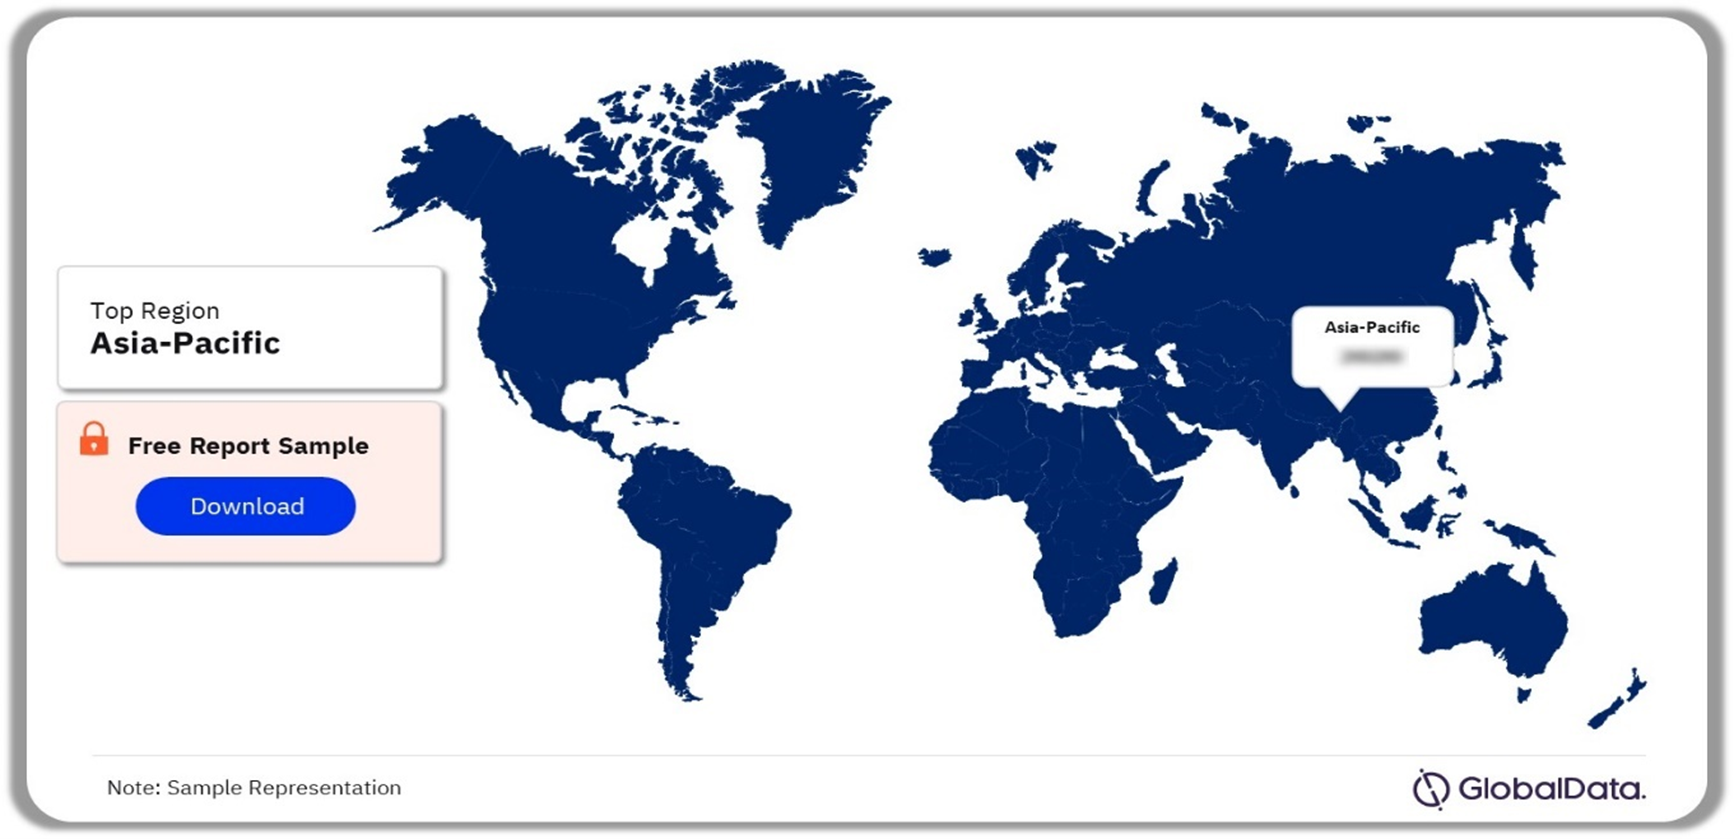
High Performance Computing Market Analysis by Region

Asia-Pacific held the highest share in 2023, capturing over 30% of the overall market size. China and Japan led the regional market, collectively accounting for over 50% of the regional market in 2023. Some of the leading high performance computing companies come from China, including Huawei, Lenovo, and Inspur. The Chinese government perceives dominance in supercomputing as integral to safeguarding national security.

In North America, early adoption of cutting-edge technology empowers companies to introduce new products to the market swiftly. The US held a significant share of the high performance computing market’s revenue in 2023, leveraging its extensive network of data centers to facilitate seamless integration of HPC solutions. In July 2023, the United States Department of Energy (DOE) introduced a fresh initiative designed to connect industry partners with the high performance computing resources and expertise housed within DOE’s National Laboratories. The main objective was to boost material performance and propel progress in manufacturing methods, paving the way for a more inclusive and sustainable energy future.

High Performance Computing Market Share by Region, 2023 (%)

High Performance Computing Market Share by Region, 2023 (%)

Buy the Full Report for Regional Insights into the High Performance Computing Market

Download a Free Report Sample

The high performance computing market in Europe is experiencing consistent growth and garnering greater attention. Leading the regional market are Germany, the UK, and France, together commanding more than 50% of the market share in 2023. These countries are home to top-tier research institutions, universities, and tech firms that are spearheading advancements in HPC across diverse sectors such as academia, government, healthcare, finance, automotive, and aerospace.

High Performance Computing Market – Competitive Landscape

Competition in the high performance computing industry is characterized by the presence of multiple vendors operating across different layers of the value chain. Companies operating in the market have a stronghold in their respective solution offerings. For instance, HPE and Dell Technologies have a strong hold across all the components of an HPC cluster. Companies such as DataDirect Networks, Juniper Networks, and Seagate Technology focus on specific hardware equipment.

M&As play a significant role in shaping the HPC market. In April 2024, ceτi AI, a decentralized AI infrastructure company, announced its acquisition of Canadian firm Big Energy Investments Inc., which specializes in strategic investments in HPC infrastructure. Similarly, in August 2023, atNorth, a provider of colocation and high-performance computing services, expanded its presence in the Nordics by acquiring Gompute, a provider of HPC and data center services.

In the ever-evolving landscape of HPC, strategic partnerships are essential for maintaining a competitive advantage. For instance, in November 2023, Netweb Technologies, an OEM in high-end computing, joined forces with NVIDIA to leverage the potential of high-performance computing and AI. This collaboration aims to address demanding workloads in HPC, data science, large language models, edge computing, enterprise AI, and design and simulation.

Leading Companies in the High Performance Computing Market

  • Hewlett Packard Enterprise Co.
  • Lenovo Group Ltd.
  • International Business Machines Corp. (IBM)
  • Dell Technologies Inc.
  • Huawei Investment & Holding Co Ltd.
  • Fujitsu Ltd.
  • Intel Corp.
  • Advanced Micro Devices Inc.
  • NVIDIA Corp.
  • STMicroelectronics NV

Other High Performance Computing Vendors Mentioned

Inspur Software Co. Ltd., Atos SE, NEC Corp., Seagate Technology Holdings Plc, Netapp Inc., Google LLC, Huawei Investment & Holding Co. Ltd., Amazon Web Services Inc., Cisco Systems Inc., Oracle Corp., VMware Inc., Juniper Networks Inc.

Buy the Full Report to Know More About Leading High Performance Computing Companies

Download a Free Report Sample

High Performance Computing Market Segments and Scope

GlobalData Plc has segmented the high performance computing market report by component, deployment, application, and region:

High Performance Computing (HPC) Component Outlook (Revenue, $Million, 2019-2026)

  • Server
  • Storage
  • Network
  • Software
  • Services
  • Cloud

High Performance Computing (HPC) Deployment Outlook (Revenue, $Million, 2019-2026)

  • On-Premise
  • Cloud

High Performance Computing (HPC) Application Outlook (Revenue, $Million, 2019-2026)

  • Academic
  • Government
  • Manufacturing
  • Bio-Sciences
  • Financial Services
  • Others

High Performance Computing (HPC) Regional Outlook (Revenue, $Million, 2019-2026)

  • North America
  • US
  • Canada
  • Europe
  • UK
  • Germany
  • France
  • Italy
  • Spain
  • Netherlands
  • Switzerland
  • Rest of Europe
  • Asia Pacific
  • China
  • India
  • Japan
  • Australia
  • South Korea
  • Singapore
  • Rest of Asia Pacific
  • South & Central America
  • Brazil
  • Mexico
  • Rest of South & Central America
  • Middle East & Africa
  • United Arab Emirates (UAE)
  • Saudi Arabia
  • South Africa
  • Rest of Middle East & Africa

Scope

This report provides overview and service addressable market for High Performance Computing (HPC).

It identifies the key trends impacting growth of the market over the next 12 to 24 months, split into four categories: technology trends and macroeconomic trends

It includes global market forecasts for the High Performance Computing (HPC) industry and analysis of patents, company filings, and hiring trends.

It contains details of M&A and VF deals in the big data space.

The detailed value chain consists of five main aspects: component, equipment, data center solutions, and end users.

Reasons to Buy

  • This market intelligence report offers a thorough, forward-looking analysis of the HPC market, components, application, and key opportunities in a concise format to help executives build proactive and profitable growth strategies.
  • Accompanying GlobalData’s Forecast products, the report examines the assumptions and drivers behind ongoing and upcoming trends in high performance computing market.
  • The report also highlights key component segments (Server, Storage, Networking, Software, Services, and Cloud)
  • The report also highlights key deployment segments (On-Premise and Cloud)
  • The report also highlights key application segments (Academic, Government, Manufacturing, Bio-Sciences, Financial Services, and Others)
  • With more than 100 charts and tables, the report is designed for an executive-level audience, boasting presentation quality.
  • The report provides an easily digestible market assessment for decision-makers built around in-depth information gathered from local market players, which enables executives to quickly get up to speed with the current and emerging trends in High Performance Computing (HPC)
  • The broad perspective of the report coupled with comprehensive, actionable detail will help high performance computing stakeholders, service providers, and other high performance computing players succeed in growing of the high performance computing  market globally.

Table of Contents

CHAPTER 01 Executive Summary

1.1 High Performance Computing (HPC) Market Snapshot, 2021 & 2026 (US$ Mn)

CHAPTER 02 Research Scope & Segmentation

CHAPTER 03 High Performance Computing (HPC) Industry Trend Analysis

3.1 High Performance Computing (HPC) – Industry Value Chain

3.1.1 COMPONENTS

3.1.1.1 Semiconductors

3.1.2 EQUIPMENT

3.1.2.1 Servers

3.1.2.2 Storage Devices

3.1.2.3 Network Equipment

3.1.3 DATA CENTER SOLUTIONS

3.1.3.1 On-premise HPC Data Center

3.1.3.2 HPC in the Cloud

3.1.3.3 HPC Deployed at the Edge

3.1.3.4 Hybrid Solutions

3.1.4 END-USERS

3.1.4.1 Government Academia

3.1.4.2 Financial Services

3.1.4.3 Oil & Gas

3.1.4.4 Entertainment

3.1.4.5 Retail

3.1.4.6 Manufacturing

3.2 High Performance Computing (HPC) – Market Variables & Impact Analysis

3.2.1 MARKET DRIVER ANALYSIS

3.2.1.1 Growing Popularity of Edge Computing

3.2.1.2 Artificial Intelligence (AI) and Machine Learning (ML) Technologies Stemming the Growth of HPC

3.2.1.3 Increasing Adoption of Cloud Computing Coupled with the Provision of HPC as a Service (HPCaaS)

3.2.1.4 Emerging Use Cases Expected to Propel Market Growth

3.2.2 MARKET RESTRAINTS/CHALLENGES ANALYSIS

3.2.2.1 High Initial Cost Coupled with Lack of Expertise

3.2.2.2 Data Security Concerns

3.3 High Performance Computing (HPC) Market Structure – PORTER’s Analysis

3.4 High Performance Computing (HPC) Market Structure – PEST Analysis

3.5 Big Data – Mergers & Acquisitions (M&A), 2018 – 2022 (YTD)

3.5.1 M&A ACTIVITY DASHBOARD

3.6 Big Data – Patent Analysis, 2018 – 2022 (YTD)

3.6.1 PATENT ANALYTICS DASHBOARD

3.7 Big Data – Job Analysis, 2021

3.7.1 JOB ANALYTICS DASHBOARD

3.8 Big Data – Venture Financing Analysis, 2018 – 2022 (YTD)

3.8.1 VENTURE FINANCING DASHBOARD

3.9 Big Data – Social Media Analysis, 2018 – 2022 (YTD)

3.9.1 SOCIAL MEDIA ANALYTICS DASHBOARD

3.10 Technology Trends

3.11 Macroeconomic Trends

3.12 High Performance Computing (HPC) Market – COVID-19 Impact Analysis

3.13 High Performance Computing (HPC) Timeline

CHAPTER 04 Global HPC Market Revenue Opportunity

4.1 Global Market Revenue Snapshot, 2019 – 2026 (US$ Mn)

4.2 Global HPC Market by Deployment, 2019 – 2026 (US$ Mn)

4.3 Global HPC Market by Component, 2019 – 2026 (US$ Mn)

4.4 Global HPC Market by Application, 2019 – 2026 (US$ Mn)

CHAPTER 05 HPC Market Regional Outlook

5.1 HPC Market – Regional Deep Dive, 2019 – 2026 (US$ Mn)

5.2 North America HPC Market Snapshot, 2019 – 2026 (US$ Mn)

5.2.1 NORTH AMERICA HPC MARKET SIZE & FORECASTS, 2019 – 2026 (US$ MN)

5.2.1.1 North America HPC Market by Deployment, 2019 – 2026 (US$ Mn)

5.2.1.2 North America HPC Market by Component, 2019 – 2026 (US$ Mn)

5.2.1.3 North America HPC Market by Application, 2019 – 2026 (US$ Mn)

5.2.2 US HPC MARKET SIZE & FORECASTS, 2019 – 2026 (US$ MN)

5.2.2.1 US HPC Market by Deployment, 2019 – 2026 (US$ Mn)

5.2.2.2 US HPC Market by Component, 2019 – 2026 (US$ Mn)

5.2.2.3 US HPC Market by Application, 2019 – 2026 (US$ Mn)

5.2.3 CANADA HPC MARKET SIZE & FORECASTS, 2019 – 2026 (US$ MN)

5.2.3.1 Canada HPC Market by Deployment, 2019 – 2026 (US$ Mn)

5.2.3.2 Canada HPC Market by Component, 2019 – 2026 (US$ Mn)

5.2.3.3 Canada HPC Market by Application, 2019 – 2026 (US$ Mn)

5.3 Europe HPC Market Snapshot, 2019 – 2026 (US$ Mn)

5.3.1 EUROPE HPC MARKET SIZE & FORECASTS, 2019 – 2026 (US$ MN)

5.3.1.1 Europe HPC Market by Deployment, 2019 – 2026 (US$ Mn)

5.3.1.2 Europe HPC Market by Component, 2019 – 2026 (US$ Mn)

5.3.1.3 Europe HPC Market by Application, 2019 – 2026 (US$ Mn)

5.3.2 UK HPC MARKET SIZE & FORECASTS, 2019 – 2026 (US$ MN)

5.3.2.1 UK HPC Market by Deployment, 2019 – 2026 (US$ Mn)

5.3.2.2 UK HPC Market by Component, 2019 – 2026 (US$ Mn)

5.3.2.3 UK HPC Market by Application, 2019 – 2026 (US$ Mn)

5.3.3 GERMANY HPC MARKET SIZE & FORECASTS, 2019 – 2026 (US$ MN)

5.3.3.1 Germany HPC Market by Deployment, 2019 – 2026 (US$ Mn)

5.3.3.2 Germany HPC Market by Component, 2019 – 2026 (US$ Mn)

5.3.3.3 Germany HPC Market by Application, 2019 – 2026 (US$ Mn)

5.3.4 FRANCE HPC MARKET SIZE & FORECASTS, 2019 – 2026 (US$ MN)

5.3.4.1 France HPC Market by Deployment, 2019 – 2026 (US$ Mn)

5.3.4.2 France HPC Market by Component, 2019 – 2026 (US$ Mn)

5.3.4.3 France HPC Market by Application, 2019 – 2026 (US$ Mn)

5.3.5 ITALY HPC MARKET SIZE & FORECASTS, 2019 – 2026 (US$ MN)

5.3.5.1 Italy HPC Market by Deployment, 2019 – 2026 (US$ Mn)

5.3.5.2 Italy HPC Market by Component, 2019 – 2026 (US$ Mn)

5.3.5.3 Italy HPC Market by Application, 2019 – 2026 (US$ Mn)

5.3.6 NETHERLANDS HPC MARKET SIZE & FORECASTS, 2019 – 2026 (US$ MN)

5.3.6.1 Netherlands HPC Market by Deployment, 2019 – 2026 (US$ Mn)

5.3.6.2 Netherlands HPC Market by Component, 2019 – 2026 (US$ Mn)

5.3.6.3 Netherlands HPC Market by Application, 2019 – 2026 (US$ Mn)

5.3.8 RUSSIA HPC MARKET SIZE & FORECASTS, 2019 – 2026 (US$ MN)

5.3.8.1 Russia HPC Market by Deployment, 2019 – 2026 (US$ Mn)

5.3.8.2 Russia HPC Market by Component, 2019 – 2026 (US$ Mn)

5.3.8.3 Russia HPC Market by Application, 2019 – 2026 (US$ Mn)

5.3.9 SPAIN HPC MARKET SIZE & FORECASTS, 2019 – 2026 (US$ MN)

5.3.9.1 Spain HPC Market by Deployment, 2019 – 2026 (US$ Mn)

5.3.9.2 Spain HPC Market by Component, 2019 – 2026 (US$ Mn)

5.3.9.3 Spain HPC Market by Application, 2019 – 2026 (US$ Mn)

5.3.10 SWITZERLAND HPC MARKET SIZE & FORECASTS, 2019 – 2026 (US$ MN)

5.3.10.1 Switzerland HPC Market by Deployment, 2019 – 2026 (US$ Mn)

5.3.10.2 Switzerland HPC Market by Component, 2019 – 2026 (US$ Mn)

5.3.10.3 Switzerland HPC Market by Application, 2019 – 2026 (US$ Mn)

5.3.11 REST OF EUROPE HPC MARKET SIZE & FORECASTS, 2019 – 2026 (US$ MN)

5.3.11.1 Rest of Europe HPC Market by Deployment, 2019 – 2026 (US$ Mn)

5.3.11.2 Rest of Europe HPC Market by Component, 2019 – 2026 (US$ Mn)

5.3.11.3 Rest of Europe HPC Market by Application, 2019 – 2026 (US$ Mn)

5.4 Asia Pacific HPC Market Snapshot, 2019 – 2026 (US$ Mn)

5.4.1 ASIA PACIFIC HPC MARKET SIZE & FORECASTS, 2019 – 2026 (US$ MN)

5.4.1.1 Asia Pacific HPC Market by Deployment, 2019 – 2026 (US$ Mn)

5.4.1.2 Asia Pacific HPC Market by Component, 2019 – 2026 (US$ Mn)

5.4.1.3 Asia Pacific HPC Market by Application, 2019 – 2026 (US$ Mn)

5.4.2 CHINA HPC MARKET SIZE & FORECASTS, 2019 – 2026 (US$ MN)

5.4.2.1 China HPC Market by Deployment, 2019 – 2026 (US$ Mn)

5.4.2.2 China HPC Market by Component, 2019 – 2026 (US$ Mn)

5.4.2.3 China HPC Market by Application, 2019 – 2026 (US$ Mn)

5.4.3 INDIA HPC MARKET SIZE & FORECASTS, 2019 – 2026 (US$ MN)

5.4.3.1 India HPC Market by Deployment, 2019 – 2026 (US$ Mn)

5.4.3.2 India HPC Market by Component, 2019 – 2026 (US$ Mn)

5.4.3.3 India HPC Market by Application, 2019 – 2026 (US$ Mn)

5.4.4 JAPAN HPC MARKET SIZE & FORECASTS, 2019 – 2026 (US$ MN)

5.4.4.1 Japan HPC Market by Deployment, 2019 – 2026 (US$ Mn)

5.4.4.2 Japan HPC Market by Component, 2019 – 2026 (US$ Mn)

5.4.4.3 Japan HPC Market by Application, 2019 – 2026 (US$ Mn)

5.4.5 AUSTRALIA HPC MARKET SIZE & FORECASTS, 2019 – 2026 (US$ MN)

5.4.5.1 Australia HPC Market by Deployment, 2019 – 2026 (US$ Mn)

5.4.5.2 Australia HPC Market by Component, 2019 – 2026 (US$ Mn)

5.4.5.3 Australia HPC Market by Application, 2019 – 2026 (US$ Mn)

5.4.6 SINGAPORE HPC MARKET SIZE & FORECASTS, 2019 – 2026 (US$ MN)

5.4.6.1 Singapore HPC Market by Deployment, 2019 – 2026 (US$ Mn)

5.4.6.2 Singapore HPC Market by Component, 2019 – 2026 (US$ Mn)

5.4.6.3 Singapore HPC Market by Application, 2019 – 2026 (US$ Mn)

5.4.7 SOUTH KOREA HPC MARKET SIZE & FORECASTS, 2019 – 2026 (US$ MN)

5.4.7.1 South Korea HPC Market by Deployment, 2019 – 2026 (US$ Mn)

5.4.7.2 South Korea HPC Market by Component, 2019 – 2026 (US$ Mn)

5.4.7.3 South Korea HPC Market by Application, 2019 – 2026 (US$ Mn)

5.4.8 REST OF ASIA PACIFIC HPC MARKET SIZE & FORECASTS, 2019 – 2026 (US$ MN)

5.4.8.1 Rest of Asia Pacific HPC Market by Deployment, 2019 – 2026 (US$ Mn)

5.4.8.2 Rest of Asia Pacific HPC Market by Component, 2019 – 2026 (US$ Mn)

5.4.8.3 Rest of Asia Pacific HPC Market by Application, 2019 – 2026 (US$ Mn)

5.5 Central & South America HPC Market Snapshot, 2019 – 2026 (US$ Mn)

5.5.1 CENTRAL AND SOUTH AMERICA HPC MARKET SIZE & FORECASTS, 2019 – 2026 (US$ MN)

5.5.1.1 Central and South America HPC Market by Deployment, 2019 – 2026 (US$ Mn)

5.5.1.2 Central and South America HPC Market by Component, 2019 – 2026 (US$ Mn)

5.5.1.3 Central and South America HPC Market by Application, 2019 – 2026 (US$ Mn)

5.5.2 BRAZIL HPC MARKET SIZE & FORECASTS, 2019 – 2026 (US$ MN)

5.5.2.1 Brazil HPC Market by Deployment, 2019 – 2026 (US$ Mn)

5.5.2.2 Brazil HPC Market by Component, 2019 – 2026 (US$ Mn)

5.5.2.3 Brazil HPC Market by Application, 2019 – 2026 (US$ Mn)

5.5.3 MEXICO HPC MARKET SIZE & FORECASTS, 2019 – 2026 (US$ MN)

5.5.3.1 Mexico HPC Market by Deployment, 2019 – 2026 (US$ Mn)

5.5.3.2 Mexico HPC Market by Component, 2019 – 2026 (US$ Mn)

5.5.3.3 Mexico HPC Market by Application, 2019 – 2026 (US$ Mn)

5.5.4 REST OF CENTRAL AND SOUTH AMERICA HPC MARKET SIZE & FORECASTS, 2019 – 2026 (US$ MN)

5.5.4.1 Rest of Central and South America HPC Market by Deployment, 2019 – 2026 (US$ Mn)

5.5.4.2 Rest of Central and South America HPC Market by Component, 2019 – 2026 (US$ Mn)

5.5.4.3 Rest of Central and South America HPC Market by Application, 2019 – 2026 (US$ Mn)

5.6 Middle East & Africa HPC Market Snapshot, 2019 – 2026 (US$ Mn)

5.6.1 MIDDLE EAST AND AFRICA HPC MARKET SIZE & FORECASTS, 2019 – 2026 (US$ MN)

5.6.1.1 Middle East and Africa HPC Market by Deployment, 2019 – 2026 (US$ Mn)

5.6.1.2 Middle East and Africa HPC Market by Component, 2019 – 2026 (US$ Mn)

5.6.1.3 Middle East and Africa HPC Market by Application, 2019 – 2026 (US$ Mn)

5.6.2 UAE HPC MARKET SIZE & FORECASTS, 2019 – 2026 (US$ MN)

5.6.2.1 UAE HPC Market by Deployment, 2019 – 2026 (US$ Mn)

5.6.2.2 UAE HPC Market by Component, 2019 – 2026 (US$ Mn)

5.6.2.3 UAE HPC Market by Application, 2019 – 2026 (US$ Mn)

5.6.3 SAUDI ARABIA HPC MARKET SIZE & FORECASTS, 2019 – 2026 (US$ MN)

5.6.3.1 Saudi Arabia HPC Market by Deployment, 2019 – 2026 (US$ Mn)

5.6.3.2 Saudi Arabia HPC Market by Component, 2019 – 2026 (US$ Mn)

5.6.3.3 Saudi Arabia HPC Market by Application, 2019 – 2026 (US$ Mn)

5.6.4 SOUTH AFRICA HPC MARKET SIZE & FORECASTS, 2019 – 2026 (US$ MN)

5.6.4.1 South Africa HPC Market by Deployment, 2019 – 2026 (US$ Mn)

5.6.4.2 South Africa HPC Market by Component, 2019 – 2026 (US$ Mn)

5.6.4.3 South Africa HPC Market by Application, 2019 – 2026 (US$ Mn)

5.6.5 REST OF MIDDLE EAST AND AFRICA HPC MARKET SIZE & FORECASTS, 2019 – 2026 (US$ MN)

5.6.5.1 Rest of Middle East and Africa HPC Market by Deployment, 2019 – 2026 (US$ Mn)

5.6.5.2 Rest of Middle East and Africa HPC Market by Component, 2019 – 2026 (US$ Mn)

5.6.5.3 Rest of Middle East and Africa HPC Market by Application, 2019 – 2026 (US$ Mn)

CHAPTER 06 Global HPC Competitive Landscape

6.1 HPC Competitive Index

6.2 HPC Vendor Company Profiles

6.2.1 HEWLETT PACKARD ENTERPRISE CO

6.2.1.1 Overview and Financial Performance

6.2.1.2 Recent Developments and Innovations

6.2.2 LENOVO GROUP LTD

6.2.2.1 Overview and Financial Performance

6.2.2.2 Recent Developments and Innovations

6.2.3 INTERNATIONAL BUSINESS MACHINES CORP

6.2.3.1 Overview and Financial Performance

6.2.3.2 Recent Developments and Innovations

6.2.4 DELL TECHNOLOGIES INC

6.2.4.1 Overview and Financial Performance

6.2.4.2 Recent Developments and Innovations

6.2.5 HUAWEI INVESTMENT & HOLDING CO LTD

6.2.5.1 Overview and Financial Performance

6.2.5.2 Recent Developments and Innovations

6.2.6 FUJITSU LTD

6.2.6.1 Overview and Financial Performance

6.2.6.2 Recent Developments and Innovations

6.2.7 INTEL CORP

6.2.7.1 Overview and Financial Performance

6.2.7.2 Recent Developments and Innovations

6.2.8 ADVANCED MICRO DEVICES INC

6.2.8.1 Overview and Financial Performance

6.2.8.2 Recent Developments and Innovations

6.2.9 NVIDIA CORP

6.2.9.1 Overview and Financial Performance

6.2.9.2 Recent Developments and Innovations

6.2.10 STMICROELECTRONICS NV

6.2.10.1 Overview and Financial Performance

6.2.10.2 Recent Developments and Innovations

6.3 Other HPC Market Participants:

6.3.1 INSPUR SOFTWARE CO LTD

6.3.2 ATOS SE

6.3.3 NEC CORP

6.3.4 DATADIRECT NETWORKS INC

6.3.5 SEAGATE TECHNOLOGY HOLDINGS PLC

6.3.6 NETAPP INC

6.3.7 GOOGLE LLC

6.3.8 HUAWEI INVESTMENT & HOLDING CO LTD

6.3.9 AMAZON WEB SERVICES INC

6.3.10 CISCO SYSTEMS INC

6.3.11 ORACLE CORP

6.3.12 VMWARE INC

6.3.13 JUNIPER NETWORKS INC

CHAPTER 07 Methodology and Scope

7.1 Information Procurement

7.2 HPC Analysis

7.3 Market Opportunity Forecast – Research Methodology & Formulation

7.4 Competitive Index – Research Methodology & Formulation

Contact Us

Table

Table 1 Key Trends Overview

Table 2 Top 5 Venture Financing Deals by Value

Table 3 Technology Trends

Table 4 Macroeconomics Trends

Table 5 Global HPC Market by Deployment, 2019 – 2026 (US$ Mn)

Table 6 Global HPC Market by Component, 2019 – 2026 (US$ Mn)

Table 7 Global HPC Market by Application, 2019 – 2026 (US$ Mn)

Table 8 North America HPC Market by Deployment, 2019 – 2026 (US$ Mn)

Table 9 North America HPC Market by Component, 2019 – 2026 (US$ Mn)

Table 10 North America HPC Market by Application, 2019 – 2026 (US$ Mn)

Table 11 US HPC Market by Deployment, 2019 – 2026 (US$ Mn)

Table 12 US HPC Market by Component, 2019 – 2026 (US$ Mn)

Table 13 US HPC Market by Application, 2019 – 2026 (US$ Mn)

Table 14 Canada HPC Market by Deployment, 2019 – 2026 (US$ Mn)

Table 15 Canada HPC Market by Component, 2019 – 2026 (US$ Mn)

Table 16 Canada HPC Market by Application, 2019 – 2026 (US$ Mn)

Table 17 Europe HPC Market by Deployment, 2019 – 2026 (US$ Mn)

Table 18 Europe HPC Market by Component, 2019 – 2026 (US$ Mn)

Table 19 Europe HPC Market by Application, 2019 – 2026 (US$ Mn)

Table 20 UK HPC Market by Deployment, 2019 – 2026 (US$ Mn)

Table 21 UK HPC Market by Component, 2019 – 2026 (US$ Mn)

Table 22 UK HPC Market by Application, 2019 – 2026 (US$ Mn)

Table 23 Germany HPC Market by Deployment, 2019 – 2026 (US$ Mn)

Table 24 Germany HPC Market by Component, 2019 – 2026 (US$ Mn)

Table 25 Germany HPC Market by Application, 2019 – 2026 (US$ Mn)

Table 26 France HPC Market by Deployment, 2019 – 2026 (US$ Mn)

Table 27 France HPC Market by Component, 2019 – 2026 (US$ Mn)

Table 28 France HPC Market by Application, 2019 – 2026 (US$ Mn)

Table 29 Italy HPC Market by Deployment, 2019 – 2026 (US$ Mn)

Table 30 Italy HPC Market by Component, 2019 – 2026 (US$ Mn)

Table 31 Italy HPC Market by Application, 2019 – 2026 (US$ Mn)

Table 32 Netherlands HPC Market by Deployment, 2019 – 2026 (US$ Mn)

Table 33 Netherlands HPC Market by Component, 2019 – 2026 (US$ Mn)

Table 34 Netherlands HPC Market by Application, 2019 – 2026 (US$ Mn)

Table 35 Russia HPC Market by Deployment, 2019 – 2026 (US$ Mn)

Table 36 Russia HPC Market by Component, 2019 – 2026 (US$ Mn)

Table 37 Russia HPC Market by Application, 2019 – 2026 (US$ Mn)

Table 38 Spain HPC Market by Deployment, 2019 – 2026 (US$ Mn)

Table 39 Spain HPC Market by Component, 2019 – 2026 (US$ Mn)

Table 40 Spain HPC Market by Application, 2019 – 2026 (US$ Mn)

Table 41 Switzerland HPC Market by Deployment, 2019 – 2026 (US$ Mn)

Table 42 Switzerland HPC Market by Component, 2019 – 2026 (US$ Mn)

Table 43 Switzerland HPC Market by Application, 2019 – 2026 (US$ Mn)

Table 44 Rest of Europe HPC Market by Deployment, 2019 – 2026 (US$ Mn)

Table 45 Rest of Europe HPC Market by Component, 2019 – 2026 (US$ Mn)

Table 46 Rest of Europe HPC Market by Application, 2019 – 2026 (US$ Mn)

Table 47 Asia Pacific HPC Market by Deployment, 2019 – 2026 (US$ Mn)

Table 48 Asia Pacific HPC Market by Component, 2019 – 2026 (US$ Mn)

Table 49 Asia Pacific HPC Market by Application, 2019 – 2026 (US$ Mn)

Table 50 China HPC Market by Deployment, 2019 – 2026 (US$ Mn)

Table 51 China HPC Market by Component, 2019 – 2026 (US$ Mn)

Table 52 China HPC Market by Application, 2019 – 2026 (US$ Mn)

Table 53 India HPC Market by Deployment, 2019 – 2026 (US$ Mn)

Table 54 India HPC Market by Component, 2019 – 2026 (US$ Mn)

Table 55 India HPC Market by Application, 2019 – 2026 (US$ Mn)

Table 56 Japan HPC Market by Deployment, 2019 – 2026 (US$ Mn)

Table 57 Japan HPC Market by Component, 2019 – 2026 (US$ Mn)

Table 58 Japan HPC Market by Application, 2019 – 2026 (US$ Mn)

Table 59 Australia HPC Market by Deployment, 2019 – 2026 (US$ Mn)

Table 60 Australia HPC Market by Component, 2019 – 2026 (US$ Mn)

Table 61 Australia HPC Market by Application, 2019 – 2026 (US$ Mn)

Table 62 Singapore HPC Market by Deployment, 2019 – 2026 (US$ Mn)

Table 63 Singapore HPC Market by Component, 2019 – 2026 (US$ Mn)

Table 64 Singapore HPC Market by Application, 2019 – 2026 (US$ Mn)

Table 65 South Korea HPC Market by Deployment, 2019 – 2026 (US$ Mn)

Table 66 South Korea HPC Market by Component, 2019 – 2026 (US$ Mn)

Table 67 South Korea HPC Market by Application, 2019 – 2026 (US$ Mn)

Table 68 Rest of Asia Pacific HPC Market by Deployment, 2019 – 2026 (US$ Mn)

Table 69 Rest of Asia Pacific HPC Market by Component, 2019 – 2026 (US$ Mn)

Table 70 Rest of Asia Pacific HPC Market by Application, 2019 – 2026 (US$ Mn)

Table 71 Central and South America HPC Market by Deployment, 2019 – 2026 (US$ Mn)

Table 72 Central and South America HPC Market by Component, 2019 – 2026 (US$ Mn)

Table 73 Central and South America HPC Market by Application, 2019 – 2026 (US$ Mn)

Table 74 Brazil HPC Market by Deployment, 2019 – 2026 (US$ Mn)

Table 75 Brazil HPC Market by Component, 2019 – 2026 (US$ Mn)

Table 76 Brazil HPC Market by Application, 2019 – 2026 (US$ Mn)

Table 77 Mexico HPC Market by Deployment, 2019 – 2026 (US$ Mn)

Table 78 Mexico HPC Market by Component, 2019 – 2026 (US$ Mn)

Table 79 Mexico HPC Market by Application, 2019 – 2026 (US$ Mn)

Table 80 Rest of Central and South America HPC Market by Deployment, 2019 – 2026 (US$ Mn)

Table 81 Rest of Central and South America HPC Market by Component, 2019 – 2026 (US$ Mn)

Table 82 Rest of Central and South America HPC Market by Application, 2019 – 2026 (US$ Mn)

Table 83 Middle East and Africa HPC Market by Deployment, 2019 – 2026 (US$ Mn)

Table 84 Middle East and Africa HPC Market by Component, 2019 – 2026 (US$ Mn)

Table 85 Middle East and Africa HPC Market by Application, 2019 – 2026 (US$ Mn)

Table 86 UAE HPC Market by Deployment, 2019 – 2026 (US$ Mn)

Table 87 UAE HPC Market by Component, 2019 – 2026 (US$ Mn)

Table 88 UAE HPC Market by Application, 2019 – 2026 (US$ Mn)

Table 89 Saudi Arabia HPC Market by Deployment, 2019 – 2026 (US$ Mn)

Table 90 Saudi Arabia HPC Market by Component, 2019 – 2026 (US$ Mn)

Table 91 Saudi Arabia HPC Market by Application, 2019 – 2026 (US$ Mn)

Table 92 South Africa HPC Market by Deployment, 2019 – 2026 (US$ Mn)

Table 93 South Africa HPC Market by Component, 2019 – 2026 (US$ Mn)

Table 94 South Africa HPC Market by Application, 2019 – 2026 (US$ Mn)

Table 95 Rest of Middle East and Africa HPC Market by Deployment, 2019 – 2026 (US$ Mn)

Table 96 Rest of Middle East and Africa HPC Market by Component, 2019 – 2026 (US$ Mn)

Table 97 Rest of Middle East and Africa HPC Market by Application, 2019 – 2026 (US$ Mn)

Figures

Fig.1 Market Snapshot, 2021 & 2026

Fig.2 High Performance Computing (HPC) Market Segmentation

Fig.3 High Performance Computing (HPC) – Industry Value Chain Analysis

Fig.4 HPC Value Chain Analysis – Component Leaders & Challengers

Fig.5 HPC Value Chain Analysis – Servers Leaders & Challengers

Fig.6 HPC Value Chain Analysis – Storage Leaders & Challengers

Fig.7 HPC Value Chain Analysis – Networking Equipment Leaders & Challengers

Fig.8 HPC Value Chain Analysis – Data Center Solutions Leaders & Challengers

Fig.9 HPC Value Chain Analysis – Prominent End Users

Fig.10 High Performance Computing (HPC) Market – Key Drivers Impact Analysis

Fig.11 High Performance Computing (HPC) Market – Key Restraints/Challenges Impact Analysis

Fig.12 Global High Performance Computing (HPC) Market – PORTER’s Five Force Analysis

Fig.13 Global High Performance Computing (HPC) Market – PEST Analysis

Fig.14 Big Data – M&A Activity Dashboard

Fig.15 Big Data – Patent Activity Dashboard

Fig.16 Big Data – Job Analytics Dashboard

Fig.17 Big Data – Venture Financing Dashboard

Fig.18 Big Data – Social Media Dashboard

Fig.19 Global HPC Market – Revenue Opportunity Forecast, 2019-2026 (US$ Million)

Fig.20 Global HPC Market by Deployment, 2019 – 2026 (US$ Mn)

Fig.21 Global HPC Market by Component, 2019 – 2026 (US$ Mn)

Fig.22 Global HPC Market by Application, 2019 – 2026 (US$ Mn)

Fig.23 HPC – Market Overview

Fig.24 North America HPC Market Snapshot, 2019 – 2026 (US$ Mn)

Fig.25 North America HPC Market By Deployment Share – 2021 & 2026 ($Mn)

Fig.26 North America HPC By Component Share – 2021 & 2026 ($Mn)

Fig.27 North America HPC By Application Share – 2021 & 2026 ($Mn)

Fig.28 US HPC By Deployment Share – 2021 & 2026 ($Mn)

Fig.29 US HPC By Component Share – 2021 & 2026 ($Mn)

Fig.30 US HPC By Component Share – 2021 & 2026 ($Mn)

Fig.31 Canada HPC By Deployment Share – 2021 & 2026 ($Mn)

Fig.32 Canada HPC By Component Share – 2021 & 2026 ($Mn)

Fig.33 Canada HPC By Component Share – 2021 & 2026 ($Mn)

Fig.34 Europe HPC Market Snapshot, 2019 – 2026 (US$ Mn)

Fig.35 Europe HPC By Deployment Share – 2021 & 2026 ($Mn)

Fig.36 Europe HPC By Component Share – 2021 & 2026 ($Mn)

Fig.37 Europe HPC By Application Share – 2021 & 2026 ($Mn)

Fig.38 UK HPC By Deployment Share – 2021 & 2026 ($Mn)

Fig.39 UK HPC By Component Share – 2021 & 2026 ($Mn)

Fig.40 UK HPC By Application Share – 2021 & 2026 ($Mn)

Fig.41 Germany HPC By Deployment Share – 2021 & 2026 ($Mn)

Fig.42 Germany HPC By Component Share – 2021 & 2026 ($Mn)

Fig.43 Germany HPC By Application Share – 2021 & 2026 ($Mn)

Fig.44 France HPC By Deployment Share – 2021 & 2026 ($Mn)

Fig.45 France HPC By Component Share – 2021 & 2026 ($Mn)

Fig.46 France HPC By Application Share – 2021 & 2026 ($Mn)

Fig.47 Italy HPC By Deployment Share – 2021 & 2026 ($Mn)

Fig.48 Italy HPC By Component Share – 2021 & 2026 ($Mn)

Fig.49 Italy HPC By Application Share – 2021 & 2026 ($Mn)

Fig.50 Netherlands HPC By Deployment Share – 2021 & 2026 ($Mn)

Fig.51 Netherlands HPC By Component Share – 2021 & 2026 ($Mn)

Fig.52 Netherlands HPC By Application Share – 2021 & 2026 ($Mn)

Fig.53 Russia HPC By Deployment Share – 2021 & 2026 ($Mn)

Fig.54 Russia HPC By Component Share – 2021 & 2026 ($Mn)

Fig.55 Russia HPC By Application Share – 2021 & 2026 ($Mn)

Fig.56 Spain HPC By Deployment Share – 2021 & 2026 ($Mn)

Fig.57 Spain HPC By Component Share – 2021 & 2026 ($Mn)

Fig.58 Spain HPC By Application Share – 2021 & 2026 ($Mn)

Fig.59 Switzerland HPC By Deployment Share – 2021 & 2026 ($Mn)

Fig.60 Switzerland HPC By Component Share – 2021 & 2026 ($Mn)

Fig.61 Switzerland HPC By Component Share – 2021 & 2026 ($Mn)

Fig.62 Rest of Europe HPC By Component Share – 2021 & 2026 ($Mn)

Fig.63 Rest of Europe HPC By Component Share – 2021 & 2026 ($Mn)

Fig.64 Rest of Europe HPC By Application Share – 2021 & 2026 ($Mn)

Fig.65 Asia Pacific HPC Market Snapshot, 2019 – 2026 (US$ Mn)

Fig.66 Asia Pacific HPC By Deployment Share – 2021 & 2026 ($Mn)

Fig.67 Asia Pacific HPC By Component Share – 2021 & 2026 ($Mn)

Fig.68 Asia Pacific HPC By Application Share – 2021 & 2026 ($Mn)

Fig.69 China HPC By Deployment Share – 2021 & 2026 ($Mn)

Fig.70 China HPC By Component Share – 2021 & 2026 ($Mn)

Fig.71 China HPC By Application Share – 2021 & 2026 ($Mn)

Fig.72 India HPC By Deployment Share – 2021 & 2026 ($Mn)

Fig.73 India HPC By Component Share – 2021 & 2026 ($Mn)

Fig.74 India HPC By Application Share – 2021 & 2026 ($Mn)

Fig.75 Japan HPC By Deployment Share – 2021 & 2026 ($Mn)

Fig.76 Japan HPC By Component Share – 2021 & 2026 ($Mn)

Fig.77 Japan HPC By Application Share – 2021 & 2026 ($Mn)

Fig.78 Australia HPC By Deployment Share – 2021 & 2026 ($Mn)

Fig.79 Australia HPC By Component Share – 2021 & 2026 ($Mn)

Fig.80 Australia HPC By Application Share – 2021 & 2026 ($Mn)

Fig.81 Singapore HPC By Deployment Share – 2021 & 2026 ($Mn)

Fig.82 Singapore HPC By Component Share – 2021 & 2026 ($Mn)

Fig.83 Singapore HPC By Application Share – 2021 & 2026 ($Mn)

Fig.84 South Korea HPC By Deployment Share – 2021 & 2026 ($Mn)

Fig.85 South Korea HPC By Component Share – 2021 & 2026 ($Mn)

Fig.86 South Korea HPC By Application Share – 2021 & 2026 ($Mn)

Fig.87 Rest of Asia Pacific HPC By Deployment Share – 2021 & 2026 ($Mn)

Fig.88 Rest of Asia Pacific HPC By Component Share – 2021 & 2026 ($Mn)

Fig.89 Rest of Asia Pacific HPC By Application Share – 2021 & 2026 ($Mn)

Fig.90 South & Central America HPC Market Snapshot, 2019 – 2026 (US$ Mn)

Fig.91 Central and South America HPC By Deployment Share – 2021 & 2026 ($Mn)

Fig.92 Central and South America HPC By Component Share – 2021 & 2026 ($Mn)

Fig.93 Central and South America HPC By Application Share – 2021 & 2026 ($Mn)

Fig.94 Brazil HPC By Deployment Share – 2021 & 2026 ($Mn)

Fig.95 Brazil HPC By Component Share – 2021 & 2026 ($Mn)

Fig.96 Brazil HPC By Application Share – 2021 & 2026 ($Mn)

Fig.97 Mexico HPC By Deployment Share – 2021 & 2026 ($Mn)

Fig.98 Mexico HPC By Component Share – 2021 & 2026 ($Mn)

Fig.99 Mexico HPC By Application Share – 2021 & 2026 ($Mn)

Fig.100 Rest of Central and South America HPC By Deployment Share – 2021 & 2026 ($Mn)

Fig.101 Rest of Central and South America HPC By Component Share – 2021 & 2026 ($Mn)

Fig.102 Rest of Central and South America HPC By Application Share – 2021 & 2026 ($Mn)

Fig.103 Middle East & Africa HPC Market Snapshot, 2019 – 2026 (US$ Mn)

Fig.104 Middle East and Africa HPC By Deployment Share – 2021 & 2026 ($Mn)

Fig.105 Middle East and Africa HPC By Component Share – 2021 & 2026 ($Mn)

Fig.106 Middle East and Africa HPC By Application Share – 2021 & 2026 ($Mn)

Fig.107 UAE HPC By Deployment Share – 2021 & 2026 ($Mn)

Fig.108 UAE HPC By Component Share – 2021 & 2026 ($Mn)

Fig.109 UAE HPC By Application Share – 2021 & 2026 ($Mn)

Fig.110 Saudi Arabia HPC By Deployment Share – 2021 & 2026 ($Mn)

Fig.111 Saudi Arabia HPC By Component Share – 2021 & 2026 ($Mn)

Fig.112 Saudi Arabia HPC By Application Share – 2021 & 2026 ($Mn)

Fig.113 South Africa HPC By Deployment Share – 2021 & 2026 ($Mn)

Fig.114 South Africa HPC By Component Share – 2021 & 2026 ($Mn)

Fig.115 South Africa HPC By Application Share – 2021 & 2026 ($Mn)

Fig.116 Rest of Middle East and Africa HPC By Deployment Share – 2021 & 2026 ($Mn)

Fig.117 Rest of Middle East and Africa HPC By Component Share – 2021 & 2026 ($Mn)

Fig.118 Rest of Middle East and Africa HPC By Application Share – 2021 & 2026 ($Mn)

Fig.119 HPC – Growth-Innovation Matrix

Fig.120 Data Analysis Model

Fig.121 HPC Forecast Analysis

Frequently asked questions

Currency USD
$3,950

Can be used by individual purchaser only

$7,950

Can be shared globally by unlimited users within the purchasing corporation e.g. all employees of a single company


Undecided about purchasing this report?

Enquire Before Buying Request a Free Sample

Get in touch to find out about multi-purchase discounts

reportstore@globaldata.com
Tel +44 20 7947 2745

Every customer’s requirement is unique. With over 220,000 construction projects tracked, we can create a tailored dataset for you based on the types of projects you are looking for. Please get in touch with your specific requirements and we can send you a quote.

Sample Report

We are confident about High Performance Computing Market Trends and Analysis by Region, Component, Deployment, Application and Segment Forecast to 2026 report's unique quality. However, we want you to make the most beneficial decision for your business, so we offer free sample pages to help you:

  • Assess the relevance of the report
  • Evaluate the quality of the report
  • Justify the cost

Download your copy of the sample report and make an informed decision about whether the full report will provide you with the insights and information you need.

Below is a sample report to understand what you are buying

See what our customers are saying
testimonial-image
testimonial-image
testimonial-image
testimonial-image
testimonial-image
testimonial-image
testimonial-image

“The GlobalData platform is our go-to tool for intelligence services. GlobalData provides an easy way to access comprehensive intelligence data around multiple sectors, which essentially makes it a one-for-all intelligence platform, for tendering and approaching customers.

GlobalData is very customer orientated, with a high degree of personalised services, which benefits everyday use. The highly detailed project intelligence and forecast reports can be utilised across multiple departments and workflow scopes, from operational to strategic level, and often support strategic decisions. GlobalData Analytics and visualisation solutions has contributed positively when preparing management presentations and strategic papers.”

Business Intelligence & Marketing Manager, SAL Heavy Lift

“COVID-19 has caused significant interference to our business and the COVID-19 intelligence from GlobalData has helped us reach better decisions around strategy. These two highlights have helped enormously to understand the projections into the future concerning our business units, we also utilise the project database to source new projects for Liebherr-Werk to use as an additional source to pitch for new business.”

Market Analyst & Management, Liebherr-Werk

Your daily news has saved me a lot of time and keeps me up-to-date with what is happening in the market, I like that you almost always have a link to the source origin. We also use your market data in our Strategic Business Process to support our business decisions. By having everything in one place on the Intelligence Center it has saved me a lot of time versus looking on different sources, the alert function also helps with this.

Head of Key Accounts, Saab AB

Having used several other market research companies, I find that GlobalData manages to provide that ‘difficult-to-get’ market data that others can’t, as well as very diverse and complete consumer surveys.

Marketing Intelligence Manager, Portugal Foods

Our experience with GlobalData has been very good, from the platform itself to the people. I find that the analysts and the account team have a high level of customer focus and responsiveness and therefore I can always rely on. The platform is more holistic than other providers. It is convenient and almost like a one stop shop. The pricing suite is highly competitive and value for our organisation.

I like reports that inform new segments such as the analysis on generation Z, millennials, the impact of COVID 19 to our banking customers and their new channel habits. Secondly the specialist insight on affluent sector significantly increases our understanding about this group of customers. The combination of those give us depth and breadth of the evolving market.

I’m in the business of answering and helping people make decisions so with the intelligence center I can do that, effectively and efficiently. I can share quickly key insights that answer and satisfy our country stakeholders by giving them many quality studies and primary research about competitive landscape beyond the outlook of our bank. It helps me be seen as an advisory partner and that makes a big difference. A big benefit of our subscription is that no one holds the whole data and because it allows so many people, so many different parts of our organisation have access, it enables all teams to have the same level of knowledge and decision support.

Head of Customer Insight and Research, Standard Chartered

“I know that I can always rely on Globaldata’s work when I’m searching for the right consumer and market insights. I use Globaldata insights to understand the changing market & consumer landscape and help create better taste & wellbeing solutions for our customers in food, beverage and healthcare industries.

Globaldata has the right data and the reports are of very high quality compared to your competitors. Globaldata not only has overall market sizes & consumer insights on food & beverages but also provides insights at the ingredient & flavour level. That is key for B2B companies like Givaudan. This way we understand our customers’ business and also gain insight to our unique industry”

Head of Consumer Sensory Insights, Givaudan

GlobalData provides a great range of information and reports on various sectors that is highly relevant, timely, easy to access and utilise.  The reports and data dashboards help engagement with clients; they provide valuable industry and market insights that can enrich client conversations and can help in the shaping of value propositions. Moreover, using GlobalData products has helped increase my knowledge of the finance sector, the players within it, and the general threats and opportunities.

I find the consumer surveys that are carried out to be extremely beneficial and not something I have seen anywhere else. They provided an insightful view of why and which consumers take (or don’t) particular financial products. This can help shape conversations with clients to ensure they make the right strategic decisions for their business.

One of the challenges I have found is that data in the payments space is often piecemeal. With GD all of the data I need is in one place, but it also comes with additional market reports that provide useful extra context and information. Having the ability to set-up alerts on relevant movements in the industry, be it competitors or customers, and have them emailed directly to me, ensures I get early sight of industry activity and don’t have to search for news.

Senior Account Manager, TSYS
Technology
New
Cloud Gaming - Thematic Intelligence
$995 | May 2024
Technology
New
Supply Chain Disruption - Thematic Intelligence
$995 | May 2024
Technology
New
Sharing Economy - Thematic Intelligence
$995 | May 2024
Go even deeper with GlobalData Intelligence Center

Every Company Report we produce is powered by the GlobalData Intelligence Center.

Subscribing to our intelligence platform means you can monitor developments at High Performance Computing Market Trends and Analysis by Region, Component, Deployment, Application and Segment Forecast to 2026 in real time.

  • Access a live High Performance Computing Market Trends and Analysis by Region, Component, Deployment, Application and Segment Forecast to 2026 dashboard for 12 months, with up-to-the-minute insights.
  • Fuel your decision making with real-time deal coverage and media activity.
  • Turn insights on financials, deals, products and pipelines into powerful agents of commercial advantage.