North America (NAFTA) Car Manufacturing Market Summary, Competitive Analysis and Forecast, 2017-2026

Powered by

All the vital news, analysis, and commentary curated by our industry experts.

$995

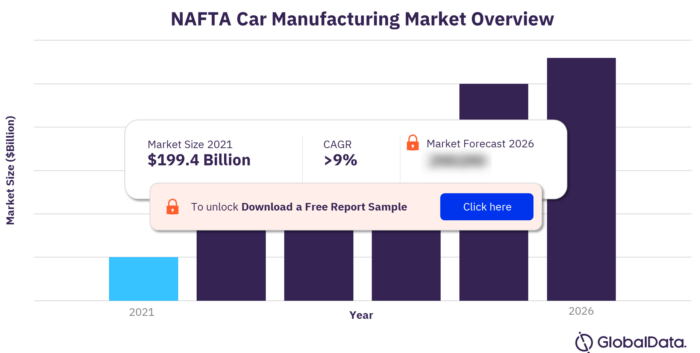
The NAFTA car manufacturing industry was valued at $199.4 billion in 2021, and it is expected to grow at a CAGR of more than 9% between 2021 and 2026. The NAFTA car manufacturing market research report provides qualitative and quantitative information including market size and forecast of the car manufacturing industry among the NAFTA countries. The profile also contains descriptions of the leading players including key financial metrics and an analysis of competitive pressures within the industry.

North America (NAFTA) Car Manufacturing Market Summary

For more insights on NAFTA market forecast, download a free report sample

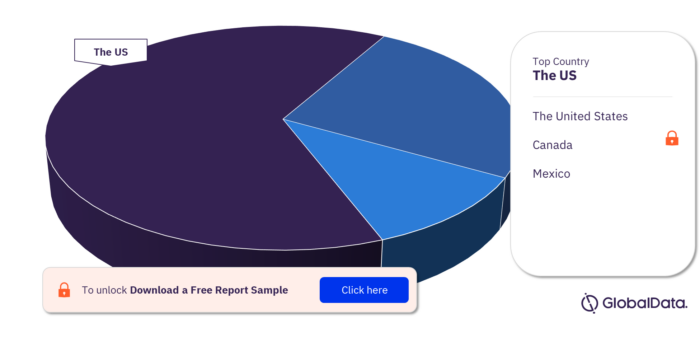
Key Nations in the NAFTA Car Manufacturing Market

The North American Free Trade Agreement (NAFTA) is a trade agreement between the countries in North America: the US, Canada, and Mexico. The US is the leading country among the NAFTA countries, followed by Mexico and Canada.

The US: The US car manufacturing industry has shown signs of recovery post the pandemic. Production in the car manufacturing industry grew in 2021 as consumer confidence improved as economic uncertainty receded.

Canada: The Canadian car manufacturing industry has been declining steeply in 2020 and 2021, largely because of the COVID-19 pandemic. Canada is a net exporter of cars, with Stellantis, Honda, and Ford among the largest manufactures operating locally. In terms of value, the majority of cars manufactured in Canada are exported to the US.

Mexico: Temporary shutdowns in the Mexico car manufacturing plants amid labor shortages and severe disruption in the supply chain, including a shortage of semiconductors which persisted throughout the COVID-19 pandemic, led to a steep decline in production.

The NAFTA Car Manufacturing Market, by Key Countries

The NAFTA Car Manufacturing Market, by Key Countries

For more insights on key countries, download a free report sample

Key Companies in the NAFTA Car Manufacturing Market

The key companies in the NAFTA car manufacturing market are Stellantis NV, Honda Motor Co., Ltd., Ford Motor Company Limited, Volkswagen AG, Nissan Motor Co, Ltd., Bayerische Motoren Werke AG, and Hyundai Motor Company among others.

Stellantis NV: Stellantis designs, engineers, manufactures, distributes, and sells vehicles, components, and production systems. It sells its vehicles under the Abarth, Alfa Romeo, Citroën, Dodge, DS, Fiat, Fiat Professional, Jeep, Lancia, Opel, Peugeot, Ram, Chrysler and Vauxhall brands, among others.

Honda Motor Co., Ltd.: Honda is a manufacturer of automobiles and motorcycles. The company apart from motorcycles and automobiles, it also makes power products including tillers, generators, snow throwers, outboard engines, and lawnmowers, and aircraft and jet engines.

Ford Motor Company Limited: Ford is manufacturer and distributor of cars and commercial vehicles. It offers a range of cars which include New Fiesta, New Fiesta ST, Ka, B-MAX, New EcoSport, Focus, Focus ST, C-MAX & Grand C-MAX, KUGA, Mondeo, S-MAX, Galaxy, and Ranger.

NAFTA Car Manufacturing Market Overview

Market Size (2021) $199.4 billion
CAGR (2021-2026) >9%
Key Countries The US, Canada, and Mexico
Key Companies Stellantis NV, Honda Motor Co., Ltd., Ford Motor Company Limited, Volkswagen AG, Nissan Motor Co, Ltd., Bayerische Motoren Werke AG, and Hyundai Motor Company

Scope

  • Save time carrying out entry-level research by identifying the size, growth, and leading players in the NAFTA car manufacturing Industry
  • Use the Five Forces analysis to determine the competitive intensity and therefore attractiveness of the NAFTA car manufacturing Industry
  • Leading company profiles reveal details of key car manufacturing Industry players’ NAFTA operations and financial performance
  • Add weight to presentations and pitches by understanding the future growth prospects of the NAFTA car manufacturing Industry with five-year forecasts by both value and volume
  • Compares data from the US, Canada and Mexico, alongside individual chapters on each country

Reasons to Buy

  • What was the size of the NAFTA car manufacturing Industry by value in 2021?
  • What will be the size of the NAFTA car manufacturing Industry in 2026?
  • What factors are affecting the strength of competition in the NAFTA car manufacturing Industry?
  • How has the industry performed over the last five years?
  • Who are the top competitors in the NAFTA car manufacturing Industry?

Stellantis NV
Honda Motor Co., Ltd.
Ford Motor Company Limited
Volkswagen AG
Nissan Motor Co., Ltd.
Bayerische Motoren Werke AG
Hyundai Motor Company
Toyota Motor Corporation
Tesla, Inc.

Table of Contents

Table of Contents

1 Introduction

1.1. What is this report about?

1.2. Who is the target reader?

1.3. How to use this report

1.4. Definitions

2 NAFTA Car Manufacturing

2.1. Industry Outlook

3 Car Manufacturing in Canada

3.1. Market Overview

3.2. Market Data

3.3. Market Segmentation

3.4. Market outlook

3.5. Five forces analysis

4 Macroeconomic Indicators

4.1. Country data

5 Car Manufacturing in Mexico

5.1. Market Overview

5.2. Market Data

5.3. Market Segmentation

5.4. Market outlook

5.5. Five forces analysis

6 Macroeconomic Indicators

6.1. Country data

7 Car Manufacturing in The United States

7.1. Market Overview

7.2. Market Data

7.3. Market Segmentation

7.4. Market outlook

7.5. Five forces analysis

8 Macroeconomic Indicators

8.1. Country data

9 Company Profiles

9.1. Stellantis NV

9.2. Honda Motor Co., Ltd.

9.3. Ford Motor Company Limited

9.4. Volkswagen AG

9.5. Nissan Motor Co., Ltd.

9.6. Bayerische Motoren Werke AG

9.7. Hyundai Motor Company

9.8. Toyota Motor Corporation

9.9. Tesla, Inc.

10 Appendix

10.1. Methodology

10.2. About GlobalData

Table

List of Tables

Table 1: NAFTA countries car manufacturing industry, revenue ($bn), 2017-26

Table 2: NAFTA countries car manufacturing industry, revenue ($bn), 2017-21

Table 3: NAFTA countries car manufacturing industry forecast, revenue ($bn), 2021-26

Table 4: Canada car manufacturing industry value: $ billion, 2017–21

Table 5: Canada car manufacturing industry volume: thousand units, 2017–21

Table 6: Canada car manufacturing industry geography segmentation: $ billion, 2021

Table 7: Canada car manufacturing industry share: % share, by volume, 2021

Table 8: Canada car manufacturing industry value forecast: $ billion, 2021–26

Table 9: Canada car manufacturing industry volume forecast: thousand units, 2021–26

Table 10: Canada size of population (million), 2017–21

Table 11: Canada gdp (constant 2005 prices, $ billion), 2017–21

Table 12: Canada gdp (current prices, $ billion), 2017–21

Table 13: Canada inflation, 2017–21

Table 14: Canada consumer price index (absolute), 2017–21

Table 15: Canada exchange rate, 2017–21

Table 16: Mexico car manufacturing industry value: $ billion, 2017–21

Table 17: Mexico car manufacturing industry volume: thousand units, 2017–21

Table 18: Mexico car manufacturing industry geography segmentation: $ billion, 2021

Table 19: Mexico car manufacturing industry share: % share, by volume, 2021

Table 20: Mexico car manufacturing industry value forecast: $ billion, 2021–26

Table 21: Mexico car manufacturing industry volume forecast: thousand units, 2021–26

Table 22: Mexico size of population (million), 2017–21

Table 23: Mexico gdp (constant 2005 prices, $ billion), 2017–21

Table 24: Mexico gdp (current prices, $ billion), 2017–21

Table 25: Mexico inflation, 2017–21

Table 26: Mexico consumer price index (absolute), 2017–21

Table 27: Mexico exchange rate, 2017–21

Table 28: United States car manufacturing industry value: $ billion, 2017–21

Table 29: United States car manufacturing industry volume: thousand units, 2017–21

Table 30: United States car manufacturing industry geography segmentation: $ billion, 2021

Table 31: United States car manufacturing industry share: % share, by volume, 2021

Table 32: United States car manufacturing industry value forecast: $ billion, 2021–26

Table 33: United States car manufacturing industry volume forecast: thousand units, 2021–26

Table 34: United States size of population (million), 2017–21

Table 35: United States gdp (constant 2005 prices, $ billion), 2017–21

Table 36: United States gdp (current prices, $ billion), 2017–21

Table 37: United States inflation, 2017–21

Table 38: United States consumer price index (absolute), 2017–21

Table 39: United States exchange rate, 2017–21

Table 40: Stellantis NV: key facts

Table 41: Stellantis NV: Annual Financial Ratios

Table 42: Stellantis NV: Key Employees

Table 43: Stellantis NV: Key Employees Continued

Table 44: Stellantis NV: Key Employees Continued

Table 45: Honda Motor Co., Ltd.: key facts

Table 46: Honda Motor Co., Ltd.: Annual Financial Ratios

Table 47: Honda Motor Co., Ltd.: Key Employees

Table 48: Honda Motor Co., Ltd.: Key Employees Continued

Table 49: Honda Motor Co., Ltd.: Key Employees Continued

Table 50: Ford Motor Company Limited: key facts

Table 51: Ford Motor Company Limited: Key Employees

Table 52: Volkswagen AG: key facts

Table 53: Volkswagen AG: Annual Financial Ratios

Table 54: Volkswagen AG: Key Employees

Table 55: Volkswagen AG: Key Employees Continued

Table 56: Volkswagen AG: Key Employees Continued

Table 57: Nissan Motor Co., Ltd.: key facts

Table 58: Nissan Motor Co., Ltd.: Annual Financial Ratios

Table 59: Nissan Motor Co., Ltd.: Key Employees

Table 60: Nissan Motor Co., Ltd.: Key Employees Continued

Table 61: Nissan Motor Co., Ltd.: Key Employees Continued

Table 62: Nissan Motor Co., Ltd.: Key Employees Continued

Table 63: Bayerische Motoren Werke AG: key facts

Table 64: Bayerische Motoren Werke AG: Annual Financial Ratios

Table 65: Bayerische Motoren Werke AG: Key Employees

Table 66: Bayerische Motoren Werke AG: Key Employees Continued

Table 67: Hyundai Motor Company: key facts

Table 68: Hyundai Motor Company: Annual Financial Ratios

Table 69: Hyundai Motor Company: Key Employees

Table 70: Toyota Motor Corporation: key facts

Table 71: Toyota Motor Corporation: Annual Financial Ratios

Table 72: Toyota Motor Corporation: Key Employees

Table 73: Toyota Motor Corporation: Key Employees Continued

Table 74: Toyota Motor Corporation: Key Employees Continued

Table 75: Tesla, Inc.: key facts

Table 76: Tesla, Inc.: Annual Financial Ratios

Table 77: Tesla, Inc.: Key Employees

Figures

List of Figures

Figure 1: NAFTA countries car manufacturing industry, revenue ($bn), 2017-26

Figure 2: NAFTA countries car manufacturing industry, revenue ($bn), 2017-21

Figure 3: NAFTA countries car manufacturing industry forecast, revenue ($bn), 2021-26

Figure 4: Canada car manufacturing industry value: $ billion, 2017–21

Figure 5: Canada car manufacturing industry volume: thousand units, 2017–21

Figure 6: Canada car manufacturing industry geography segmentation: % share, by value, 2021

Figure 7: Canada car manufacturing industry share: % share, by volume, 2021

Figure 8: Canada car manufacturing industry value forecast: $ billion, 2021–26

Figure 9: Canada car manufacturing industry volume forecast: thousand units, 2021–26

Figure 10: Forces driving competition in the car manufacturing industry in Canada, 2021

Figure 11: Drivers of buyer power in the car manufacturing industry in Canada, 2021

Figure 12: Drivers of supplier power in the car manufacturing industry in Canada, 2021

Figure 13: Factors influencing the likelihood of new entrants in the car manufacturing industry in Canada, 2021

Figure 14: Factors influencing the threat of substitutes in the car manufacturing industry in Canada, 2021

Figure 15: Drivers of degree of rivalry in the car manufacturing industry in Canada, 2021

Figure 16: Mexico car manufacturing industry value: $ billion, 2017–21

Figure 17: Mexico car manufacturing industry volume: thousand units, 2017–21

Figure 18: Mexico car manufacturing industry geography segmentation: % share, by value, 2021

Figure 19: Mexico car manufacturing industry share: % share, by volume, 2021

Figure 20: Mexico car manufacturing industry value forecast: $ billion, 2021–26

Figure 21: Mexico car manufacturing industry volume forecast: thousand units, 2021–26

Figure 22: Forces driving competition in the car manufacturing industry in Mexico, 2021

Figure 23: Drivers of buyer power in the car manufacturing industry in Mexico, 2021

Figure 24: Drivers of supplier power in the car manufacturing industry in Mexico, 2021

Figure 25: Factors influencing the likelihood of new entrants in the car manufacturing industry in Mexico, 2021

Figure 26: Factors influencing the threat of substitutes in the car manufacturing industry in Mexico, 2021

Figure 27: Drivers of degree of rivalry in the car manufacturing industry in Mexico, 2021

Figure 28: United States car manufacturing industry value: $ billion, 2017–21

Figure 29: United States car manufacturing industry volume: thousand units, 2017–21

Figure 30: United States car manufacturing industry geography segmentation: % share, by value, 2021

Figure 31: United States car manufacturing industry share: % share, by volume, 2021

Figure 32: United States car manufacturing industry value forecast: $ billion, 2021–26

Figure 33: United States car manufacturing industry volume forecast: thousand units, 2021–26

Figure 34: Forces driving competition in the car manufacturing industry in the United States, 2021

Figure 35: Drivers of buyer power in the car manufacturing industry in the United States, 2021

Figure 36: Drivers of supplier power in the car manufacturing industry in the United States, 2021

Figure 37: Factors influencing the likelihood of new entrants in the car manufacturing industry in the United States, 2021

Figure 38: Factors influencing the threat of substitutes in the car manufacturing industry in the United States, 2021

Figure 39: Drivers of degree of rivalry in the car manufacturing industry in the United States, 2021

Frequently asked questions

North America (NAFTA) Car Manufacturing Market Summary, Competitive Analysis and Forecast, 2017-2026 thematic reports
Currency USD
$995

Can be used by individual purchaser only

$1,990

Can be shared globally by unlimited users within the purchasing corporation e.g. all employees of a single company


Undecided about purchasing this report?

Enquire Before Buying

Get in touch to find out about multi-purchase discounts

reportstore@globaldata.com
Tel +44 20 7947 2745

Every customer’s requirement is unique. With over 220,000 construction projects tracked, we can create a tailored dataset for you based on the types of projects you are looking for. Please get in touch with your specific requirements and we can send you a quote.

See what our customers are saying

“The GlobalData platform is our go-to tool for intelligence services. GlobalData provides an easy way to access comprehensive intelligence data around multiple sectors, which essentially makes it a one-for-all intelligence platform, for tendering and approaching customers.

GlobalData is very customer orientated, with a high degree of personalised services, which benefits everyday use. The highly detailed project intelligence and forecast reports can be utilised across multiple departments and workflow scopes, from operational to strategic level, and often support strategic decisions. GlobalData Analytics and visualisation solutions has contributed positively when preparing management presentations and strategic papers.”

Business Intelligence & Marketing Manager, SAL Heavy Lift

“COVID-19 has caused significant interference to our business and the COVID-19 intelligence from GlobalData has helped us reach better decisions around strategy. These two highlights have helped enormously to understand the projections into the future concerning our business units, we also utilise the project database to source new projects for Liebherr-Werk to use as an additional source to pitch for new business.”

Market Analyst & Management, Liebherr-Werk

Your daily news has saved me a lot of time and keeps me up-to-date with what is happening in the market, I like that you almost always have a link to the source origin. We also use your market data in our Strategic Business Process to support our business decisions. By having everything in one place on the Intelligence Center it has saved me a lot of time versus looking on different sources, the alert function also helps with this.

Head of Key Accounts, Saab AB

Having used several other market research companies, I find that GlobalData manages to provide that ‘difficult-to-get’ market data that others can’t, as well as very diverse and complete consumer surveys.

Marketing Intelligence Manager, Portugal Foods

Our experience with GlobalData has been very good, from the platform itself to the people. I find that the analysts and the account team have a high level of customer focus and responsiveness and therefore I can always rely on. The platform is more holistic than other providers. It is convenient and almost like a one stop shop. The pricing suite is highly competitive and value for our organisation.

I like reports that inform new segments such as the analysis on generation Z, millennials, the impact of COVID 19 to our banking customers and their new channel habits. Secondly the specialist insight on affluent sector significantly increases our understanding about this group of customers. The combination of those give us depth and breadth of the evolving market.

I’m in the business of answering and helping people make decisions so with the intelligence center I can do that, effectively and efficiently. I can share quickly key insights that answer and satisfy our country stakeholders by giving them many quality studies and primary research about competitive landscape beyond the outlook of our bank. It helps me be seen as an advisory partner and that makes a big difference. A big benefit of our subscription is that no one holds the whole data and because it allows so many people, so many different parts of our organisation have access, it enables all teams to have the same level of knowledge and decision support.

Head of Customer Insight and Research, Standard Chartered

“I know that I can always rely on Globaldata’s work when I’m searching for the right consumer and market insights. I use Globaldata insights to understand the changing market & consumer landscape and help create better taste & wellbeing solutions for our customers in food, beverage and healthcare industries.

Globaldata has the right data and the reports are of very high quality compared to your competitors. Globaldata not only has overall market sizes & consumer insights on food & beverages but also provides insights at the ingredient & flavour level. That is key for B2B companies like Givaudan. This way we understand our customers’ business and also gain insight to our unique industry”

Head of Consumer Sensory Insights, Givaudan

GlobalData provides a great range of information and reports on various sectors that is highly relevant, timely, easy to access and utilise.  The reports and data dashboards help engagement with clients; they provide valuable industry and market insights that can enrich client conversations and can help in the shaping of value propositions. Moreover, using GlobalData products has helped increase my knowledge of the finance sector, the players within it, and the general threats and opportunities.

I find the consumer surveys that are carried out to be extremely beneficial and not something I have seen anywhere else. They provided an insightful view of why and which consumers take (or don’t) particular financial products. This can help shape conversations with clients to ensure they make the right strategic decisions for their business.

One of the challenges I have found is that data in the payments space is often piecemeal. With GD all of the data I need is in one place, but it also comes with additional market reports that provide useful extra context and information. Having the ability to set-up alerts on relevant movements in the industry, be it competitors or customers, and have them emailed directly to me, ensures I get early sight of industry activity and don’t have to search for news.

Senior Account Manager, TSYS
Go even deeper with GlobalData Intelligence Center

Every Company Report we produce is powered by the GlobalData Intelligence Center.

Subscribing to our intelligence platform means you can monitor developments at North America (NAFTA) Car Manufacturing Market Summary, Competitive Analysis and Forecast, 2017-2026 in real time.

  • Access a live North America (NAFTA) Car Manufacturing Market Summary, Competitive Analysis and Forecast, 2017-2026 dashboard for 12 months, with up-to-the-minute insights.
  • Fuel your decision making with real-time deal coverage and media activity.
  • Turn insights on financials, deals, products and pipelines into powerful agents of commercial advantage.