North America Infrastructure Construction Market Size, Trends, Analysis by Countries, Sector and Segment Forecast to 2026
Powered by ![]()
Access in-depth insight and stay ahead of the market

North America Infrastructure Construction Market Overview
The North America infrastructure construction market size is projected to reach $371.6 billion in 2023 and is expected to register a compound annual growth rate (CAGR) of 6.9% over the forecast period. The regional growth momentum is driven by the US’s $1.2 trillion Infrastructure Investment and Jobs Act (IIJA). According to the White House, more than $160 billion of transportation projects were initiated in the first year of the IIJA’s implementation.
Among the investments, the US Department of Transportation (USDOT) and Federal Highway Administration (FHWA) initiated approximately $120 billion in Federal Highway Apportionments for highways and bridges for fiscal years 2022 and 2023.
North America Infrastructure Construction Market Outlook, 2019-2026 ($ Billion)
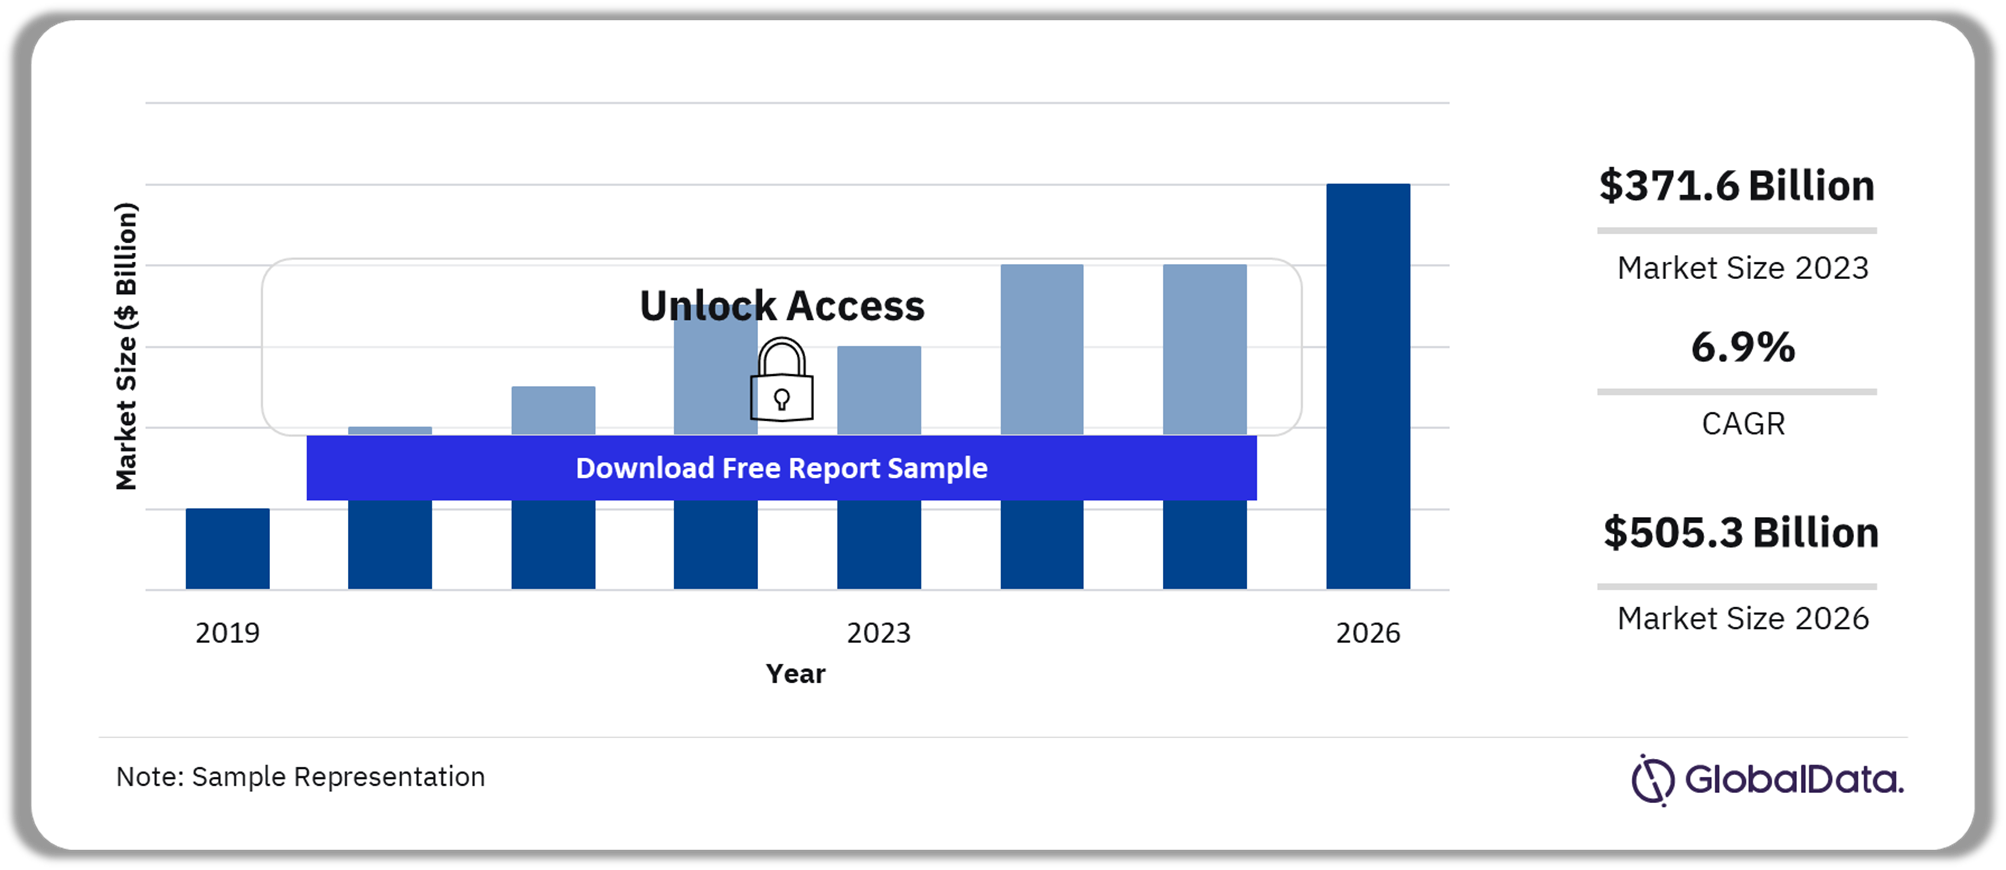
View Sample Report for Additional Insights on the North America Infrastructure Construction Market Forecast, Download Free Report Sample
The North America infrastructure construction sector is expected to rise by 11.7% in 2023, aided by increased investments and steady progress in roadway project developments. However, previous to 2023, the overall trend in the regional infrastructure sector suffered a negative trend owing to inflation pressure, high-interest rates, labor shortages, and weak consumer demand.
Over the forecast period, the trend is expected to improve at a significant rate with regional governments stepping up to make investments in public infrastructure and push for the development and upgradation of the transportation and supply chain sector.
| Market Size (2023) | $371.6 billion |
| Market Size (2026) | $505.3 billion |
| CAGR (2022-2026) | 6.9% |
| Historic Period | 2016-2021 |
| Forecast Period | 2022-2026 |
| Report Scope & Coverage | Sector Overview, Construction Output Value ($ Million), Project Pipeline by Country and Sector, Regional Outlook by Key Sectors, Top 20 Project Details by Sector |
| Key Sectors | Roads, Railways, Electricity and Power, Water and Sewage, Others |
| Key Countries | US and Canada |
North America Infrastructure Construction Market Segmentation by Sectors
The North America infrastructure construction industry covers railways, roads, water and sewage, electricity and power, and others. The electricity and power segment is anticipated to dominate the overall market share in 2023.
Electricity and Power: This segment is poised to account for the largest regional share in terms of construction output value in 2023. The shift to renewable energy sources will define the power generation project pipeline in North America, with a small percentage of carbon-based power plants in the project pipeline.
There is a concerted effort by the US and Canada to heavily reduce carbon emissions by increasing public investment and subsidies in renewable energy production, setting emission targets, and increasing regulation and taxes on high-emission industries.
North America Infrastructure Construction Market Share by Sectors, 2023 (%)

Fetch Sample PDF for Segment-Specific Revenues and Shares, Download Free Report Sample
Roads: The segmental growth of this category is primarily driven by public investments to modernize and rehabilitate the current state of the roadway infrastructure in the region. The IIJA investment of $1.2 trillion remains a key factor prompting the growth in roadway work in the US. According to the US Census Bureau, the spending on highway and street construction rose sharply by 9.1% annually in 2022 in nominal terms, representing an increase of 10.5% over the values spent in the pre-pandemic levels of 2019.
Road construction demand in Canada will be supported by a raft of provincial investment programs, including the Government of Alberta’s $5.9 billion investment on transport infrastructure over the next three financial years.
Water and Sewage: This category is estimated to register the third largest regional share in 2023. Water and sewage infrastructure is already relatively well developed in most parts of North America, owing to the advancement of the US and Canadian economies. However, freshwater pollution remains a major issue in the US due to rapid industrialization and urbanization in the country, coupled with a lack of regulation.
Estimates suggest that up to half of all freshwater sources in the US are contaminated with industrial and urban waste. Moreover, the impact of climate change in the country is already threatening the supply of freshwater. Addressing these issues is likely to require steady investment in this field.
Railways: The regional railway infrastructure sector in terms of construction output value is estimated to register the second-fastest compound annual growth rate (CAGR) of 7.4% over the forecast period. The trend toward the construction of high-frequency railways in the region is likely to pick up over the coming years.
In an encouraging development, Canada’s Ministry of Transport announced a significant step forward in the procurement process for the High-Frequency Rail project in February 2023, which involves developing the High-Frequency Rail line between Québec and Toronto for more than 800km, with the potential to increase speeds beyond 200km per hour.
Others: This category comprises marine, ports, inland waterways, and airports. The strength of the US domestic air transport sector has kept the overall industry in North America relatively buoyant over the past three years, but the decline in the number of international travelers has had a significant adverse effect on the industry nonetheless in terms of airlines’ revenues and delays in airport construction projects.
The sharp rise in demand coupled with labor shortages at many ports in the US led to long backups of cargo ships off the North American coastline, imposing significant costs on the US economy, and hindering the recovery from COVID-19.
North America Infrastructure Construction Market Analysis by Region
The North America infrastructure construction is primarily influenced by the spending dynamics of the US and Canada. Both these countries are developed in terms of economic capacity and continue to strive towards the development and upgradation of existing infrastructural networks. Among these two countries, the US is likely to account for a significant regional share in terms of construction output value as well as project pipeline value.
The infrastructure project pipeline in the US displays 57.0% of the sites under execution and pre-execution stage, more than 36.0% undergoing planning, and the remaining in the pre-planning phase. The infrastructure construction sector in the US is expected to increase by 11.9% this year, aided by increased investments and steady progress in roadway project developments. During the forecast period, the sector’s output will be bolstered by the implementation of projects under the $1.2 trillion Infrastructure Investment and Jobs Act (IIJA) scheme.
North America Infrastructure Construction Market Share by Country, 2023 (%)
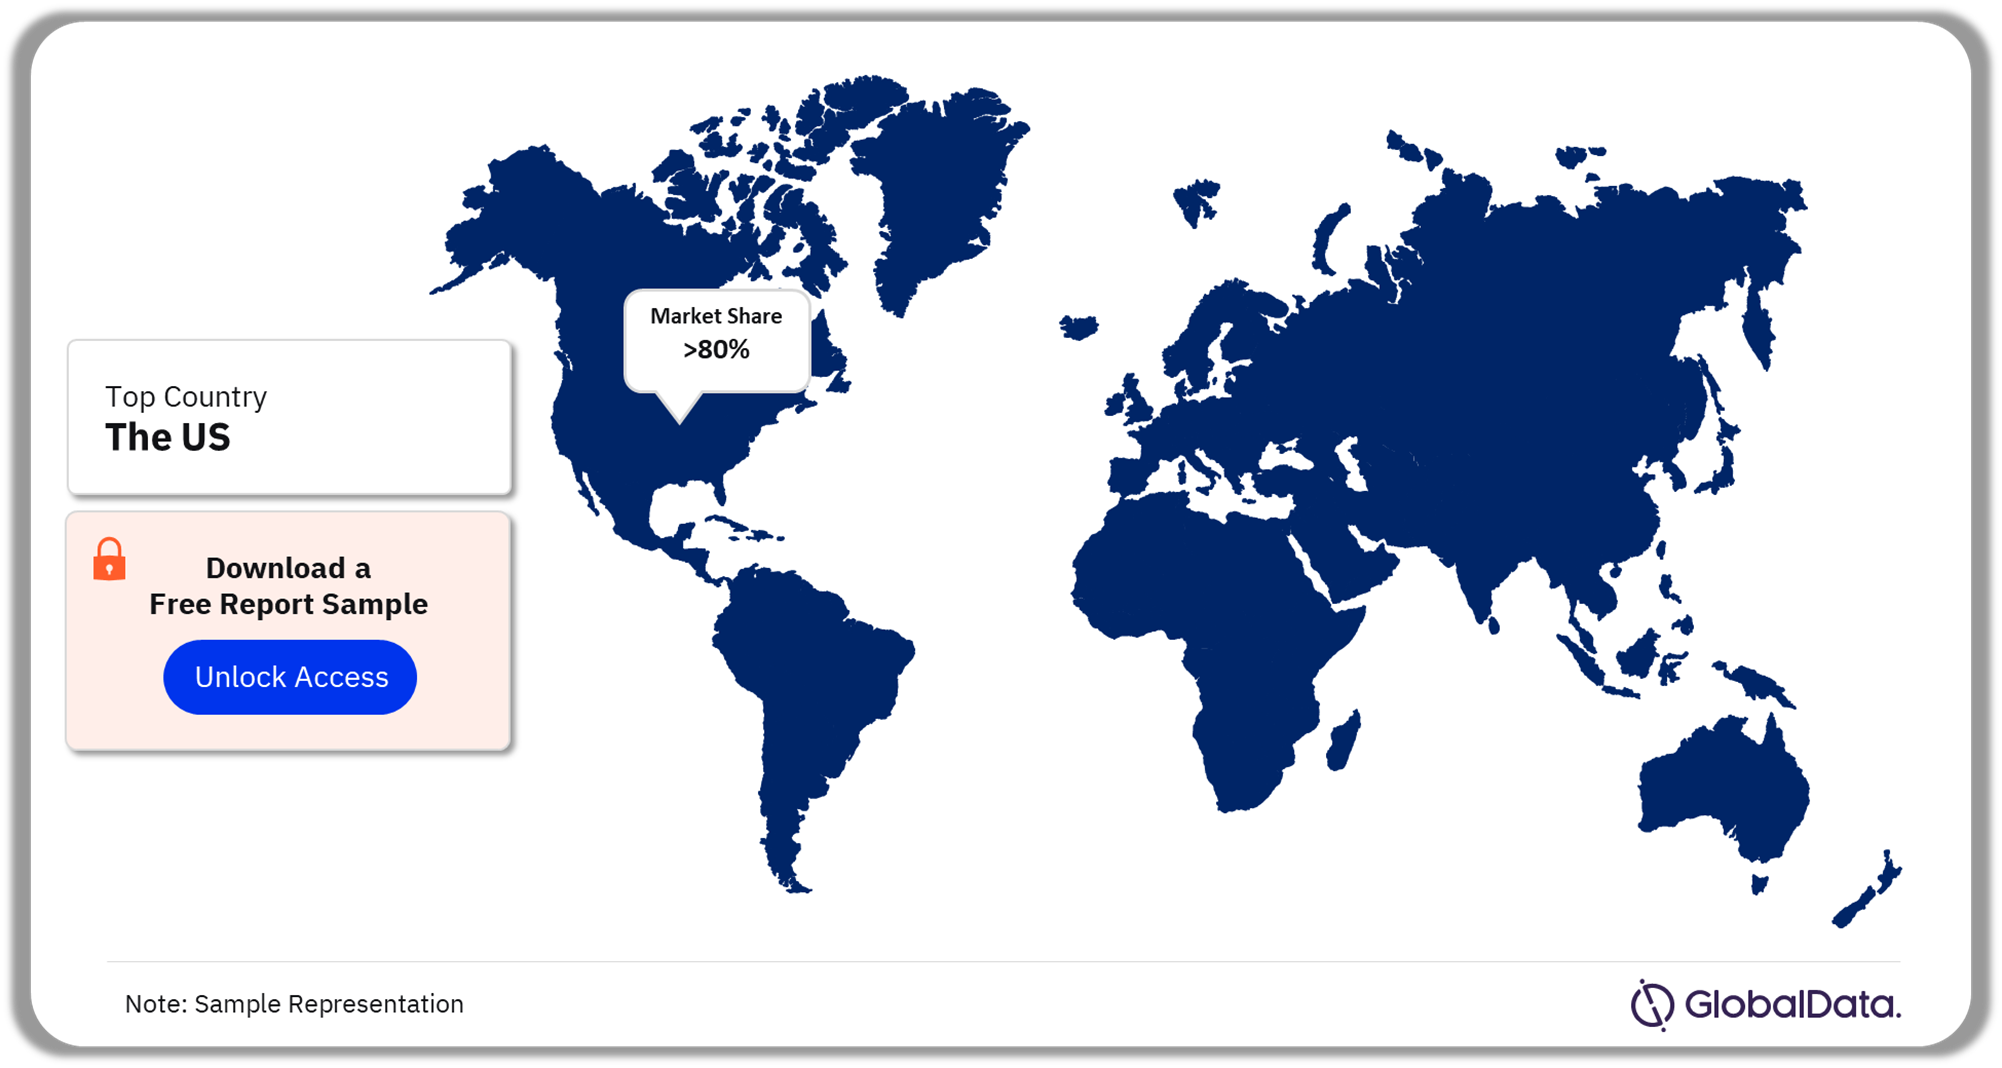
View Sample Report for Additional North America Infrastructure Construction Market Insights, Download Free Report Sample
The US infrastructure activity are estimated to observe significant rise in investment over the coming years. According to the US Census Bureau, the spending on highway and street construction rose sharply by 9.1% annually in 2022 in nominal terms, representing an increase of 10.5% over the values spent in the pre-pandemic levels of 2019. In addition, the Federal government’s investments in major transportation projects will assist contractors in addressing the constraints of rising inflation, mortgage rates and avoid project delays and cost overruns.
Canada is also increasing public investment in renewable energy projects as a part of the ‘Growth Plan’ between 2021-2023, CAD2.5 billion ($2 billion) has been earmarked for clean energy projects. Neoen, a French renewable energy company, announced in January 2023 that it had begun the construction of a 93MW solar power plant in Starland County, Alberta.
The Canada federal government announced in January 2023 that it is increasing its funding contribution for upgrades to an airport in the Northwest Territories by CAD80 million ($62.1 million). As of January 2023, the government announced that it spent CAD230 million ($178.4 million) to extend and modernize the runway at Inuvik’s airport. Overall, the project is aimed to extend the runway by 914m and modernize lighting, its navigational system, and a military aircraft arrestor system.
North America Infrastructure Construction Market Segments and Scope
North America Infrastructure Construction Market Sectors Outlook (Value, $ Billion, 2016-2026)
- Railway
- Road
- Electricity and Power
- Water and Sewage
- Others
North America Infrastructure Construction Market Countries Outlook (Value, $ Billion, 2016-2026)
- US
- Canada
Scope
- North America infrastructure construction market outlook: analysis as well as historical figures and forecasts of revenue opportunities from the sector and regional segments.
- The report provides an overview of the outlook for the North America infrastructure construction industry to 2026.
- Analysis of the outlook for infrastructure investment in major countries: US and Canada.
- Insight into the project pipelines for roads, railways, electricity and power, water and sewage, and others.
Key Highlights
The North America infrastructure construction market size globally will be evaluated at $371.6 billion in 2023. The infrastructure construction market in North America is expected to grow at a CAGR of 6.9% during 2022-2026.
Reasons to Buy
- Evaluate regional trends in infrastructure development from insight into output values and project pipelines. Identify the fastest growers to enable assessment and targeting of commercial opportunities in the markets best suited to strategic focus.
- Identify the drivers in the North America infrastructure construction market and consider growth in developed economies. Formulate plans on where and how to engage with the market while minimizing any negative impact on revenues.
- Accompanying GlobalData’s Forecast products, the report examines the assumptions and drivers behind ongoing and upcoming trends in the North America infrastructure construction market.
Key Players
Table of Contents
Table
Figures
Frequently asked questions
-
What was the North America infrastructure construction market size in 2023?
The North America infrastructure construction market size will be evaluated at $371.6 billion in 2023.
-
What is the North America infrastructure construction market growth rate?
The infrastructure construction market in North America is expected to grow at a CAGR of 6.9% during 2022-2026.
-
Which is the leading sector in the North America infrastructure construction market?
The electricity and power is the leading sector in terms of construction output value in the North America infrastructure construction market in 2023.
-
Which is the leading country in the North America infrastructure construction market?
The US is the leading country in the North America infrastructure construction market in 2023.
-
Is there a third level of segmentation in the report?
GlobalData’s focus is on providing reliable and accurate data that is supported by robust research methodology. Our reports undergo rigorous quality checks and are based on primary and secondary research sources, ensuring that the numbers and insights provided are trustworthy. However, despite the best efforts to gather comprehensive data, there could be instances where the available data is limited, making it challenging to provide third-level segmentation. In such cases, GlobalData may choose to provide high-level insights and general trends rather than forcing segmentation that may not be backed by sufficient data. This approach ensures that the report’s overall quality and credibility are maintained.
Get in touch to find out about multi-purchase discounts
reportstore@globaldata.com
Tel +44 20 7947 2745
Every customer’s requirement is unique. With over 220,000 construction projects tracked, we can create a tailored dataset for you based on the types of projects you are looking for. Please get in touch with your specific requirements and we can send you a quote.
Sample Report
We are confident about North America Infrastructure Construction Market Size, Trends, Analysis by Countries, Sector and Segment Forecast to 2026 report's unique quality. However, we want you to make the most beneficial decision for your business, so we offer free sample pages to help you:
- Assess the relevance of the report
- Evaluate the quality of the report
- Justify the cost
Download your copy of the sample report and make an informed decision about whether the full report will provide you with the insights and information you need.