Refinery Coking Units Capacity and Capital Expenditure with Details of All Operating and Planned Coking Units to 2027

Powered by

All the vital news, analysis, and commentary curated by our industry experts.

Refinery Coking Units Capacity and Capital Expenditure Overview

The total active Refinery Coking Units capacity was 9,896 mbd in 2022. The market is expected to increase at an AAGR of more than 2% during 2022-2027. The US, China, India, Russia, and Canada are the major countries that accounted for 69% of the total global coking unit capacity in 2022.

Refinery Coking Units, 2022-2027 (mbd)

Refinery Capacity Market Outlook, 2022-2027 (mbd)

For more insights into the Refinery Coking Units capacity and capex forecast, download a free report sample

The Refinery Coking Units Capacity and Capital Expenditure market research report provides information on all active and upcoming (planned and announced) refineries globally.

Market Size (2022) 9,896 mbd
AAGR (2022-2027) >2%
Forecast Period 2023-2027
Historical Period 2017-2022
Major Planned and Announced Refineries ·       Vadinar

·       Hambantota III

·       Khalifa

·       Dos Bocas

·       Palu

·       Panjin II

Key Regions ·       Africa

·       Asia

·       Europe

·       Former Soviet Union

·       Middle East

·       North America

·       South America

Key Countries ·       The US

·       China

·       Russia

·       India

·       Canada

Enquire & Decide Discover the perfect solution for your business needs. Enquire now and let us help you make an informed decision before making a purchase.

Refinery Planned and Announced Coking Units

Some of the major refineries among the newly planned and announced coking units are Vadinar, Hambantota III, Khalifa, Dos Bocas, Palu, and Panjin II among others. Some of the key operators of these refineries are Nayara Energy Ltd, Hambantota Oil Refinery Pvt Ltd, PARCO Coastal Refinery Ltd, Petroleos Mexicanos, PT Palembang GMA Refinery Consortium, and Huajin Aramco Petrochemical Co Ltd respectively.

Refinery Coking Units by Regions

The key regions with the Refinery Coking Units are Africa, Asia, Europe, the Former Soviet Union, the Middle East, North America, and South America. Among the regions, Asia leads with the largest capacity contribution. Jamnagar I (India), Jamnagar II (India), Vadinar (India), Dayushan Island (China), and Fushun (China) are the major refineries with active coking units in the region.

Refinery Coking Units Market Analysis, by Regions, 2022 (%)

Refinery Market Analysis by Regions, 2022 (%)

For more regional insights into the Refinery Coking Units, download a free report sample

Refinery Coking Units by Countries

The key countries having the Refinery Coking Units are the US, China, Russia, India, and Canada, among others. The US led among all the other countries in the refinery market, followed by China and India.

Refinery Coking Units, by Countries, 2022 (%)

Refinery Market Analysis by Countries, 2022 (%)

For more regional insights into the Refinery market, download a free report sample

Segments Covered in the Report

Refinery Coking Units Regional Outlook (Capacity, mbd, 2017-2027)

  • Africa
  • Asia
  • Europe
  • Former Soviet Union
  • Middle East
  • North America
  • South America

Refinery Coking Units Country Outlook (Capacity, mbd, 2017-2027)

  • The US
  • China
  • Russia
  • India
  • Canada

Scope

The report:

  • Updated information on all active and upcoming (planned and announced) refinery coking units globally.
  • Provides key details such as refinery name, operator name, refinery type, and status for all active, suspended, planned, and announced refinery coking units in a country.
  • Provides an annual breakdown of new-build and expansion capital expenditure outlook by region and by key countries for the period 2023–2027.

Reasons to Buy

  • Obtain the most up-to-date information available on all active, suspended, planned, and announced refineries globally.
  • Identify growth segments and opportunities in the Refinery coking units.
  • Facilitate decision-making on the basis of strong refinery capacity data.
  • Assess your competitor’s refinery portfolio.

Table of Contents

1. Introduction 12

1.1 What is this Report About? 12

1.2 Market Definition 12

2. Global Refinery Coking Units, Snapshot 13

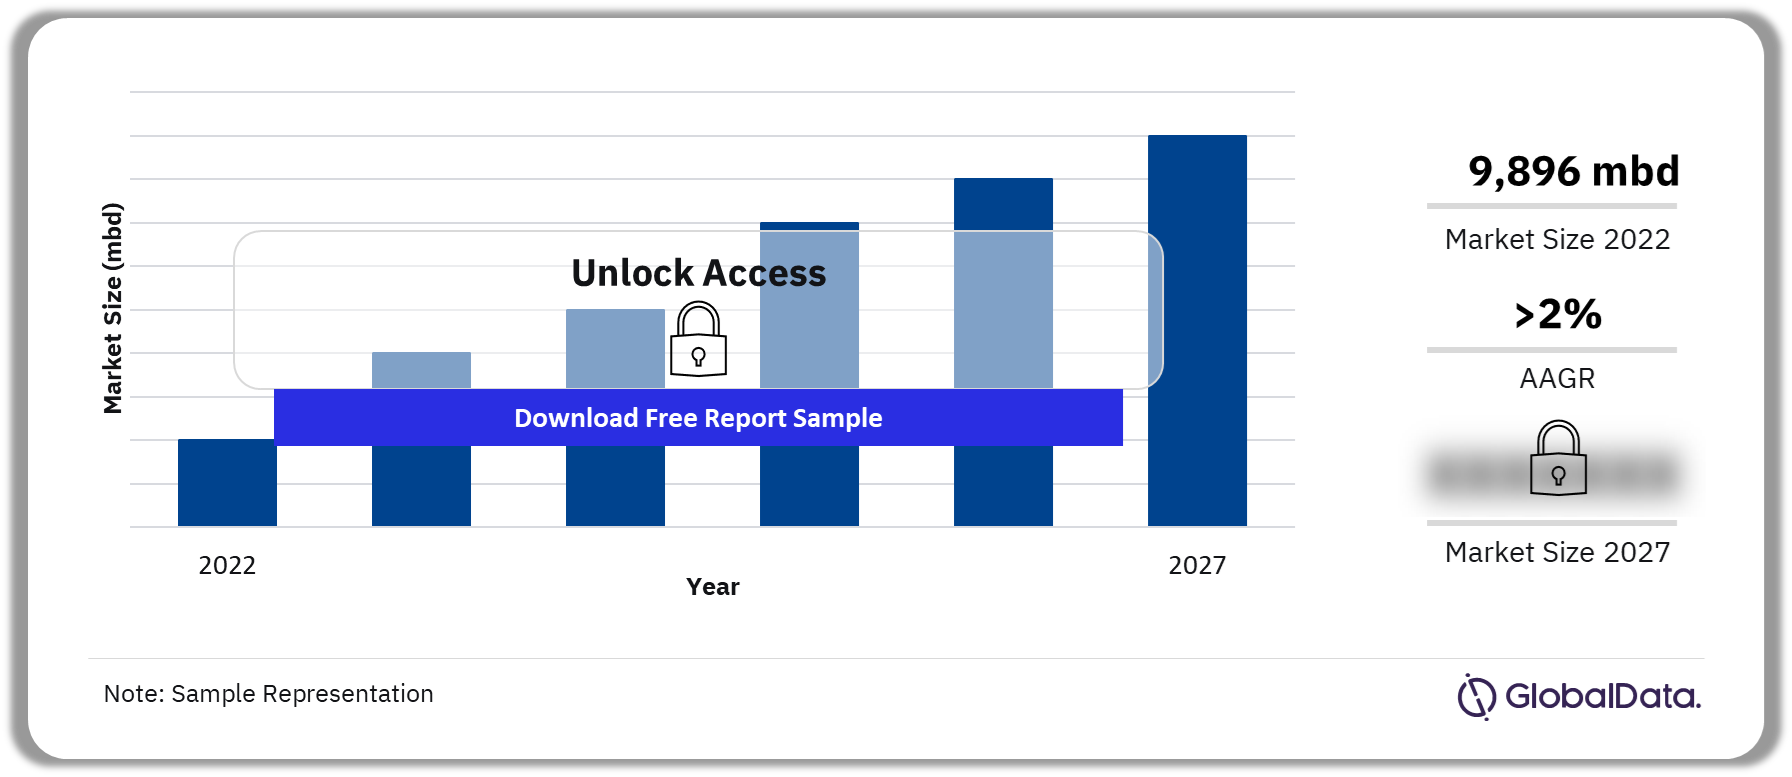
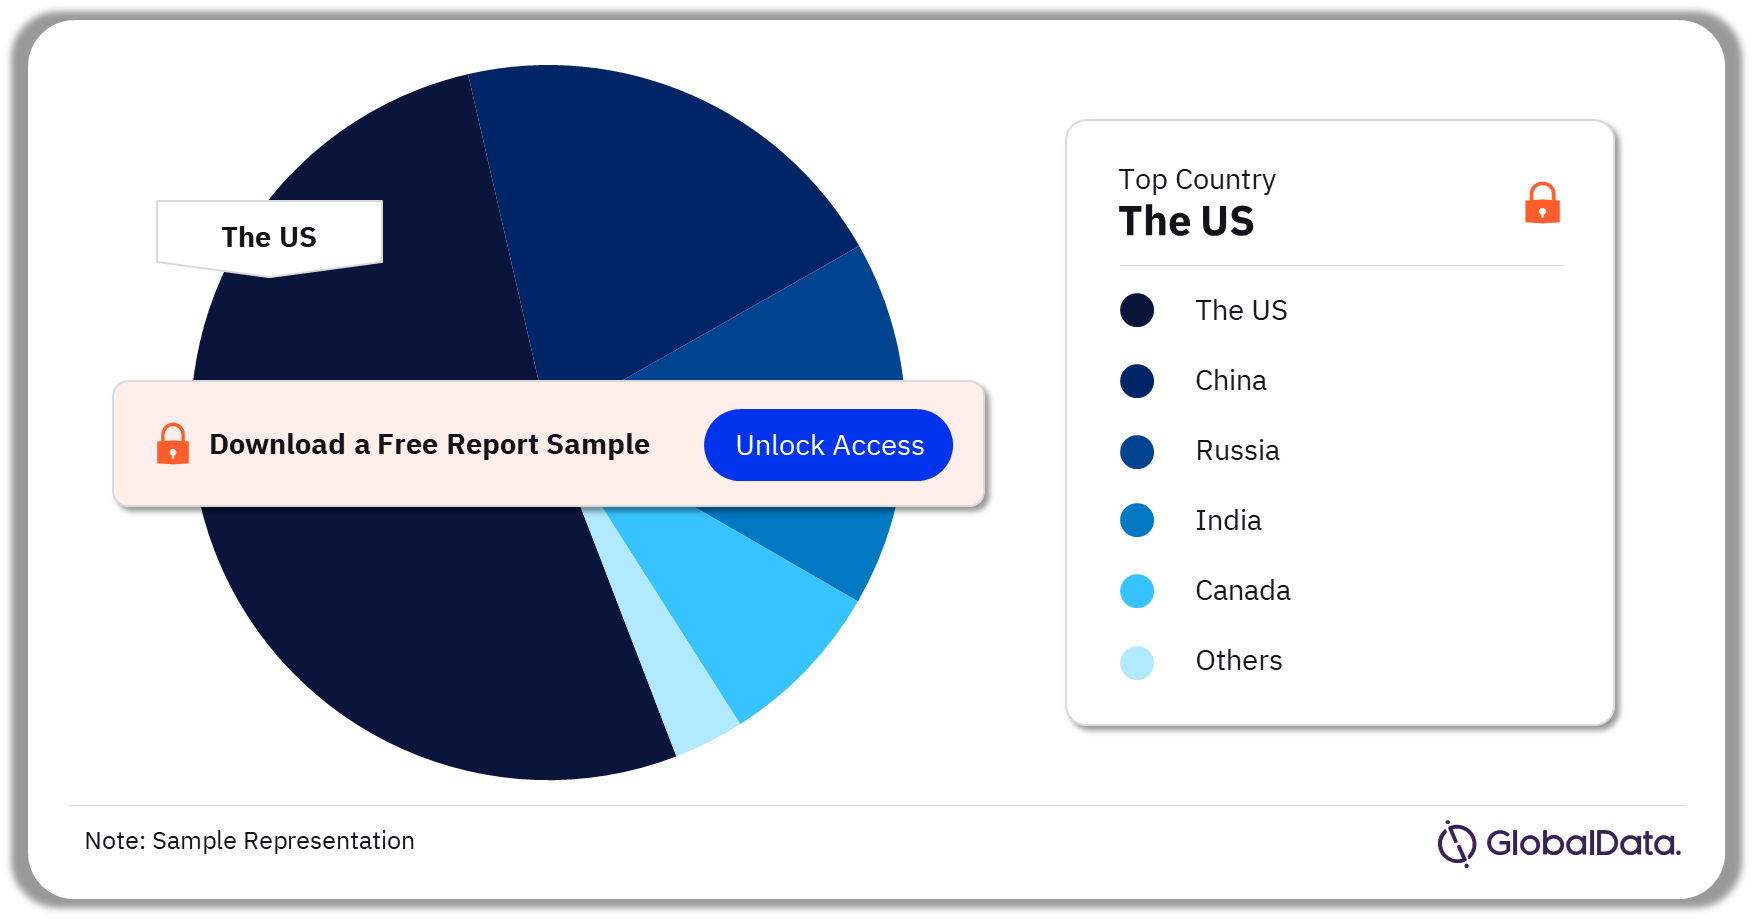
2.1 Global Refinery Coking Units, Key Data, 2022 13

Global Refinery Coking Units Capacity by Key Countries, 2017–2027 13

2.2 Global Refinery Coking Units, Planned and Announced Coking Units 15

Global Refinery Coking Units, Annual New Build and Expansion Capital Expenditure Outlook for Coking Units 16

Global Refinery Coking Units, Annual New Build and Expansion Capital Expenditure Outlook for Coking Units by Key Countries 17

2.3 Global Refinery Coking Units, New Coking Units and Capacity Expansions by Region 18

Global Refinery Coking Units, Coking Capacity Additions Through New and Existing Refinery Expansions by Region, 2023–2027 18

Global Refinery Coking Units, Coking Units Capacity Additions Through New Refineries by Region, 2023–2027 18

Global Refinery Coking Units, Coking Units Capacity Additions Existing Refinery Expansions by Region, 2023–2027 19

2.4 Global Refinery Coking Units, Regional Comparisons 20

Global Refinery Coking Units, Regional Comparison Based on Contribution to Global Coking Units Capacity, 2017–2027 20

3. Africa Refinery Coking Units 21

3.1 Africa Refinery Coking Units, Snapshot 21

Africa Refinery Coking Units, Key Data, 2022 21

Africa Refinery Coking Units Capacity by Key Countries, 2017–2027 22

3.2 Africa Refinery Coking Units, Planned and Announced Coking Units, Capacity Expansions and Capex by Country 23

Africa Refinery Coking Units, Annual New Build and Expansion Capital Expenditure Outlook for Coking Units 24

Africa Refinery Coking Units, Annual New Build and Expansion Capital Expenditure Outlook for Coking Units by Key Countries 25

3.3 Africa Refinery Coking Units, New Coking Units and Capacity Expansions by Key countries 26

Africa Refinery Coking Units, Coking Units Capacity Additions Through New Refineries by Key Countries, 2023–2027 26

3.4 Africa Refinery Coking Units, Egypt 27

Refinery Coking Units in Egypt, Coking Unit Capacity, 2017–2027 27

3.5 Africa Refinery Coking Units, Sudan 27

Refinery Coking Units in Sudan, Coking Unit Capacity, 2017–2027 27

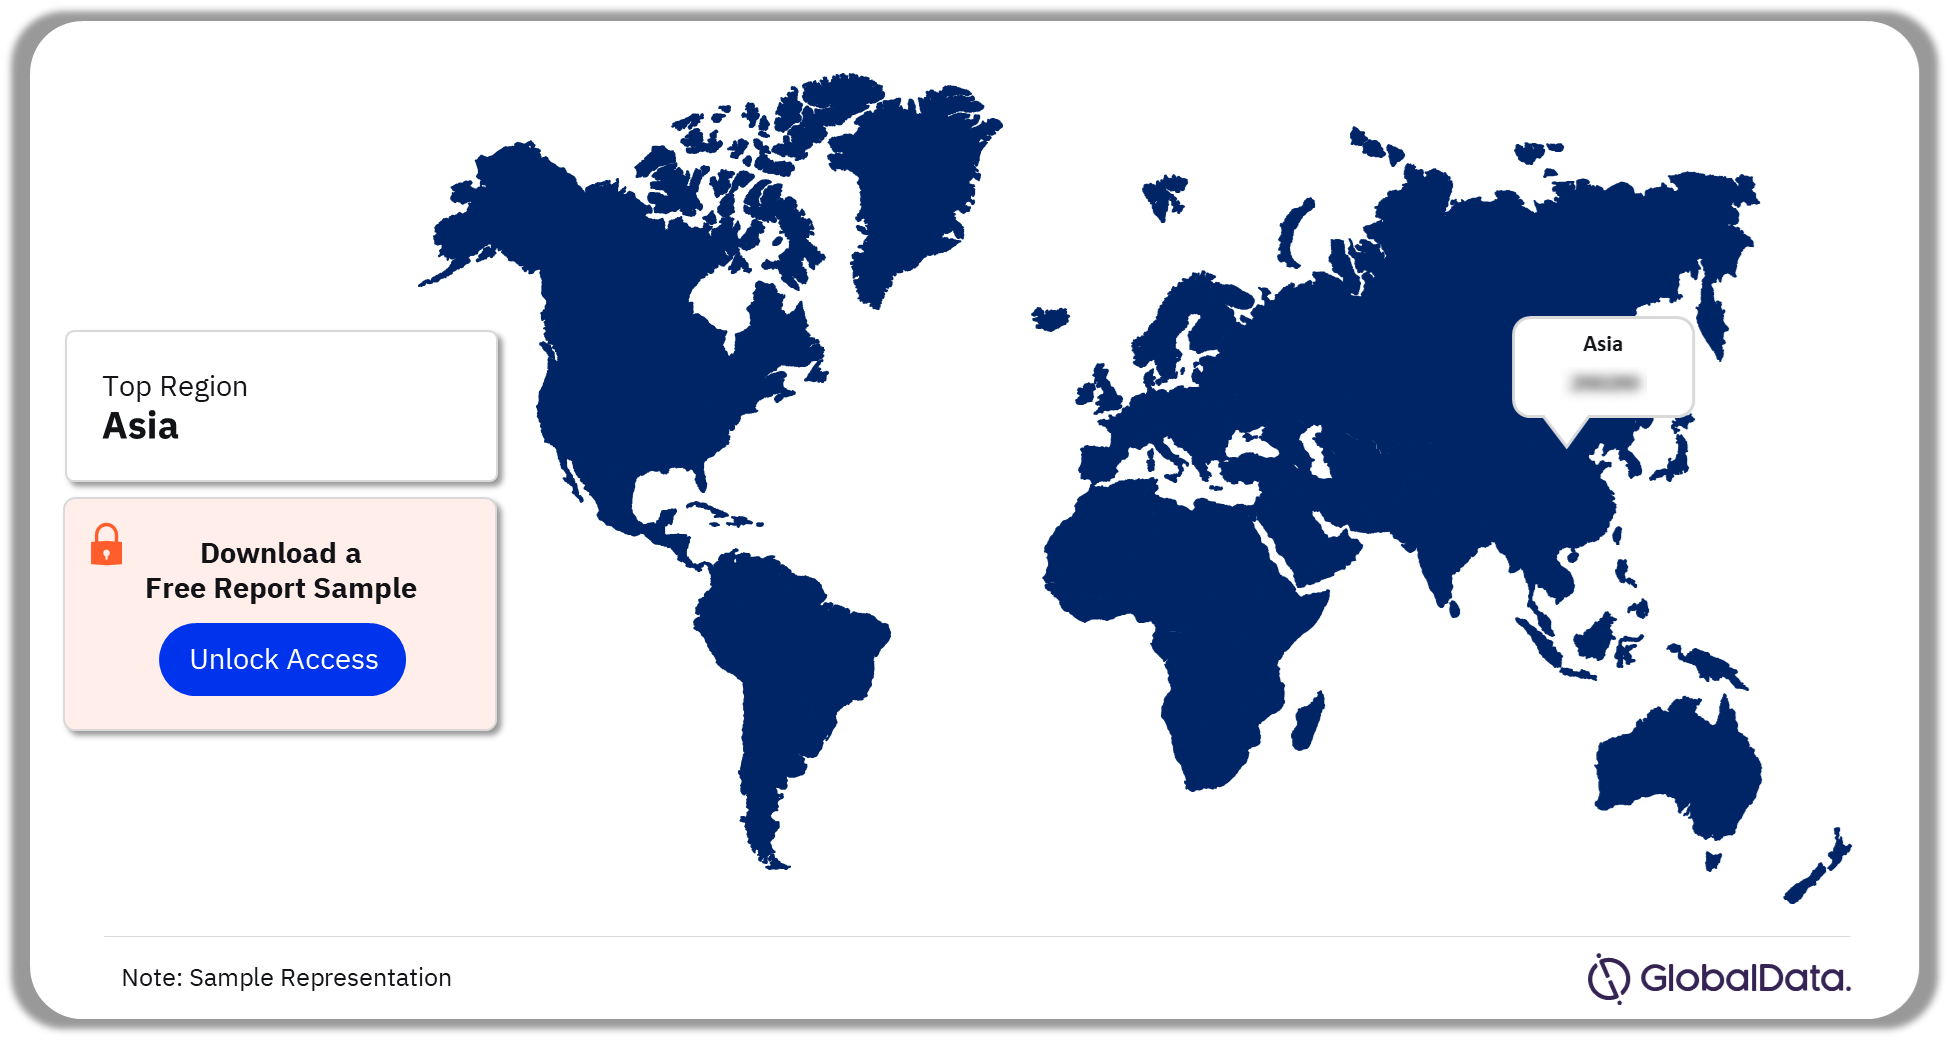
4. Asia Refinery Coking Units 28

4.1 Asia Refinery Coking Units, Snapshot 28

Asia Refinery Coking Units, Key Data, 2022 28

Asia Refinery Coking Units Capacity by Key Countries, 2017–2027 29

4.2 Asia Refinery Coking Units, Planned and Announced Coking Units, Capacity Expansions and Capex by Country 30

Asia Refinery Coking Units, Planned and Announced Coking Units, 2023–2027 30

Asia Refinery Coking Units, Annual New Build and Expansion Capital Expenditure Outlook for Coking Units 31

Asia Refinery Coking Units, Annual New Build and Expansion Capital Expenditure Outlook for coking Units by Key Countries 32

4.3 Asia Refinery Coking Units, New Coking Units and Capacity Expansions by Key countries 33

Asia Refinery Coking Units, Coking Units Capacity Additions Through New and Existing Refinery Expansions by Key Countries, 2023–2027 33

Asia Refinery Coking Units, Coking Units Capacity Additions Through New Refineries by Key Countries, 2023–2027 33

Asia Refinery Coking Units, Coking Units Capacity Additions Existing Refinery Expansions by Countries, 2023–2027 34

4.4 Asia Refinery Coking Units, China 35

Refinery Coking Units in China, Coking Unit Capacity, 2017–2027 35

4.5 Asia Refinery Coking Units, India 41

Refinery Coking Units in India, Coking Unit Capacity, 2017–2027 41

4.6 Asia Refinery Coking Units, Japan 42

Refinery Coking Units in Japan, Coking Unit Capacity, 2017–2027 42

4.7 Asia Refinery Coking Units, South Korea 42

Refinery Coking Units in South Korea, Coking Unit Capacity, 2017–2027 42

4.8 Asia Refinery Coking Units, Philippines 43

Refinery Coking Units in Philippines, Coking Unit Capacity, 2017–2027 43

4.9 Asia Refinery Coking Units, Taiwan 43

Refinery Coking Units in Taiwan, Coking Unit Capacity, 2017–2027 43

4.10 Asia Refinery Coking Units, Indonesia 43

Refinery Coking Units in Indonesia, Coking Unit Capacity, 2017–2027 43

4.11 Asia Refinery Coking Units, Brunei 44

Refinery Coking Units in Brunei, Coking Unit Capacity, 2017–2027 44

4.12 Asia Refinery Coking Units, Malaysia 44

Refinery Coking Units in Malaysia, Coking Unit Capacity, 2017–2027 44

4.13 Asia Refinery Coking Units, Myanmar 44

Refinery Coking Units in Myanmar, Coking Unit Capacity, 2017–2027 44

5. Caribbean Refinery Coking Units 45

5.1 Caribbean Refinery Coking Units, Snapshot 45

Caribbean Refinery Coking Units, Key Data, 2022 45

Caribbean Refinery Coking Units Capacity by Key Countries, 2017–2027 46

5.2 Caribbean Refinery Coking Units, Aruba 47

Refinery Coking Units in Aruba, Coking Unit Capacity, 2017–2027 47

5.3 Caribbean Refinery Coking Units, U.S. Virgin Islands 47

Refinery Coking Units in U.S. Virgin Islands, Coking Unit Capacity, 2017–2027 47

6. Europe Refinery Coking Units 48

6.1 Europe Refinery Coking Units, Snapshot 48

Europe Refinery Coking Units, Key Data, 2022 48

Europe Refinery Coking Units Capacity by Key Countries, 2017–2027 49

6.2 Europe Refinery Coking Units, Planned and Announced Coking Units, Capacity Expansions and Capex by Country 50

Europe Refinery Coking Units, Planned and Announced Coking Units, 2023–2027 50

Europe Refinery Coking Units, Annual New Build and Expansion Capital Expenditure Outlook for Coking Units 51

Europe Refinery Coking Units, Annual New Build and Expansion Capital Expenditure Outlook for Coking Units by Key Countries 52

6.3 Europe Refinery Coking Units, New Coking Units and Capacity Expansions by Key countries 53

Europe Refinery Coking Units, Coking Units Capacity Additions Existing Refinery Expansions by Countries, 2023–2027 53

6.4 Europe Refinery Coking Units, Spain 54

Refinery Coking Units in Spain, Coking Unit Capacity, 2017–2027 54

6.5 Europe Refinery Coking Units, Germany 54

Refinery Coking Units in Germany, Coking Unit Capacity, 2017–2027 54

6.6 Europe Refinery Coking Units, United Kingdom 55

Refinery Coking Units in United Kingdom, Coking Unit Capacity, 2017–2027 55

6.7 Europe Refinery Coking Units, Romania 55

Refinery Coking Units in Romania, Coking Unit Capacity, 2017–2027 55

6.8 Europe Refinery Coking Units, Belgium 56

Refinery Coking Units in Belgium, Coking Unit Capacity, 2017–2027 56

6.9 Europe Refinery Coking Units, Netherlands 56

Refinery Coking Units in Netherlands, Coking Unit Capacity, 2017–2027 56

6.10 Europe Refinery Coking Units, Denmark 57

Refinery Coking Units in Denmark, Coking Unit Capacity, 2017–2027 57

6.11 Europe Refinery Coking Units, Norway 57

Refinery Coking Units in Norway, Coking Unit Capacity, 2017–2027 57

6.12 Europe Refinery Coking Units, Poland 57

Refinery Coking Units in Poland, Coking Unit Capacity, 2017–2027 57

6.13 Europe Refinery Coking Units, Hungary 58

Refinery Coking Units in Hungary, Coking Unit Capacity, 2017–2027 58

6.14 Europe Refinery Coking Units, Portugal 58

Refinery Coking Units in Portugal, Coking Unit Capacity, 2017–2027 58

6.15 Europe Refinery Coking Units, Sweden 58

Refinery Coking Units in Sweden, Coking Unit Capacity, 2017–2027 58

6.16 Europe Refinery Coking Units, Serbia 59

Refinery Coking Units in Serbia, Coking Unit Capacity, 2017–2027 59

6.17 Europe Refinery Coking Units, Albania 59

Refinery Coking Units in Albania, Coking Unit Capacity, 2017–2027 59

6.18 Europe Refinery Coking Units, Croatia 59

Refinery Coking Units in Croatia, Coking Unit Capacity, 2017–2027 59

7. Former Soviet Union Refinery Coking Units 60

7.1 Former Soviet Union Refinery Coking Units, Snapshot 60

Former Soviet Union Refinery Coking Units, Key Data, 2022 60

Former Soviet Union Refinery Coking Units Capacity by Key Countries, 2017–2027 61

7.2 Former Soviet Union Refinery Coking Units, Planned and Announced Coking Units, Capacity Expansions and Capex by Country 62

Former Soviet Union Refinery Coking Units, Planned and Announced Coking Units, 2023–2027 62

Former Soviet Union Refinery Coking Units, Annual New Build and Expansion Capital Expenditure Outlook for Coking Units 63

Former Soviet Union Refinery Coking Units, Annual New Build and Expansion Capital Expenditure Outlook for Coking Units by Key Countries 64

7.3 Former Soviet Union Refinery Coking Units, New Coking Units and Capacity Expansions by Key countries 65

Former Soviet Union Refinery Coking Units, Coking Units Capacity Additions Existing Refinery Expansions by Countries, 2023–2027 65

7.4 Former Soviet Union Refinery Coking Units, Russia 66

Refinery Coking Units in Russia, Coking Unit Capacity, 2017–2027 66

7.5 Former Soviet Union Refinery Coking Units, Turkmenistan 67

Refinery Coking Units in Turkmenistan, Coking Unit Capacity, 2017–2027 67

7.6 Former Soviet Union Refinery Coking Units, Kazakhstan 67

Refinery Coking Units in Kazakhstan, Coking Unit Capacity, 2017–2027 67

7.7 Former Soviet Union Refinery Coking Units, Azerbaijan 68

Refinery Coking Units in Azerbaijan, Coking Unit Capacity, 2017–2027 68

7.8 Former Soviet Union Refinery Coking Units, Belarus 68

Refinery Coking Units in Belarus, Coking Unit Capacity, 2017–2027 68

7.9 Former Soviet Union Refinery Coking Units, Uzbekistan 68

Refinery Coking Units in Uzbekistan, Coking Unit Capacity, 2017–2027 68

8. Middle East Refinery Coking Units 69

8.1 Middle East Refinery Coking Units, Snapshot 69

Middle East Refinery Coking Units, Key Data, 2022 69

Middle East Refinery Coking Units Capacity by Key Countries, 2017–2027 70

8.2 Middle East Refinery Coking Units, Planned and Announced Coking Units, Capacity Expansions and Capex by Country 71

Middle East Refinery Coking Units, Planned and Announced Coking Units, 2023–2027 71

Middle East Refinery Coking Units, Annual New Build and Expansion Capital Expenditure Outlook for Coking Units 72

Middle East Refinery Coking Units, Annual New Build and Expansion Capital Expenditure Outlook for Coking Units by Key Countries 73

8.3 Middle East Refinery Coking Units, New Coking Units and Capacity Expansions by Key countries 74

Middle East Refinery Coking Units, Coking Units Capacity Additions Through New Refineries by Key Countries, 2023–2027 74

8.4 Middle East Refinery Coking Units, Saudi Arabia 75

Refinery Coking Units in Saudi Arabia, Coking Unit Capacity, 2017–2027 75

8.5 Middle East Refinery Coking Units, Turkey 75

Refinery Coking Units in Turkey, Coking Unit Capacity, 2017–2027 75

8.6 Middle East Refinery Coking Units, Kuwait 76

Refinery Coking Units in Kuwait, Coking Unit Capacity, 2017–2027 76

8.7 Middle East Refinery Coking Units, United Arab Emirates 76

Refinery Coking Units in United Arab Emirates, Coking Unit Capacity, 2017–2027 76

8.8 Middle East Refinery Coking Units, Syria 77

Refinery Coking Units in Syria, Coking Unit Capacity, 2017–2027 77

8.9 Middle East Refinery Coking Units, Oman 77

Refinery Coking Units in Oman, Coking Unit Capacity, 2017–2027 77

8.10 Middle East Refinery Coking Units, Iraq 77

Refinery Coking Units in Iraq, Coking Unit Capacity, 2017–2027 77

9. North America Refinery Coking Units 78

9.1 North America Refinery Coking Units, Snapshot 78

North America Refinery Coking Units, Key Data, 2022 78

North America Refinery Coking Units Capacity by Key Countries, 2017–2027 79

9.2 North America Refinery Coking Units, Planned and Announced Coking Units, Capacity Expansions and Capex by Country 80

North America Refinery Coking Units, Planned and Announced coking Units, 2023–2027 80

North America Refinery Coking Units, Annual New Build and Expansion Capital Expenditure Outlook for Coking Units 81

North America Refinery Coking Units, Annual New Build and Expansion Capital Expenditure Outlook for Coking Units by Key Countries 82

9.3 North America Refinery Coking Units, New Coking Units and Capacity Expansions by Key countries 83

North America Refinery Coking Units, Coking Units Capacity Additions Through New and Existing Refinery Expansions by Key Countries, 2023–2027 83

North America Refinery Coking Units, Coking Units Capacity Additions Through New Refineries by Key Countries, 2023–2027 83

North America Refinery Coking Units, Coking Units Capacity Additions Existing Refinery Expansions by Countries, 2023–2027 83

9.4 Refinery Coking Units in the US, Gulf Coast (PADD 3) 84

Refinery Coking Units in Gulf Coast, Coking Unit Capacity, 2017–2027 84

9.5 Refinery Coking Units in the US, Midwest (PADD 2) 86

Refinery Coking Units in Midwest, Coking Unit Capacity, 2017–2027 86

9.6 Refinery Coking Units in the US, West Coast (PADD 5) 87

Refinery Coking Units in West Coast, Coking Unit Capacity, 2017–2027 87

9.7 Refinery Coking Units in the US, Rocky Mountain (PADD 4) 88

Refinery Coking Units in Rocky Mountain, Coking Unit Capacity, 2017–2027 88

9.8 Refinery Coking Units in the US, East Coast (PADD 1) 89

Refinery Coking Units in East Coast, Coking Unit Capacity, 2017–2027 89

9.9 North America Refinery Coking Units, Canada 90

Refinery Coking Units in Canada, Coking Unit Capacity, 2017–2027 90

9.10 North America Refinery Coking Units, Mexico 91

Refinery Coking Units in Mexico, Coking Unit Capacity, 2017–2027 91

10. South America Refinery Coking Units 92

10.1 South America Refinery Coking Units, Snapshot 92

South America Refinery Coking Units, Key Data, 2022 92

South America Refinery Coking Units Capacity by Key Countries, 2017–2027 93

10.2 South America Refinery Coking Units, Planned and Announced Coking Units, Capacity Expansions and Capex by Country 94

South America Refinery Coking Units, Planned and Announced Coking Units, 2023–2027 94

South America Refinery Coking Units, Annual New Build and Expansion Capital Expenditure Outlook for Coking Units 95

South America Refinery Coking Units, Annual New Build and Expansion Capital Expenditure Outlook for Coking Units by Key Countries 96

10.3 South America Refinery Coking Units, New Coking Units and Capacity Expansions by Key Countries 97

South America Refinery Coking Units, Coking Units Capacity Additions Through New and Existing Refinery Expansions by Key Countries, 2023–2027 97

South America Refinery Coking Units, Coking Units Capacity Additions Through New Refineries by Key Countries, 2023–2027 97

South America Refinery Coking Units, Coking Units Capacity Additions Existing Refinery Expansions by Countries, 2023–2027 97

10.4 South America Refinery Coking Units, Brazil 98

Refinery Coking Units in Brazil, Coking Unit Capacity, 2017–2027 98

10.5 South America Refinery Coking Units, Venezuela 99

Refinery Coking Units in Venezuela, Coking Unit Capacity, 2017–2027 99

10.6 South America Refinery Coking Units, Argentina 99

Refinery Coking Units in Argentina, Coking Unit Capacity, 2017–2027 99

10.7 South America Refinery Coking Units, Colombia 100

Refinery Coking Units in Colombia, Coking Unit Capacity, 2017–2027 100

10.8 South America Refinery Coking Units, Chile 100

Refinery Coking Units in Chile, Coking Unit Capacity, 2017–2027 100

10.9 South America Refinery Coking Units, Peru 101

Refinery Coking Units in Peru, Coking Unit Capacity, 2017–2027 101

11. Appendix 102

11.1 Abbreviations 102

11.2 Status Definition 102

11.3 States by PADD Regions Included in the Report 103

11.4 Methodology 103

Coverage 103

Secondary Research 103

About GlobalData 104

Contact Us 105

Table

Table 1: Refinery coking units, Global, key statistics, 2022 13

Table 2: Refinery coking units, Global, capacity by key countries (mbd), 2017–2027 13

Table 3: Refinery coking units, Global, top 10 planned and announced coking units details, 2023–2027 15

Table 4: Global, annual new build and expansion capital expenditure for coking units ($M), 2023–2027 16

Table 5: Refinery coking units, Global, annual new build and expansion capital expenditure outlook for coking units by key countries ($M), 2023–2027* 17

Table 6: Refinery coking units, Global, coking units capacity additions through new and existing refinery expansions by region (mbd), 2023–2027 18

Table 7: Refinery coking units, Global, coking units capacity additions through new refineries by region (mbd), 2023–2027 18

Table 8: Refinery coking units, Global, coking units capacity additions through existing refinery expansions by region (mbd), 2023–2027 19

Table 9: Refinery coking units, regional comparison, contribution (%) to global coking units capacity, 2017–2027 20

Table 10: Refinery coking units, Africa, Key Statistics, 2022 21

Table 11: Refinery coking units, Africa, capacity by country (mbd), 2017–2027 22

Table 12: Refinery coking units, Africa, planned and announced coking unit details, 2023–2027 23

Table 13: Refinery coking units, Africa, annual new build and expansion capital expenditure outlook for coking units ($M), 2023–2027 24

Table 14: Refinery coking units, Africa, annual new build and expansion capital expenditure outlook for coking units by country ($M), 2023–2027* 25

Table 15: Refinery coking units, Africa, Coking Units capacity additions through new refineries by key countries (mbd), 2023–2027 26

Table 16: Refinery coking units, Egypt, coking unit capacity (mbd), 2017–2027 27

Table 17: Refinery coking units, Sudan, coking unit capacity (mbd), 2017–2027 27

Table 18: Refinery coking units, Asia, key statistics, 2022 28

Table 19: Refinery coking units, Asia, capacity by key countries (mbd), 2017–2027 29

Table 20: Refinery coking units, Asia, planned and announced coking units details, 2023–2027 30

Table 21: Refinery coking units, Asia, annual new build and expansion capital expenditure outlook for coking units ($M), 2023–2027 31

Table 22: Refinery coking units, Asia, annual new build and expansion capital expenditure outlook for coking units by country ($M), 2023–2027* 32

Table 23: Refinery coking units, Asia, coking unit capacity additions through new and existing refinery expansions by country (mbd), 2023–2027 33

Table 24: Refinery coking units, Asia, coking unit capacity additions through new refineries by country (mbd), 2023–2027 33

Table 25: Refinery coking units, Asia, coking unit capacity additions through existing refinery expansions by country (mbd), 2023–2027 34

Table 26: Refinery coking units, China, coking unit capacity (mbd), 2017–2027 35

Table 27: Refinery coking units, India, coking unit capacity (mbd), 2017–2027 41

Table 28: Refinery coking units, Japan, coking unit capacity (mbd), 2017–2027 42

Table 29: Refinery coking units, South Korea, coking unit capacity (mbd), 2017–2027 42

Table 30: Refinery coking units, Philippines, coking unit capacity (mbd), 2017–2027 43

Table 31: Refinery coking units, Taiwan, coking unit capacity (mbd), 2017–2027 43

Table 32: Refinery coking units, Indonesia, coking unit capacity (mbd), 2017–2027 43

Table 33: Refinery coking units, Brunei, coking unit capacity (mbd), 2017–2027 44

Table 34: Refinery coking units, Malaysia, coking unit capacity (mbd), 2017–2027 44

Table 35: Refinery coking units, Myanmar, coking unit capacity (mbd), 2017–2027 44

Table 36: Refinery coking units, Caribbean, key statistics, 2022 45

Table 37: Refinery coking units, Caribbean, capacity by country (mbd), 2017–2027 46

Table 38: Refinery coking units, Aruba, coking unit capacity (mbd), 2017–2027 47

Table 39: Refinery coking units, U.S. Virgin Islands, coking unit capacity (mbd), 2017–2027 47

Table 40: Refinery coking units, Europe, key statistics, 2022 48

Table 41: Refinery coking units, Europe, capacity by key countries (mbd), 2017–2027 49

Table 42: Refinery coking units, Europe, planned and announced coking unit details, 2023–2027 50

Table 43: Refinery coking units, Europe, annual new build and expansion capital expenditure outlook for coking units ($M), 2023–2027 51

Table 44: Refinery coking units, Europe, annual new build and expansion capital expenditure outlook for coking units by country ($M), 2023–2027* 52

Table 45: Refinery coking units, Europe, coking unit capacity additions through existing refinery expansions by country (mbd), 2023–2027 53

Table 46: Refinery coking units, Spain, coking unit capacity (mbd), 2017–2027 54

Table 47: Refinery coking units, Germany, coking unit capacity (mbd), 2017–2027 54

Table 48: Refinery coking units, UK, coking unit capacity (mbd), 2017–2027 55

Table 49: Refinery coking units, Romania, coking unit capacity (mbd), 2017–2027 55

Table 50: Refinery coking units, Belgium, coking unit capacity (mbd), 2017–2027 56

Table 51: Refinery coking units, Netherlands, coking unit capacity (mbd), 2017–2027 56

Table 52: Refinery coking units, Denmark, coking unit capacity (mbd), 2017–2027 57

Table 53: Refinery coking units, Norway, coking unit capacity (mbd), 2017–2027 57

Table 54: Refinery coking units, Poland, coking unit capacity (mbd), 2017–2027 57

Table 55: Refinery coking units, Hungary, coking unit capacity (mbd), 2017–2027 58

Table 56: Refinery coking units, Portugal, coking unit capacity (mbd), 2017–2027 58

Table 57: Refinery coking units, Sweden, coking unit capacity (mbd), 2017–2027 58

Table 58: Refinery coking units, Serbia, coking unit capacity (mbd), 2017–2027 59

Table 59: Refinery coking units, Albania, coking unit capacity (mbd), 2017–2027 59

Table 60: Refinery coking units, Croatia, coking unit capacity (mbd), 2017–2027 59

Table 61: Refinery coking units, Former Soviet Union, key statistics, 2022 60

Table 62: Refinery coking units, Former Soviet Union, capacity by key countries (mbd), 2017–2027 61

Table 63: Refinery coking units, Former Soviet Union, planned and announced coking units details, 2023–2027 62

Table 64: Refinery coking units, Former Soviet Union, annual new build and expansion capital expenditure outlook for coking units ($M), 2023–2027 63

Table 65: Refinery coking units, Former Soviet Union, annual new build and expansion capital expenditure outlook for coking units by country ($M), 2023–2027* 64

Table 66: Refinery coking units, Former Soviet Union, coking unit capacity additions through existing refinery expansions by country (mbd), 2023–2027 65

Table 67: Refinery coking units, Russia, coking unit capacity (mbd), 2017–2027 66

Table 68: Refinery coking units, Turkmenistan, coking unit capacity (mbd), 2017–2027 67

Table 69: Refinery coking units, Kazakhstan, coking unit capacity (mbd), 2017–2027 67

Table 70: Refinery coking units, Azerbaijan, coking unit capacity (mbd), 2017–2027 68

Table 71: Refinery Coking Units, Belarus, coking unit capacity (mbd), 2017–2027 68

Table 72: Refinery coking units, Uzbekistan, coking unit capacity (mbd), 2017–2027 68

Table 73: Refinery coking units, Middle East, key statistics, 2022 69

Table 74: Refinery coking units, Middle East, capacity by countries (mbd), 2017–2027 70

Table 75: Refinery coking units, Middle East, planned and announced coking unit details, 2023–2027 71

Table 76: Refinery coking units, Middle East, annual new build and expansion capital expenditure outlook for coking units ($M), 2023–2027 72

Table 77: Refinery coking units, Middle East, annual new build and expansion capital expenditure outlook for coking units by country ($M), 2023–2027* 73

Table 78: Refinery coking units, Middle East, Coking Units capacity additions through new refineries by country (mbd), 2023–2027 74

Table 79: Refinery coking units, Saudi Arabia, coking unit capacity (mbd), 2017–2027 75

Table 80: Refinery coking units, Turkey, coking unit capacity (mbd), 2017–2027 75

Table 81: Refinery coking units, Kuwait, coking unit capacity (mbd), 2017–2027 76

Table 82: Refinery coking units, United Arab Emirates, coking unit capacity (mbd), 2017–2027 76

Table 83: Refinery Coking Units, Syria, coking unit capacity (mbd), 2017–2027 77

Table 84: Refinery coking units, Oman, coking unit capacity (mbd), 2017–2027 77

Table 85: Refinery coking units, Iraq, coking unit capacity (mbd), 2017–2027 77

Table 86: Refinery coking units, North America, Key Statistics, 2022 78

Table 87: Refinery coking units, North America, capacity by country (mbd), 2017–2027 79

Table 88: Refinery coking units, North America, planned and announced coking units details, 2023–2027 80

Table 89: Refinery coking units, North America, annual new build and expansion capital expenditure outlook for coking units ($M), 2023–2027 81

Table 90: Refinery coking units, North America, annual new build and expansion capital expenditure outlook for coking unit by country ($M), 2023–2027* 82

Table 91: Refinery coking units, North America, coking unit capacity additions through new and existing refinery expansions by country (mbd), 2023–2027 83

Table 92: Refinery coking units, North America, coking unit capacity additions through new refineries by country (mbd), 2023–2027 83

Table 93: Refinery coking units, North America, coking unit capacity additions through existing refinery expansions by country (mbd), 2023–2027 83

Table 94: Refinery coking units, Gulf Coast, coking unit capacity (mbd), 2017–2027 84

Table 95: Refinery coking units, Midwest, coking unit capacity (mbd), 2017–2027 86

Table 96: Refinery coking units, West Coast, coking unit capacity (mbd), 2017–2027 87

Table 97: Refinery coking units, Rocky Mountain, coking unit capacity (mbd), 2017–2027 88

Table 98: Refinery coking units, Rocky Mountain, coking unit capacity (mbd), 2017–2027 89

Table 99: Refinery coking units, Canada, coking unit capacity (mbd), 2017–2027 90

Table 100: Refinery coking units, Mexico, coking unit capacity (mbd), 2017–2027 91

Table 101: Refinery coking units, South America, Key Statistics, 2022 92

Table 102: Refinery coking units, South America, capacity by key countries (mbd), 2017–2027 93

Table 103: Refinery coking units, South America, planned and announced coking units details, 2023–2027 94

Table 104: Refinery coking units, South America, annual new build and expansion capital expenditure outlook for coking units ($M), 2023–2027 95

Table 105: Refinery coking Units, South America, annual new build and expansion capital expenditure outlook for coking units by country ($M), 2023–2027* 96

Table 106: Refinery coking units, South America, coking units capacity additions through new and existing refinery expansions by country (mbd), 2023–2027 97

Table 107: Refinery coking units, South America, coking units capacity additions through new refineries by country (mbd), 2023–2027 97

Table 108: Refinery coking units, South America, coking units capacity additions through existing refinery expansions by country (mbd), 2023–2027 97

Table 109: Refinery coking units, Brazil, coking unit capacity (mbd), 2017–2027 98

Table 110: Refinery coking units, Venezuela, coking unit capacity (mbd), 2017–2027 99

Table 111: Refinery coking units, Argentina, coking unit capacity (mbd), 2017–2027 99

Table 112: Refinery coking units, Colombia, coking unit capacity (mbd), 2017–2027 100

Table 113: Refinery coking units, Chile, coking unit capacity (mbd), 2017–2027 100

Table 114: Refinery Coking Units, Peru, coking unit capacity (mbd), 2017–2027 101

Figures

Figure 1: Refinery coking units, Global, capacity market share vis-à-vis growth by key countries, 2017–2022 14

Figure 2: Refinery coking units, Global, annual new build and expansion capital expenditure outlook for coking units ($B), 2023–2027 16

Figure 3: Refinery coking units, Global, annual new build and expansion capital expenditure outlook for coking units by key countries ($M), 2023–2027 17

Figure 4: Refinery coking units, regional comparison, contribution (%) to global coking units capacity, 2023–2027 20

Figure 5: Refinery coking units, Africa, capacity market share vis-à-vis growth by country, 2017–2022 22

Figure 6: Refinery coking units, Africa, annual new build and expansion capital expenditure outlook for coking units ($M), 2023–2027* 24

Figure 7: Refinery coking units, Africa, annual new build and expansion capital expenditure outlook for coking units by country ($M), 2023–2027* 25

Figure 8: Refinery coking units, Asia, capacity market share vis-à-vis growth by key countries, 2017–2022 29

Figure 9: Refinery coking units, Asia, annual new build and expansion capital expenditure outlook for coking units ($B), 2023–2027 31

Figure 10: Refinery coking units, Asia, annual new build and expansion capital expenditure outlook for coking units by country ($M), 2023–2027 32

Figure 11: Refinery coking units, Caribbean, capacity market share vis-à-vis growth by country, 2017–2022 46

Figure 12: Refinery coking units, Europe, capacity market share vis-à-vis growth by key countries, 2017–2022 49

Figure 13: Refinery coking units, Europe, annual new build and expansion capital expenditure outlook for coking units ($M), 2023–2027* 51

Figure 14: Refinery coking units, Europe, annual new build and expansion capital expenditure outlook for coking units by country ($M), 2023–2027* 52

Figure 15: Refinery coking units, Former Soviet Union, capacity market share vis-à-vis growth by key countries, 2017–2022 61

Figure 16: Refinery coking units, Former Soviet Union, annual new build and expansion capital expenditure outlook for coking units ($M), 2023–2027 63

Figure 17: Refinery coking units, Former Soviet Union, annual new build and expansion capital expenditure outlook for coking units by country ($M), 2023–2027 64

Figure 18: Refinery coking units, Middle East, capacity market share vis-à-vis growth by countries, 2017–2022 70

Figure 19: Refinery coking units, Middle East, annual new build and expansion capital expenditure outlook for coking units ($M), 2023–2027 72

Figure 20: Refinery coking units, Middle East, annual new build and expansion capital expenditure outlook for coking units by country ($M), 2023–2027 73

Figure 21: Refinery coking units, North America, capacity market share vis-à-vis growth by country, 2017–2022 79

Figure 22: Refinery coking units, North America, annual new build and expansion capital expenditure outlook for coking units ($M), 2023–2027 81

Figure 23: Refinery coking units, North America, annual new build and expansion capital expenditure outlook for coking units by country ($M), 2023–2027 82

Figure 24: Refinery coking units, South America, capacity market share vis-à-vis growth by key countries, 2017–2022 93

Figure 25: Refinery coking units, South America, annual new build and expansion capital expenditure outlook for coking units ($M), 2023–2027 95

Figure 26: Refinery coking units, South America, annual new build and expansion capital expenditure outlook for coking units by country ($M), 2023–2027 96

Frequently asked questions

Refinery Coking Units Capacity and Capital Expenditure with Details of All Operating and Planned Coking Units to 2027 standard reports
Currency USD
$5,000

Can be used by individual purchaser only

$15,000

Can be shared globally by unlimited users within the purchasing corporation e.g. all employees of a single company


Undecided about purchasing this report?

Enquire Before Buying Request a Free Sample

Get in touch to find out about multi-purchase discounts

reportstore@globaldata.com
Tel +44 20 7947 2745

Every customer’s requirement is unique. With over 220,000 construction projects tracked, we can create a tailored dataset for you based on the types of projects you are looking for. Please get in touch with your specific requirements and we can send you a quote.

Sample Report

Refinery Coking Units Capacity and Capital Expenditure with Details of All Operating and Planned Coking Units to 2027 was curated by the best experts in the industry and we are confident about its unique quality. However, we want you to make the most beneficial decision for your business, so we offer free sample pages to help you:

  • Assess the relevance of the report
  • Evaluate the quality of the report
  • Justify the cost

Download your copy of the sample report and make an informed decision about whether the full report will provide you with the insights and information you need.

Below is a sample report to understand what you are buying

See what our customers are saying

“The GlobalData platform is our go-to tool for intelligence services. GlobalData provides an easy way to access comprehensive intelligence data around multiple sectors, which essentially makes it a one-for-all intelligence platform, for tendering and approaching customers.

GlobalData is very customer orientated, with a high degree of personalised services, which benefits everyday use. The highly detailed project intelligence and forecast reports can be utilised across multiple departments and workflow scopes, from operational to strategic level, and often support strategic decisions. GlobalData Analytics and visualisation solutions has contributed positively when preparing management presentations and strategic papers.”

Business Intelligence & Marketing Manager, SAL Heavy Lift

“COVID-19 has caused significant interference to our business and the COVID-19 intelligence from GlobalData has helped us reach better decisions around strategy. These two highlights have helped enormously to understand the projections into the future concerning our business units, we also utilise the project database to source new projects for Liebherr-Werk to use as an additional source to pitch for new business.”

Market Analyst & Management, Liebherr-Werk

Your daily news has saved me a lot of time and keeps me up-to-date with what is happening in the market, I like that you almost always have a link to the source origin. We also use your market data in our Strategic Business Process to support our business decisions. By having everything in one place on the Intelligence Center it has saved me a lot of time versus looking on different sources, the alert function also helps with this.

Head of Key Accounts, Saab AB

Having used several other market research companies, I find that GlobalData manages to provide that ‘difficult-to-get’ market data that others can’t, as well as very diverse and complete consumer surveys.

Marketing Intelligence Manager, Portugal Foods

Our experience with GlobalData has been very good, from the platform itself to the people. I find that the analysts and the account team have a high level of customer focus and responsiveness and therefore I can always rely on. The platform is more holistic than other providers. It is convenient and almost like a one stop shop. The pricing suite is highly competitive and value for our organisation.

I like reports that inform new segments such as the analysis on generation Z, millennials, the impact of COVID 19 to our banking customers and their new channel habits. Secondly the specialist insight on affluent sector significantly increases our understanding about this group of customers. The combination of those give us depth and breadth of the evolving market.

I’m in the business of answering and helping people make decisions so with the intelligence center I can do that, effectively and efficiently. I can share quickly key insights that answer and satisfy our country stakeholders by giving them many quality studies and primary research about competitive landscape beyond the outlook of our bank. It helps me be seen as an advisory partner and that makes a big difference. A big benefit of our subscription is that no one holds the whole data and because it allows so many people, so many different parts of our organisation have access, it enables all teams to have the same level of knowledge and decision support.

Head of Customer Insight and Research, Standard Chartered

“I know that I can always rely on Globaldata’s work when I’m searching for the right consumer and market insights. I use Globaldata insights to understand the changing market & consumer landscape and help create better taste & wellbeing solutions for our customers in food, beverage and healthcare industries.

Globaldata has the right data and the reports are of very high quality compared to your competitors. Globaldata not only has overall market sizes & consumer insights on food & beverages but also provides insights at the ingredient & flavour level. That is key for B2B companies like Givaudan. This way we understand our customers’ business and also gain insight to our unique industry”

Head of Consumer Sensory Insights, Givaudan

GlobalData provides a great range of information and reports on various sectors that is highly relevant, timely, easy to access and utilise.  The reports and data dashboards help engagement with clients; they provide valuable industry and market insights that can enrich client conversations and can help in the shaping of value propositions. Moreover, using GlobalData products has helped increase my knowledge of the finance sector, the players within it, and the general threats and opportunities.

I find the consumer surveys that are carried out to be extremely beneficial and not something I have seen anywhere else. They provided an insightful view of why and which consumers take (or don’t) particular financial products. This can help shape conversations with clients to ensure they make the right strategic decisions for their business.

One of the challenges I have found is that data in the payments space is often piecemeal. With GD all of the data I need is in one place, but it also comes with additional market reports that provide useful extra context and information. Having the ability to set-up alerts on relevant movements in the industry, be it competitors or customers, and have them emailed directly to me, ensures I get early sight of industry activity and don’t have to search for news.

Senior Account Manager, TSYS
Go even deeper with GlobalData Intelligence Center

Every Company Report we produce is powered by the GlobalData Intelligence Center.

Subscribing to our intelligence platform means you can monitor developments at Refinery Coking Units Capacity and Capital Expenditure with Details of All Operating and Planned Coking Units to 2027 in real time.

  • Access a live Refinery Coking Units Capacity and Capital Expenditure with Details of All Operating and Planned Coking Units to 2027 dashboard for 12 months, with up-to-the-minute insights.
  • Fuel your decision making with real-time deal coverage and media activity.
  • Turn insights on financials, deals, products and pipelines into powerful agents of commercial advantage.